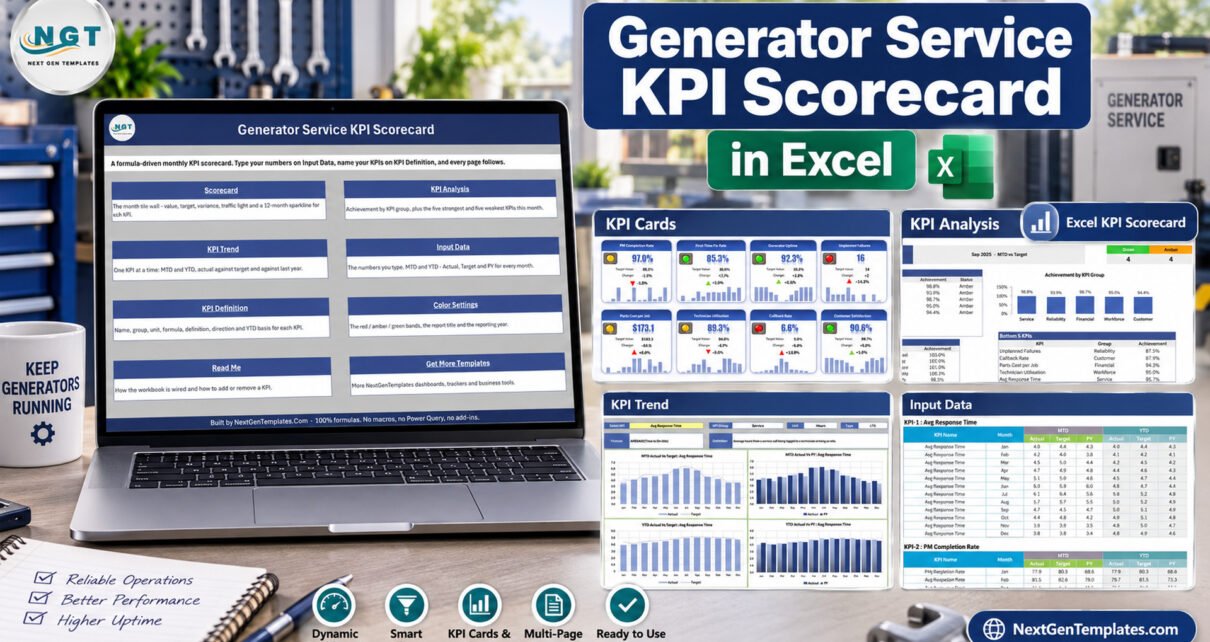
Generator Service KPI Scorecard in Excel is a ready-to-use monthly scorecard for generator servicing teams that want disciplined KPI review without a subscription platform. The supplied workbook starts with 10 generator service KPIs and has capacity for 20. It combines a ten-card scorecard, group-level KPI analysis, single-metric trend charts, typed monthly inputs, editable KPI definitions, and adjustable traffic-light thresholds. It is formula-driven and requires Excel 2016 or later; there are no macros, no Power Query, no add-ins, and no internet dependency.
This is an Excel KPI Scorecard, not the separate Excel KPI Dashboard product line. It does not store jobs, service tickets, assets, or technician records. Instead, it gives managers a clear place to review already-calculated MTD and YTD results against target, prior year, or prior month. That distinction keeps the workbook lightweight and makes it useful for monthly management meetings.
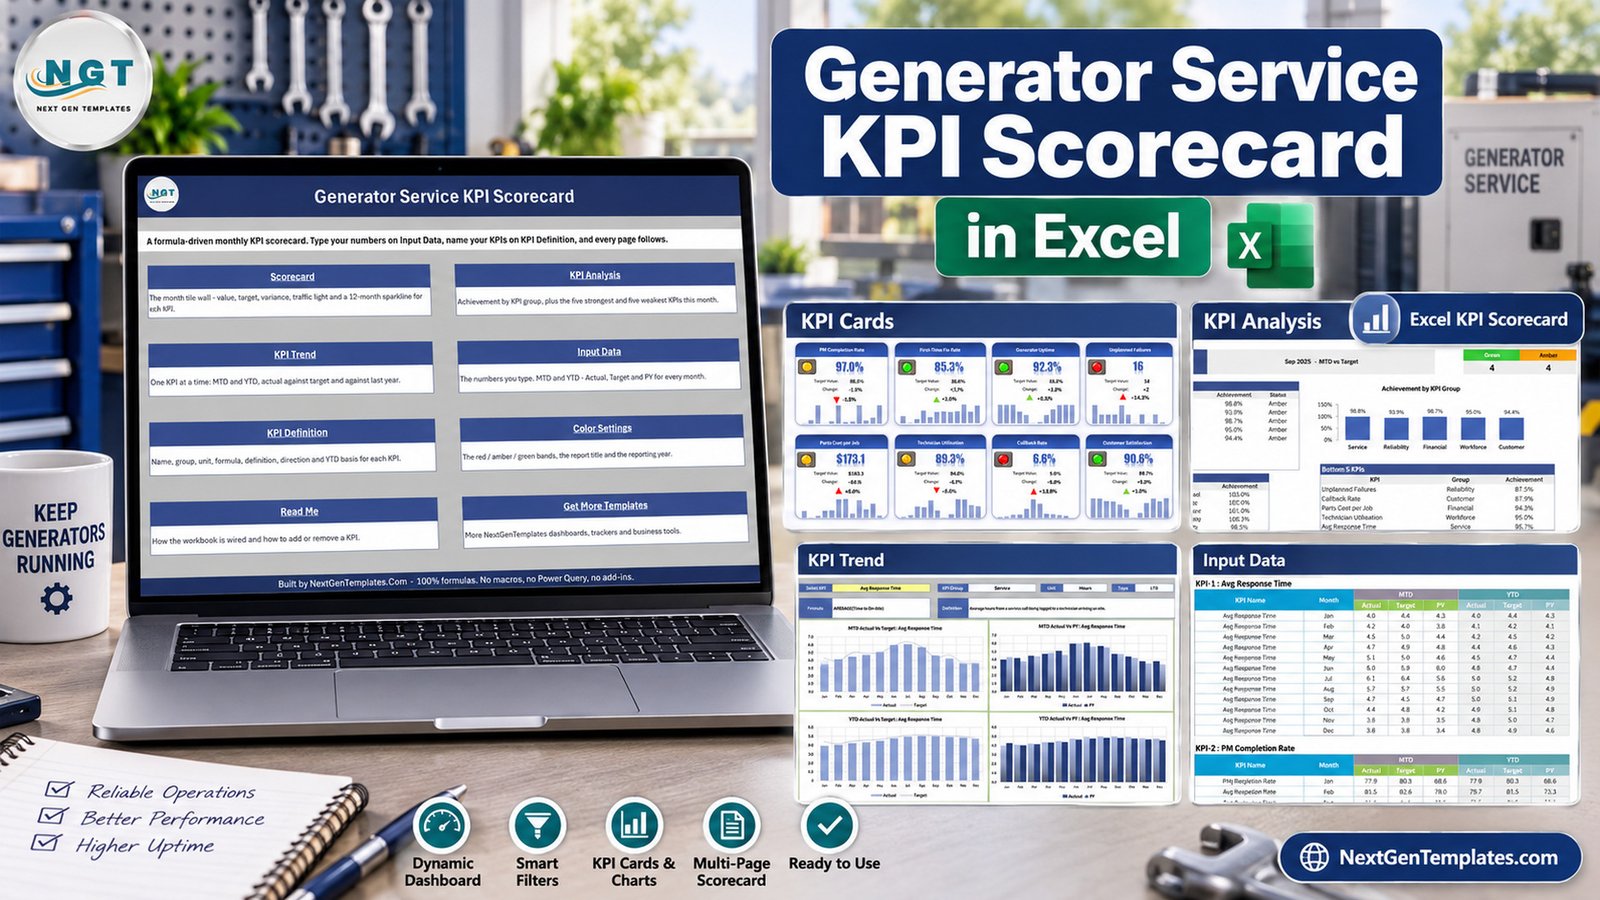
Key Features of Generator Service KPI Scorecard in Excel
The workbook includes 10 populated generator service KPIs: average response time, PM completion rate, first-time fix rate, generator uptime, unplanned failures, service revenue, parts cost per job, technician utilisation, callback rate, and customer satisfaction. These span service, reliability, financial, workforce, and customer groups.
- Month selector linked to the reporting year
- MTD and YTD switching for the entire scorecard
- Target, prior-year, or prior-month comparison
- UTB and LTB direction logic for each KPI
- Green, amber, and red traffic lights with editable bands
- Ten KPI cards at a time, with a selector for KPI 1-10 or KPI 11-20
- 12-month sparklines, achievement change, and direction-aware arrows
- Formula-driven outputs with no refresh button or macro security prompt
The Excel generator service scorecard is meant for teams that already calculate metrics in a work-order system, accounting file, or operating workbook. It becomes the presentation and review layer.
Workbook Pages Explanation
Home
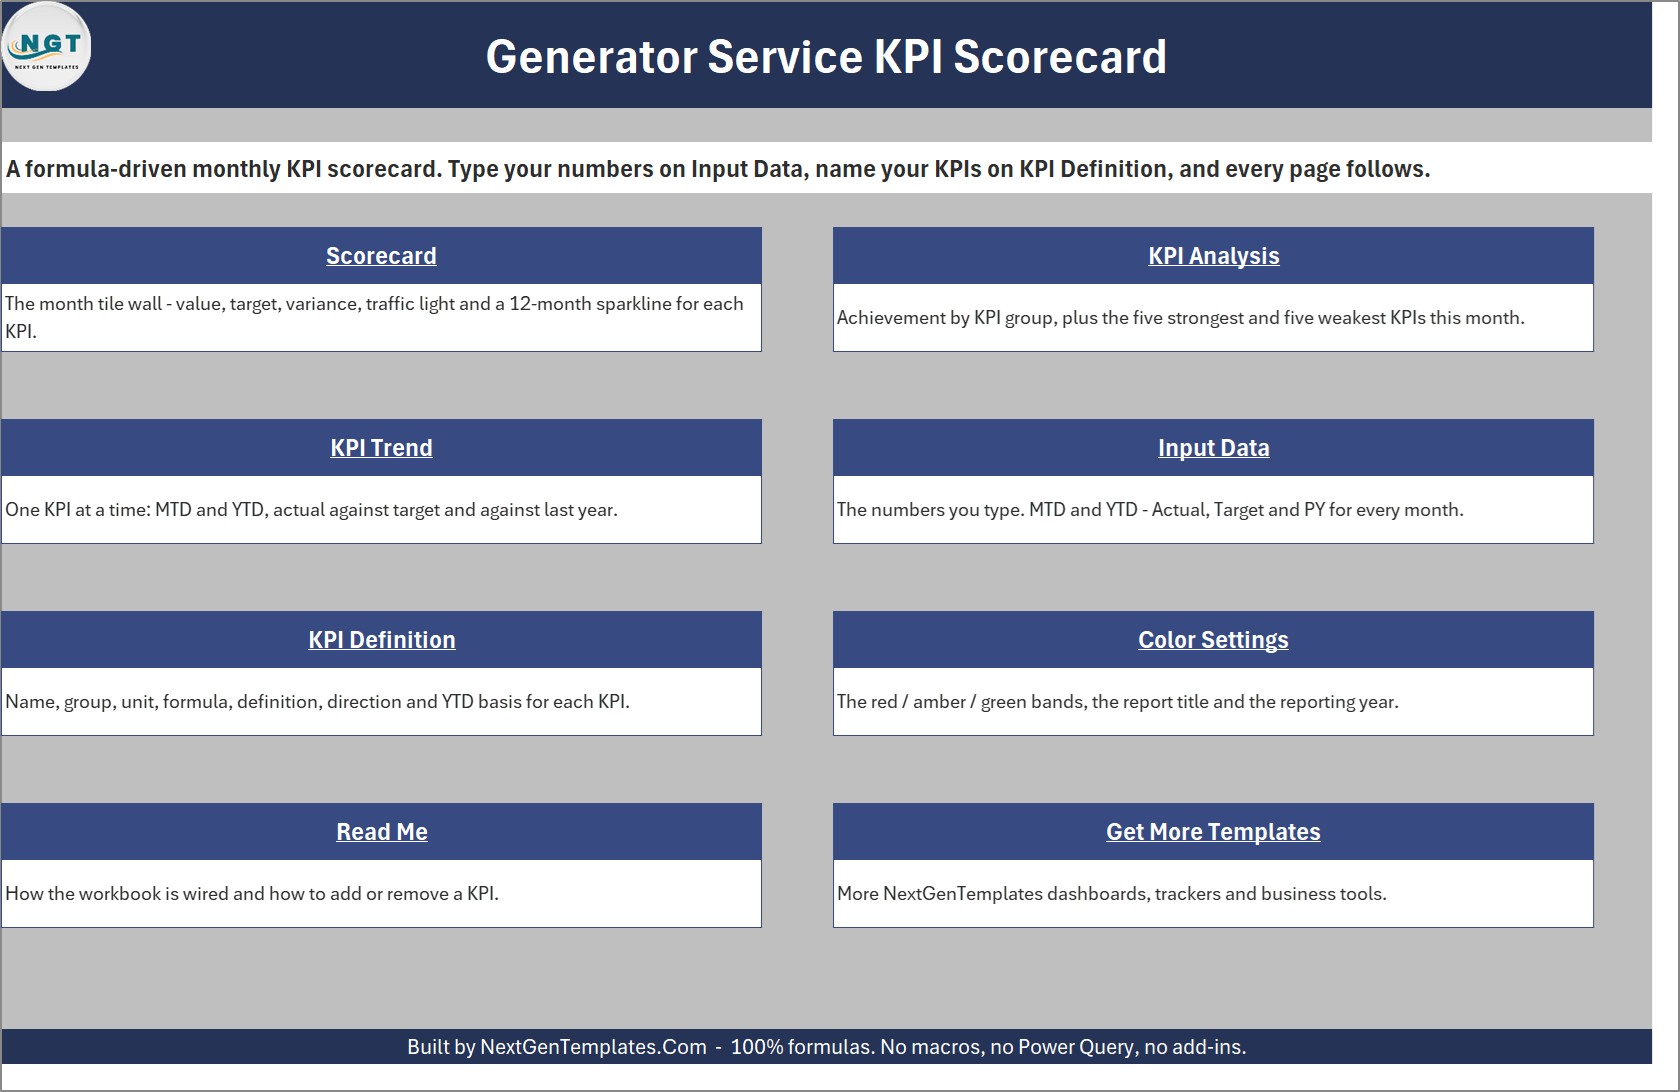
Home is a navigation page linking to Scorecard, KPI Analysis, KPI Trend, Input Data, KPI Definition, Color Settings, Read Me, and Get More Templates.
Scorecard
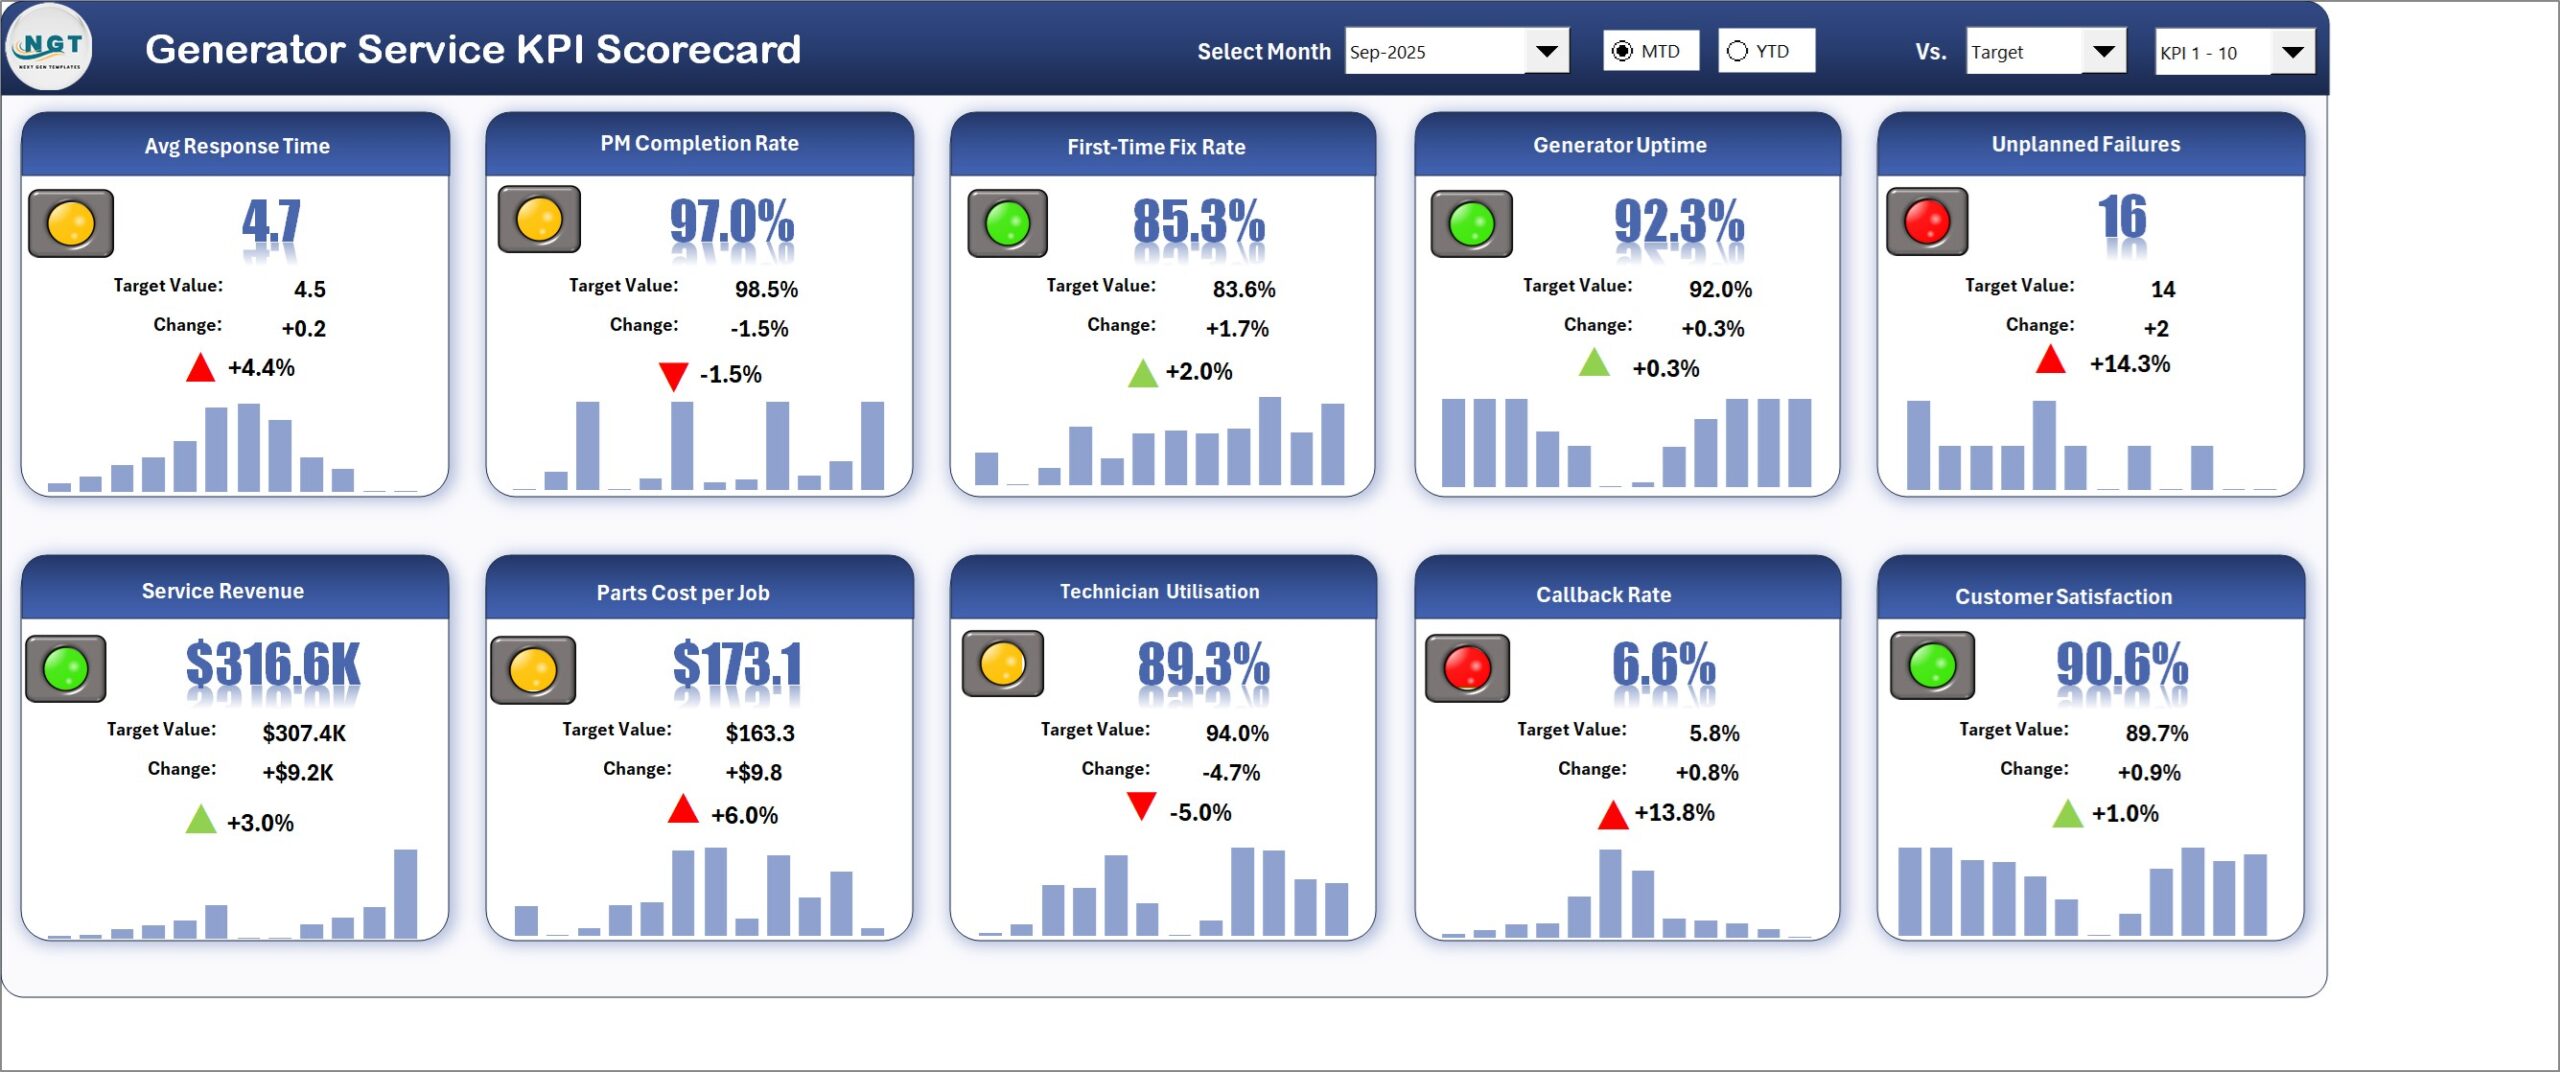
The main page displays ten KPI tiles. Each tile shows the selected actual value, comparison value, change in the KPI’s unit, percentage movement, a traffic light, and a 12-month sparkline. A blank or zero comparison returns n/a rather than inventing a percentage.
KPI Analysis
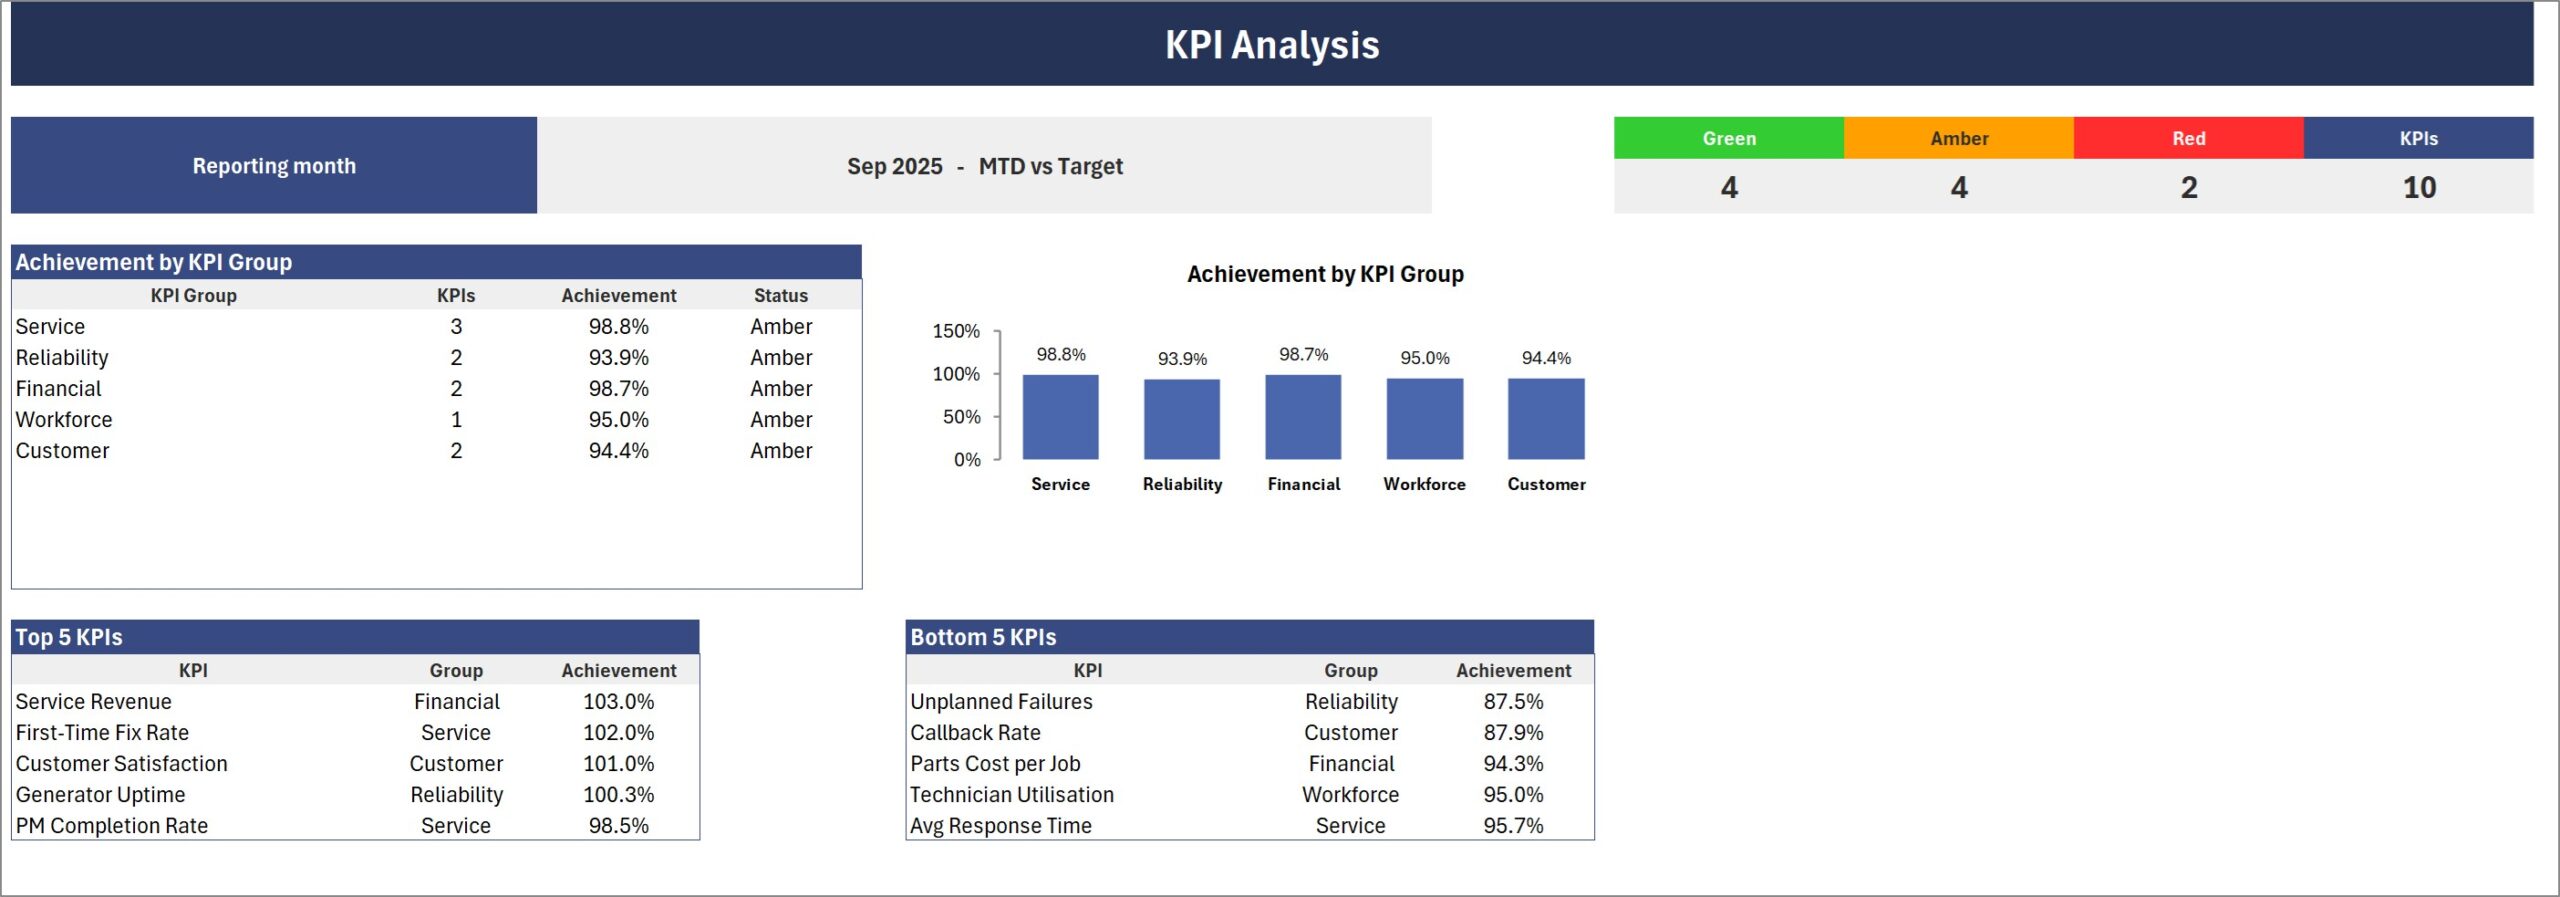
KPI Analysis answers how the selected month is performing overall. It counts green, amber, and red KPIs, calculates achievement by KPI group, and lists the top five and bottom five performers.
KPI Trend
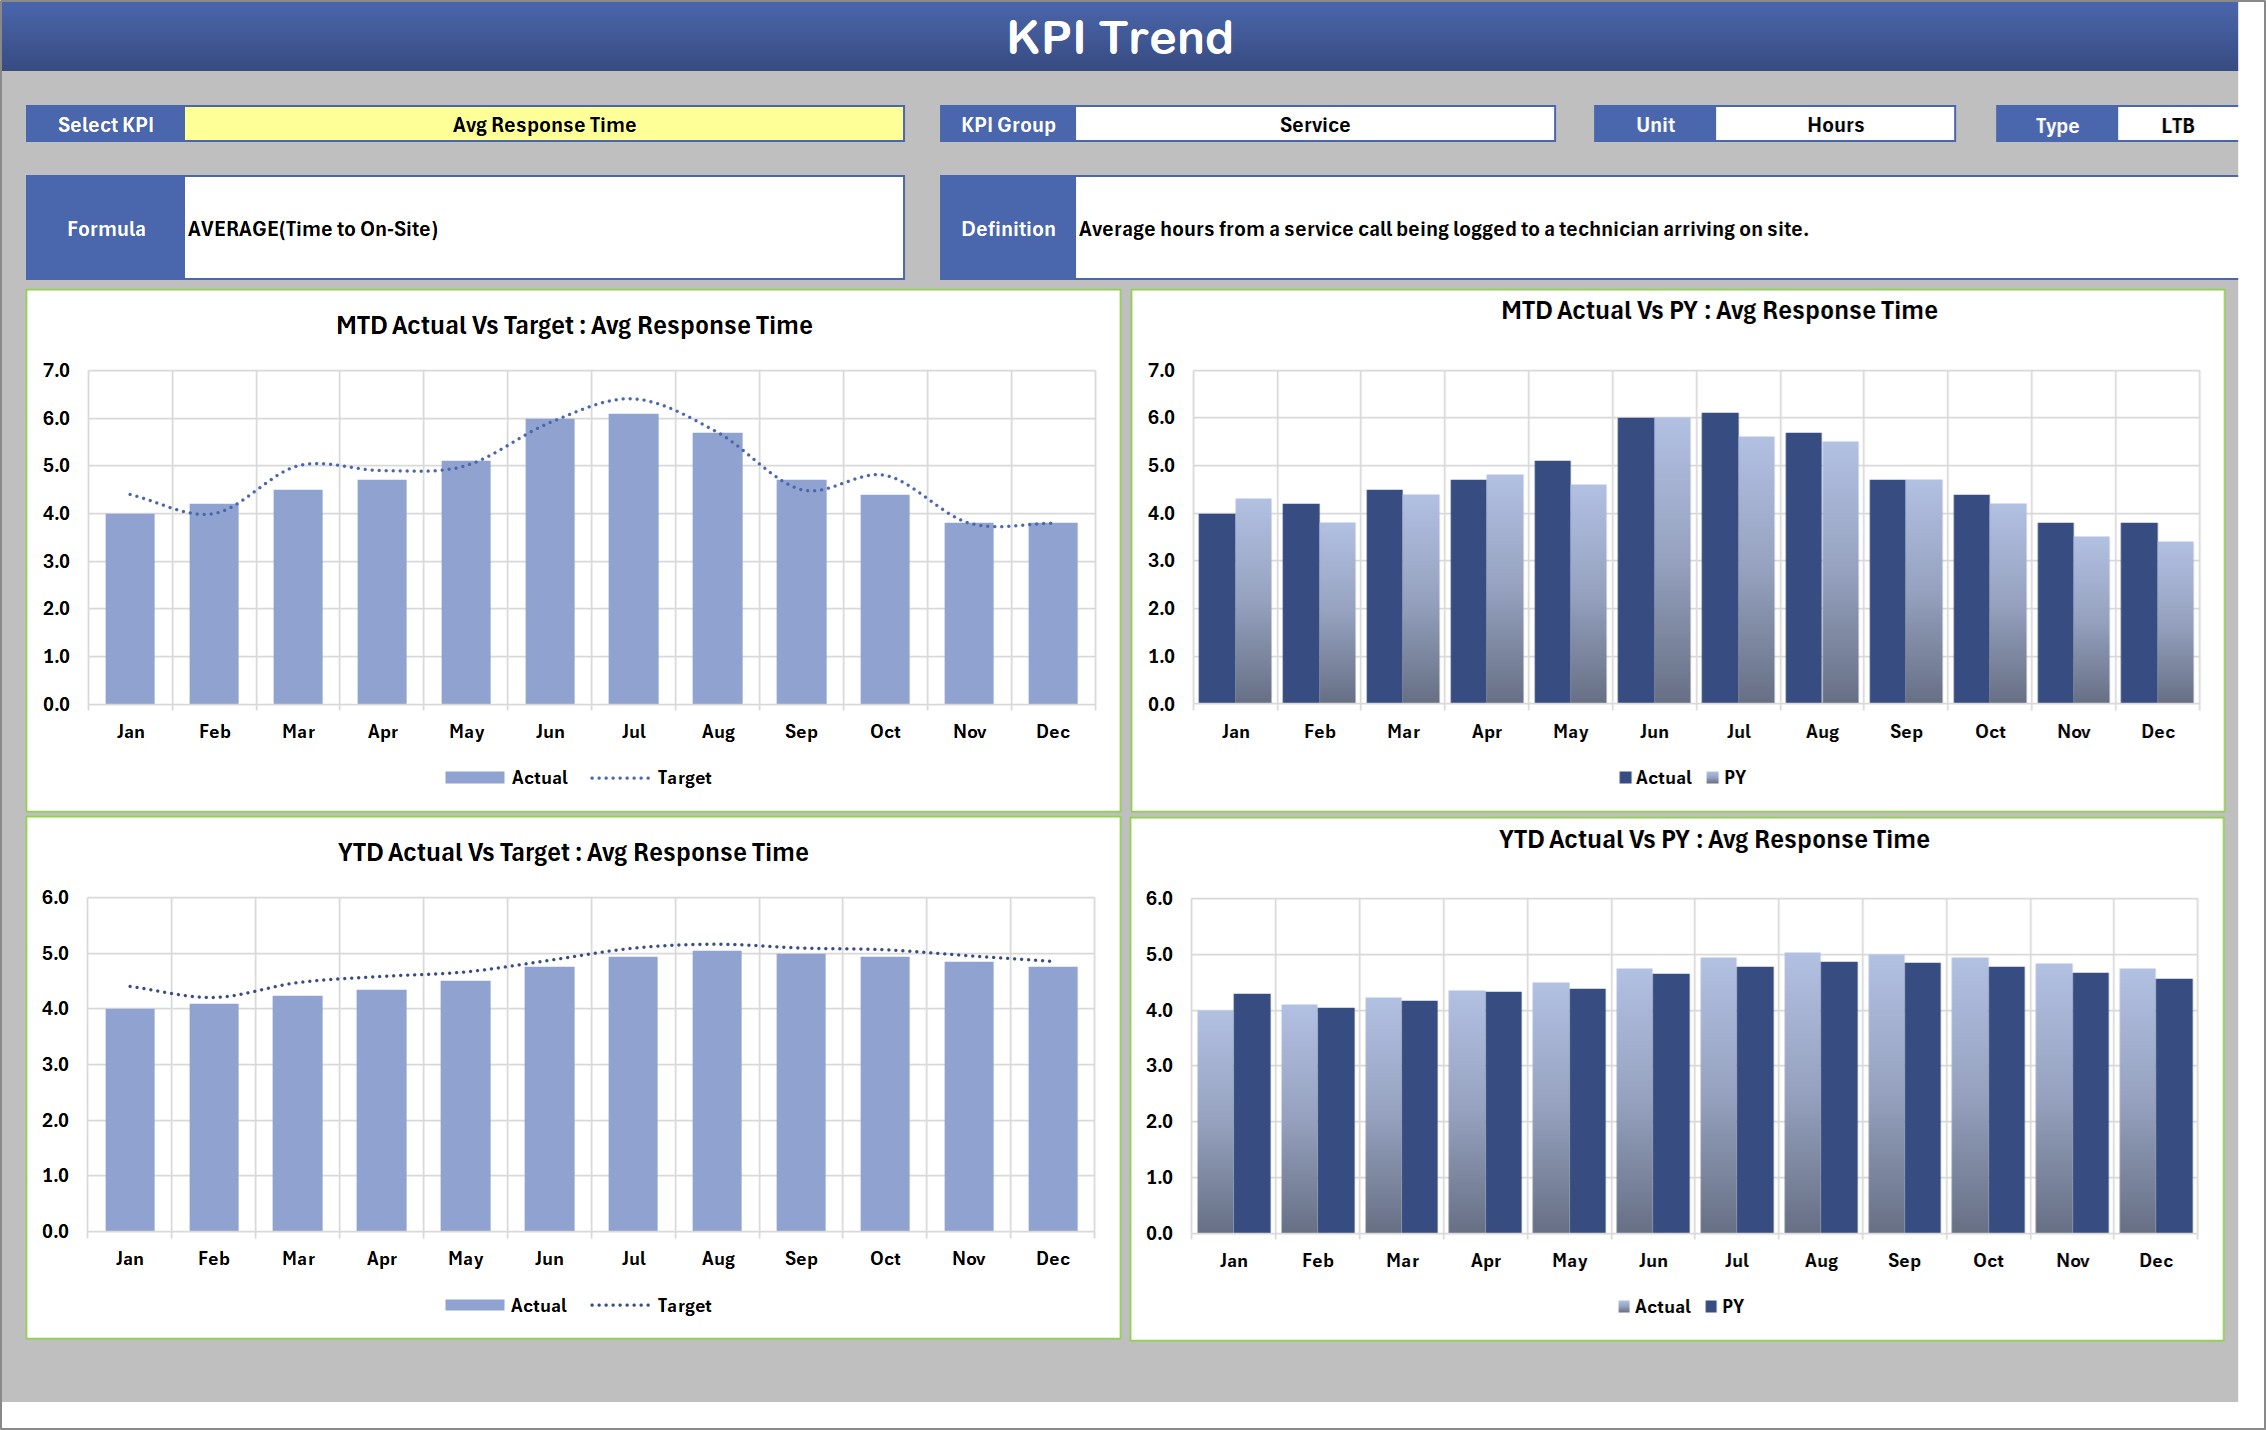
Select one KPI to view MTD Actual vs Target, MTD Actual vs PY, YTD Actual vs Target, and YTD Actual vs PY across 12 months. The page also shows the KPI group, unit, type, formula description, and definition.
Input Data and KPI Definition
Input Data holds one numbered 12-month block per KPI, with MTD and YTD Actual, Target, and PY values. KPI Definition is the single source for KPI number, group, name, unit, formula description, definition, direction, YTD basis, and duplicate-name check.
Color Settings and reference pages
Color Settings controls RAG bands, report title, and reporting year. Read Me explains the workbook rules. The supplied PDF manual provides a six-page setup guide. Hidden Support and Trend_Support sheets feed calculations and should not be edited.
Generator Service KPI Scorecard in Excel vs. Google Sheets vs. Paid Field Service Software – Feature Comparison
| Feature | Excel scorecard | Google Sheets alternative | Paid field service software |
|---|---|---|---|
| Commercial model | One-time template | Template or self-build | Recurring subscription |
| Offline use | Yes | Limited | Usually cloud-first |
| Simultaneous collaboration | Depends on your file setup | Native | Usually included |
| Custom KPI definitions | Editable | Editable if designed | Vendor-dependent |
| UTB/LTB scoring | Included | Requires suitable formulas | Vendor-dependent |
| Job and asset records | Not included | Requires a separate data design | Often included |
| Monthly KPI review | Purpose-built | Depends on template | Usually part of a wider suite |
Who Should Use This Template
Generator maintenance companies, field service contractors, workshop managers, service coordinators, operations leaders, and business owners can use this generator maintenance KPI template to run a regular performance review. It works best when your team has reliable monthly figures and wants a standard way to discuss operational, reliability, financial, workforce, and customer measures.
Do not use it as a CMMS, dispatch system, job tracker, inventory register, or automated data warehouse. It is a service operations KPI scorecard for finished monthly results.
Real-World Use Cases
Service manager review
Review average response time, first-time fix rate, PM completion, and callback rate before discussing individual causes in the source system.
Reliability meeting
Put generator uptime and unplanned failures together while applying the correct direction: uptime is upper-the-better, while failures are lower-the-better.
Owner’s monthly pack
Combine service revenue, parts cost per job, and technician utilisation with customer satisfaction to avoid reviewing financial results in isolation.
Advantages of Generator Service KPI Scorecard in Excel
The template separates definitions from inputs and outputs. KPI names and rules live in one place, monthly figures in another, and visual outputs update by formula. The group analysis helps users see whether a weak month is concentrated in service, reliability, cost, workforce, or customer performance. The comparison selector also lets one workbook support monthly, quarterly, and year-on-year conversations.
Because it is a monthly KPI scorecard in Excel, users retain control of the file and can adapt labels, units, thresholds, report title, and reporting year without a vendor configuration project.
The supplied KPI mix also avoids treating maintenance performance as a single uptime number. Response speed, planned-maintenance completion, first-time fix performance, failures, callbacks, parts cost, labour utilisation, revenue, and customer satisfaction sit together, while the KPI Group field keeps each measure in context. A manager can therefore see whether a weak result is isolated or part of a wider service pattern. The top-five and bottom-five lists make the first discussion point obvious, and the trend page provides the monthly history needed to distinguish a one-off movement from a repeated issue. The workbook remains a management aid: targets, definitions, calculations, and follow-up actions still belong to the operating team.
Opportunities for Improvement
The workbook intentionally does not calculate KPI values from raw records. Your team must calculate each result correctly in its source file and enter the final figures. YTD logic also remains the user’s responsibility because a revenue total, satisfaction percentage, and closing asset count should not be rolled up the same way. For automated refreshes, live integrations, technician mobile workflows, or work-order history, use a dedicated source system and keep this scorecard as the review layer.
Best Practices
- Keep KPI names unique; duplicate names are flagged on KPI Definition.
- Use the next sequential KPI number and matching Input Data block when adding a metric.
- Enter Actual, Target, and PY together so comparisons remain complete.
- Record whether YTD uses sum, average, latest value, or another method.
- Set UTB for metrics where higher is good and LTB where lower is good.
- Keep Excel calculation set to Automatic. Microsoft explains formula recalculation in its Excel calculation settings guidance.
- Keep the ten most decision-relevant KPIs in the first scorecard set.
Explore Relevant Templates
For another field-service scorecard structure, see the Garage Door Service KPI Scorecard in Excel. Maintenance teams can also review the Elevator Maintenance KPI Scorecard in Excel. For a related service example, explore the Septic Tank Service KPI Scorecard in Excel. These are published posts on the same site and show how the scorecard format can be adapted to other service operations.
Frequently Asked Questions
Is this the same as a KPI Dashboard?
No. This is the Excel KPI Scorecard line: a concise monthly tile wall with analysis and trends. The KPI Dashboard line is a different product family.
How many KPIs are included?
Ten generator service KPIs are populated, and the workbook has capacity for 20.
Does the workbook calculate YTD automatically?
No. Users enter finished YTD values because different KPIs require different roll-up methods.
Can I change traffic-light thresholds?
Yes. Color Settings contains separate bands for upper-the-better and lower-the-better KPIs.
Are macros required?
No. The workbook uses formulas, conditional formatting, camera pictures, and sparklines.
What is in the download?
The ZIP contains the Excel workbook and the Excel KPI Scorecard user manual PDF.
About the Author
Built by PK – Microsoft Certified Professional with 15+ years of Excel, Google Sheets, and Power BI experience. Founder of NextGenTemplates, reaching 300K+ subscribers across YouTube channels. Every template is hand-built and tested before release.
Conclusion
The Generator Service KPI Scorecard in Excel provides a practical monthly review layer for service, reliability, financial, workforce, and customer KPIs. It is most useful when your source systems already produce dependable figures and your management team needs consistent definitions, comparisons, traffic lights, analysis, and trends.
Download the Generator Service KPI Scorecard in Excel from NextGenTemplates.
For more Excel tutorials and template walkthroughs, visit PK: An Excel Expert on YouTube.