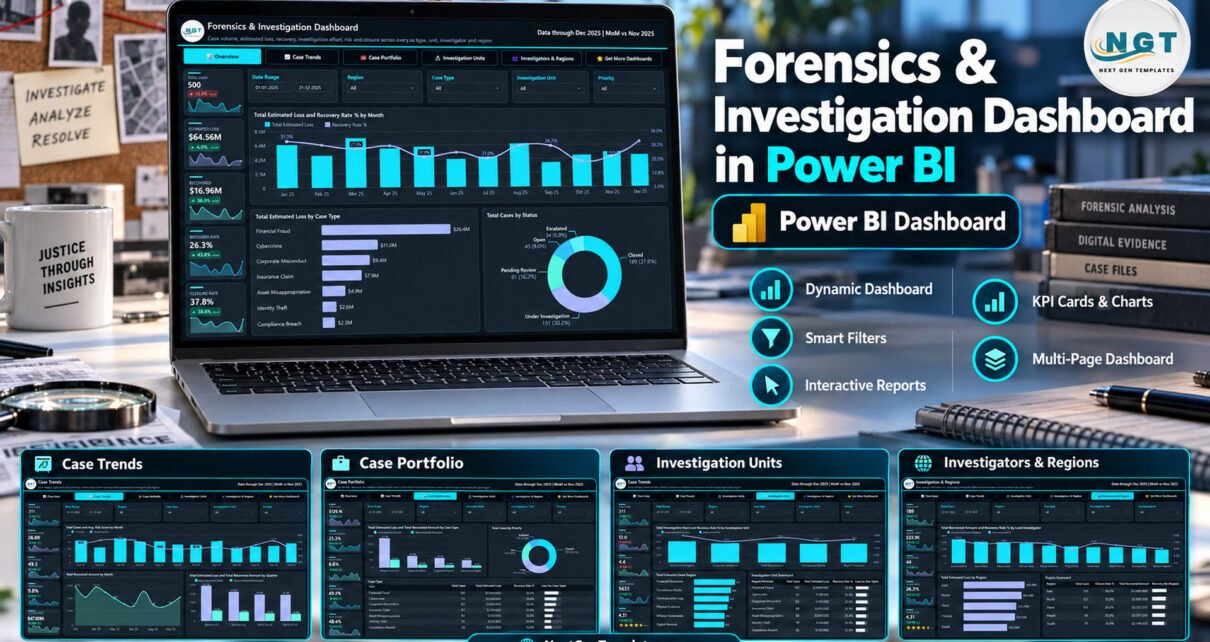
The Forensics and Investigation Dashboard in Power BI is a five-page .pbix report built over a sample book of 500 cases spanning January to December 2025. It carries 25 KPI cards, 12 charts and 3 scorecard tables, and every page repeats the same five-slicer panel, so one filter click re-cuts all 15 visuals on that page at once. Forensics & Investigation Dashboard in Power BI
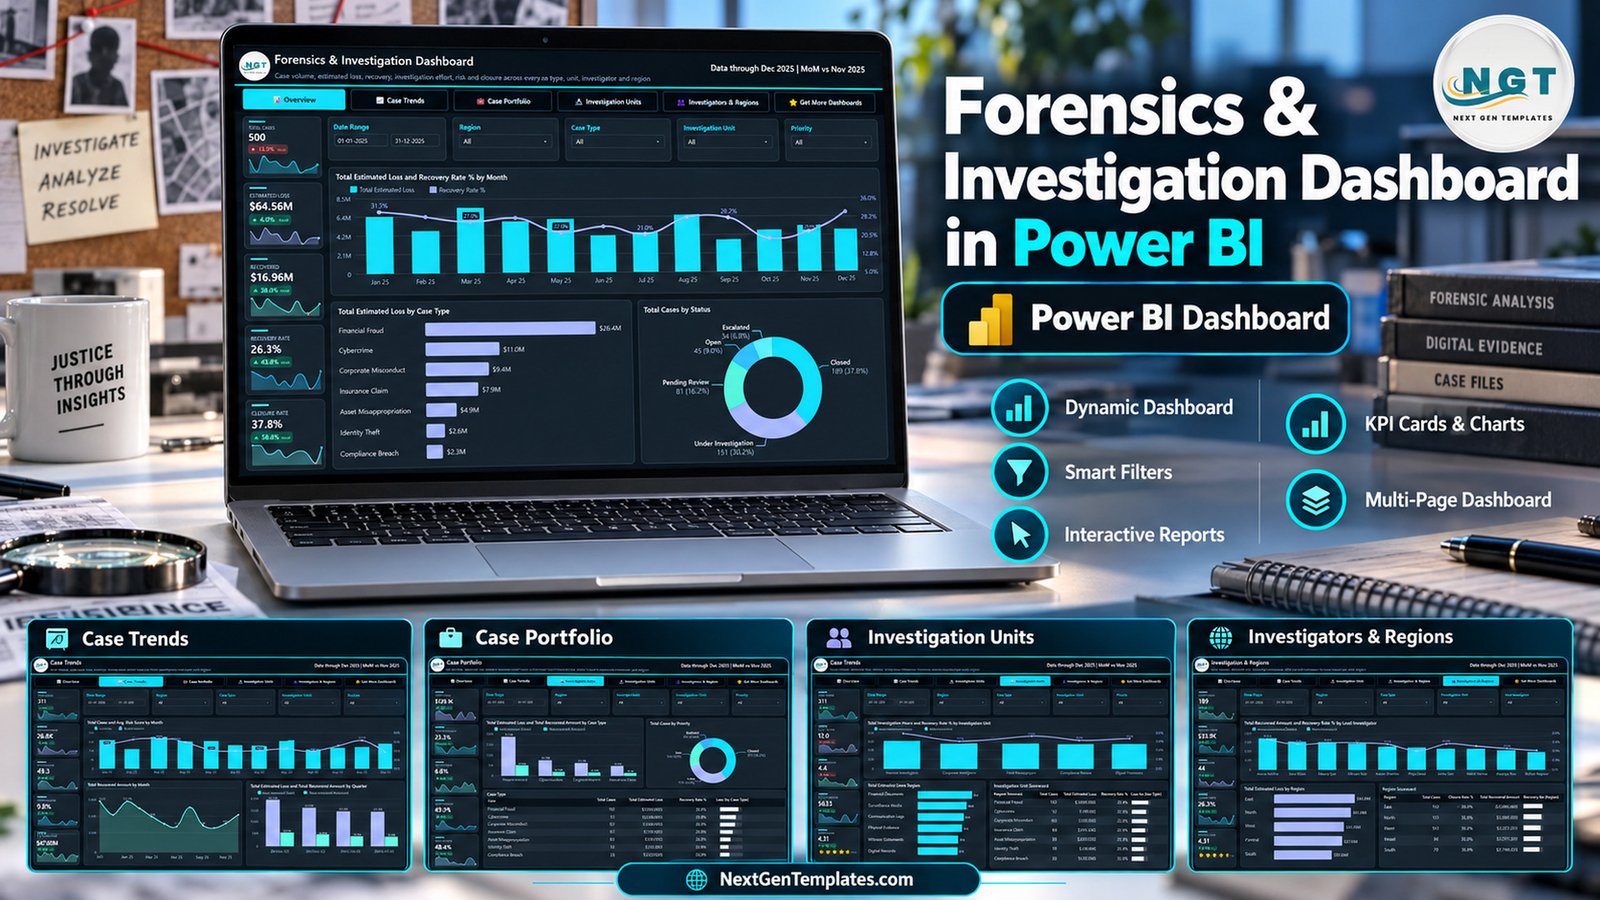
Most investigation teams already have their case records somewhere — a claims platform, a ticketing tool, an audit spreadsheet. What they usually do not have is a reporting layer that answers the awkward questions: where is the loss concentrated, is recovery keeping pace with it, which unit is spending the most hours for the least return, and are cases actually closing. That reporting gap is the only thing this template sets out to fill. Forensics & Investigation Dashboard in Power BI
Before anything else, the scope. This is an analytics file loaded with fictional sample data. It is not evidence-management software: there is no case intake, no evidence storage, no chain of custody, no user permissions and no audit trail, and it does not connect to any case-management system. Nothing it produces is designed or certified for legal or evidentiary use, and real case files or personal data should not be loaded into it.
Key Features of the Forensics and Investigation Dashboard in Power BI
- 25 KPI cards, five per page. Each card carries its own sparkline and a month-on-month change arrow, so a number is never shown without its direction of travel.
- A consistent five-slicer panel. Date Range, Region, Case Type and Investigation Unit appear on all five pages; the fifth slot swaps to Priority, Status, Evidence Type or Lead Investigator depending on what that page analyses.
- Loss and recovery always shown as a pair. The sample book runs $64.56M of estimated loss against $16.96M recovered — a 26.3% recovery rate, leaving $47.60M unrecovered — and that pairing repeats by month, quarter, case type, unit, investigator and region.
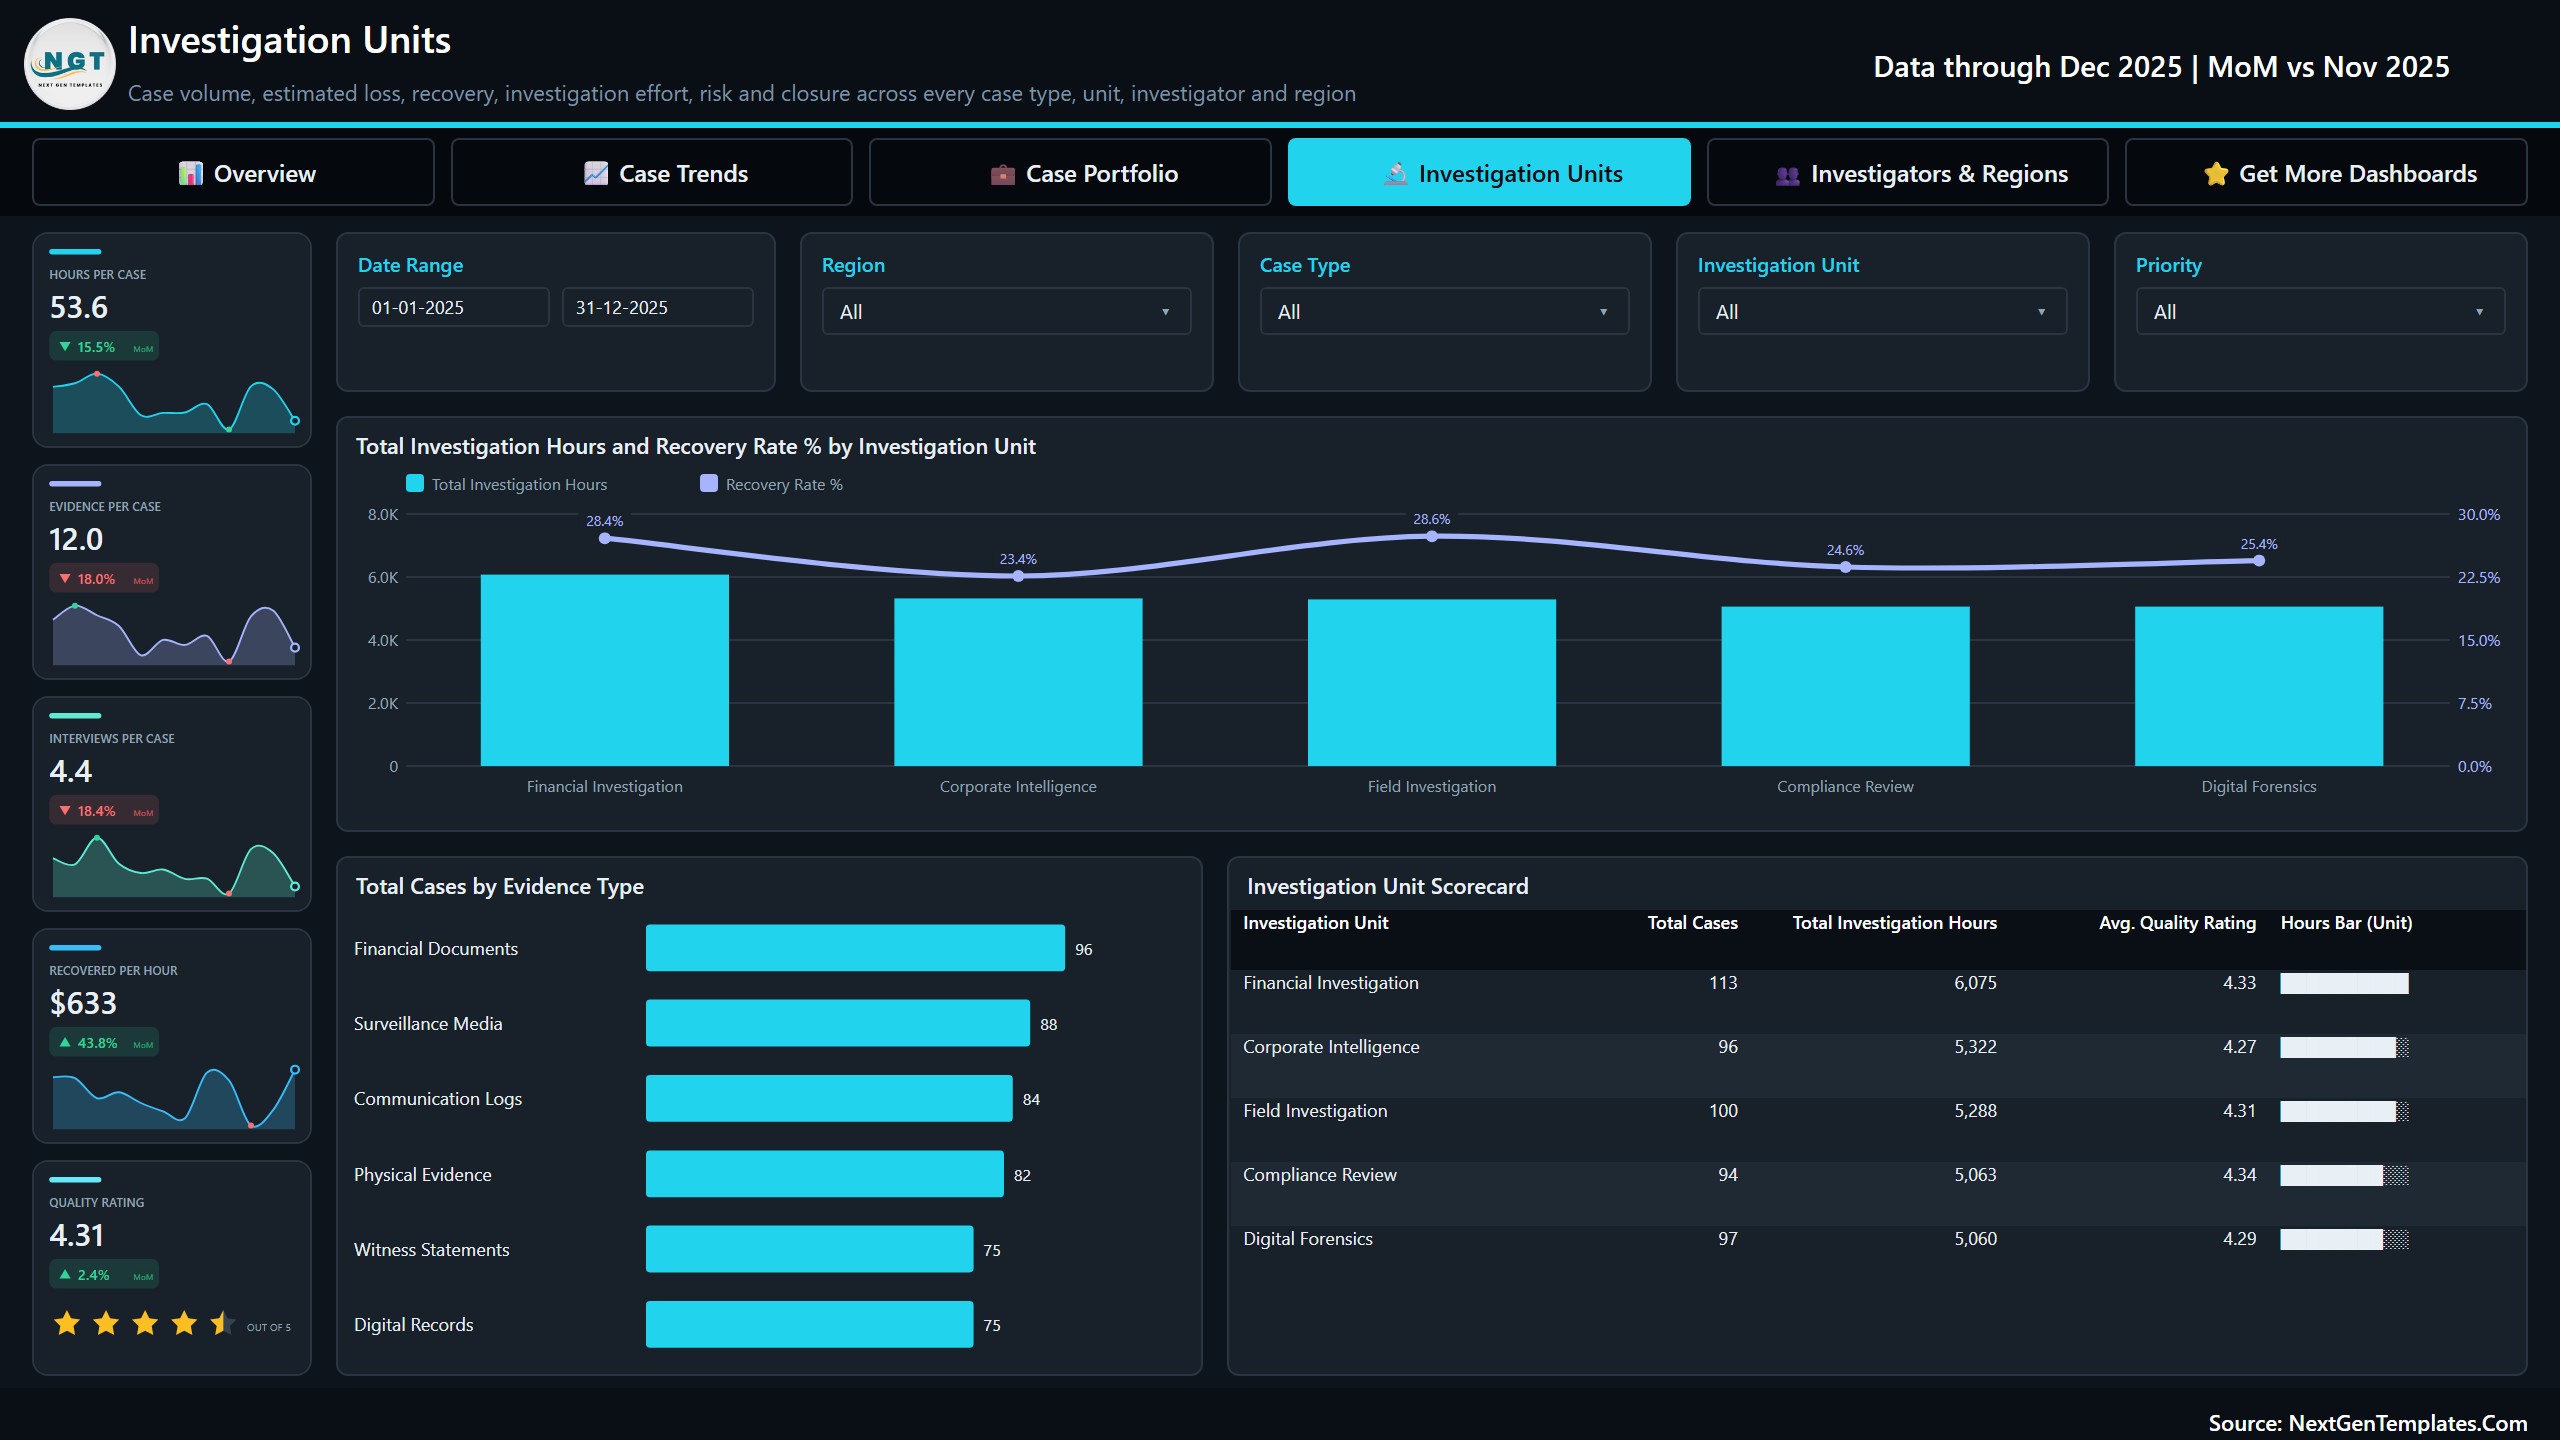
- Effort measured alongside outcome. Hours Per Case 53.6, Evidence Per Case 12.0, Interviews Per Case 4.4 and Recovered Per Hour $633 sit on the same page as the quality rating, which is the combination that makes a workload conversation possible.
- Three scorecard tables. Case Type, Investigation Unit and Region each get a sortable table with an inline bar, so the ranking is readable without opening a chart.
- Editable end to end. The download holds the .pbix report and the Data.xlsx source workbook, so measures, dimensions, colours and pages are all yours to change in Power BI Desktop. Forensics & Investigation Dashboard in Power BI
Dashboard Pages Explanation
Page 1: Overview
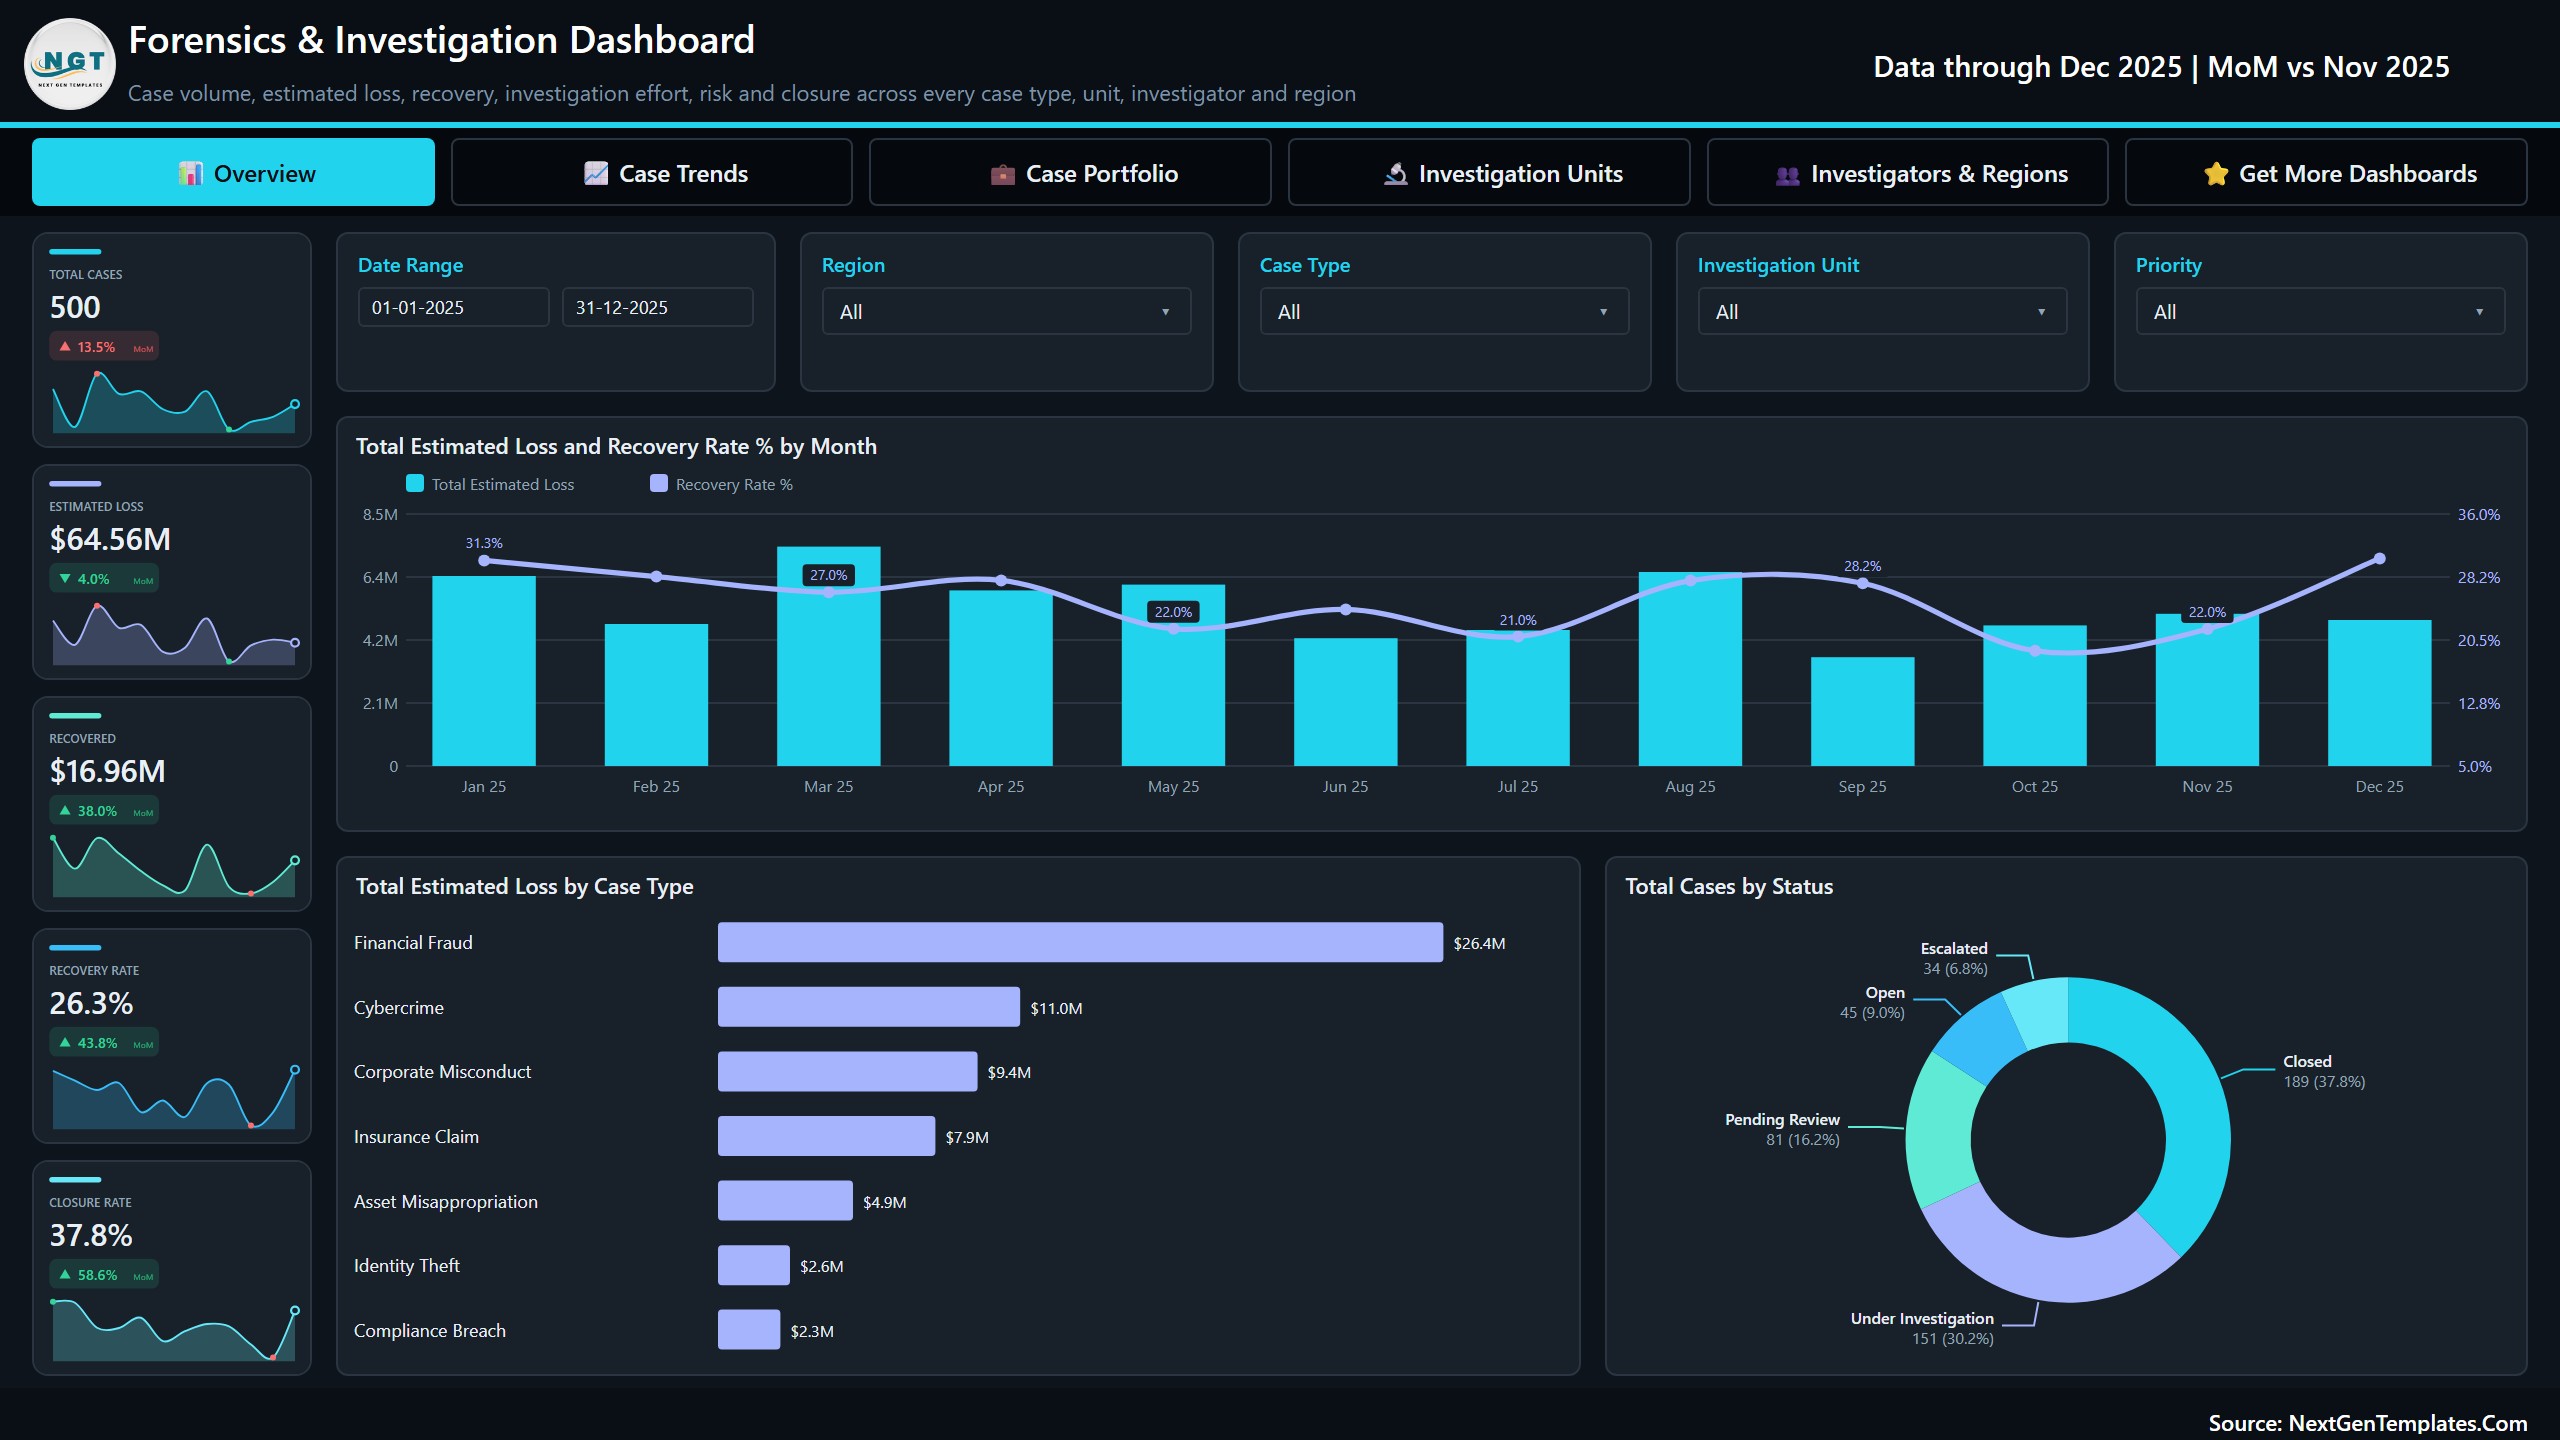
The landing page reports Total Cases 500, Estimated Loss $64.56M, Recovered $16.96M, Recovery Rate 26.3% and Closure Rate 37.8%. Its three visuals are Total Estimated Loss and Recovery Rate % by Month, Total Estimated Loss by Case Type — Financial Fraud $26.4M through to Compliance Breach $2.3M — and Total Cases by Status, where 189 cases are closed (37.8%) against 151 still under investigation.
Page 2: Case Trends
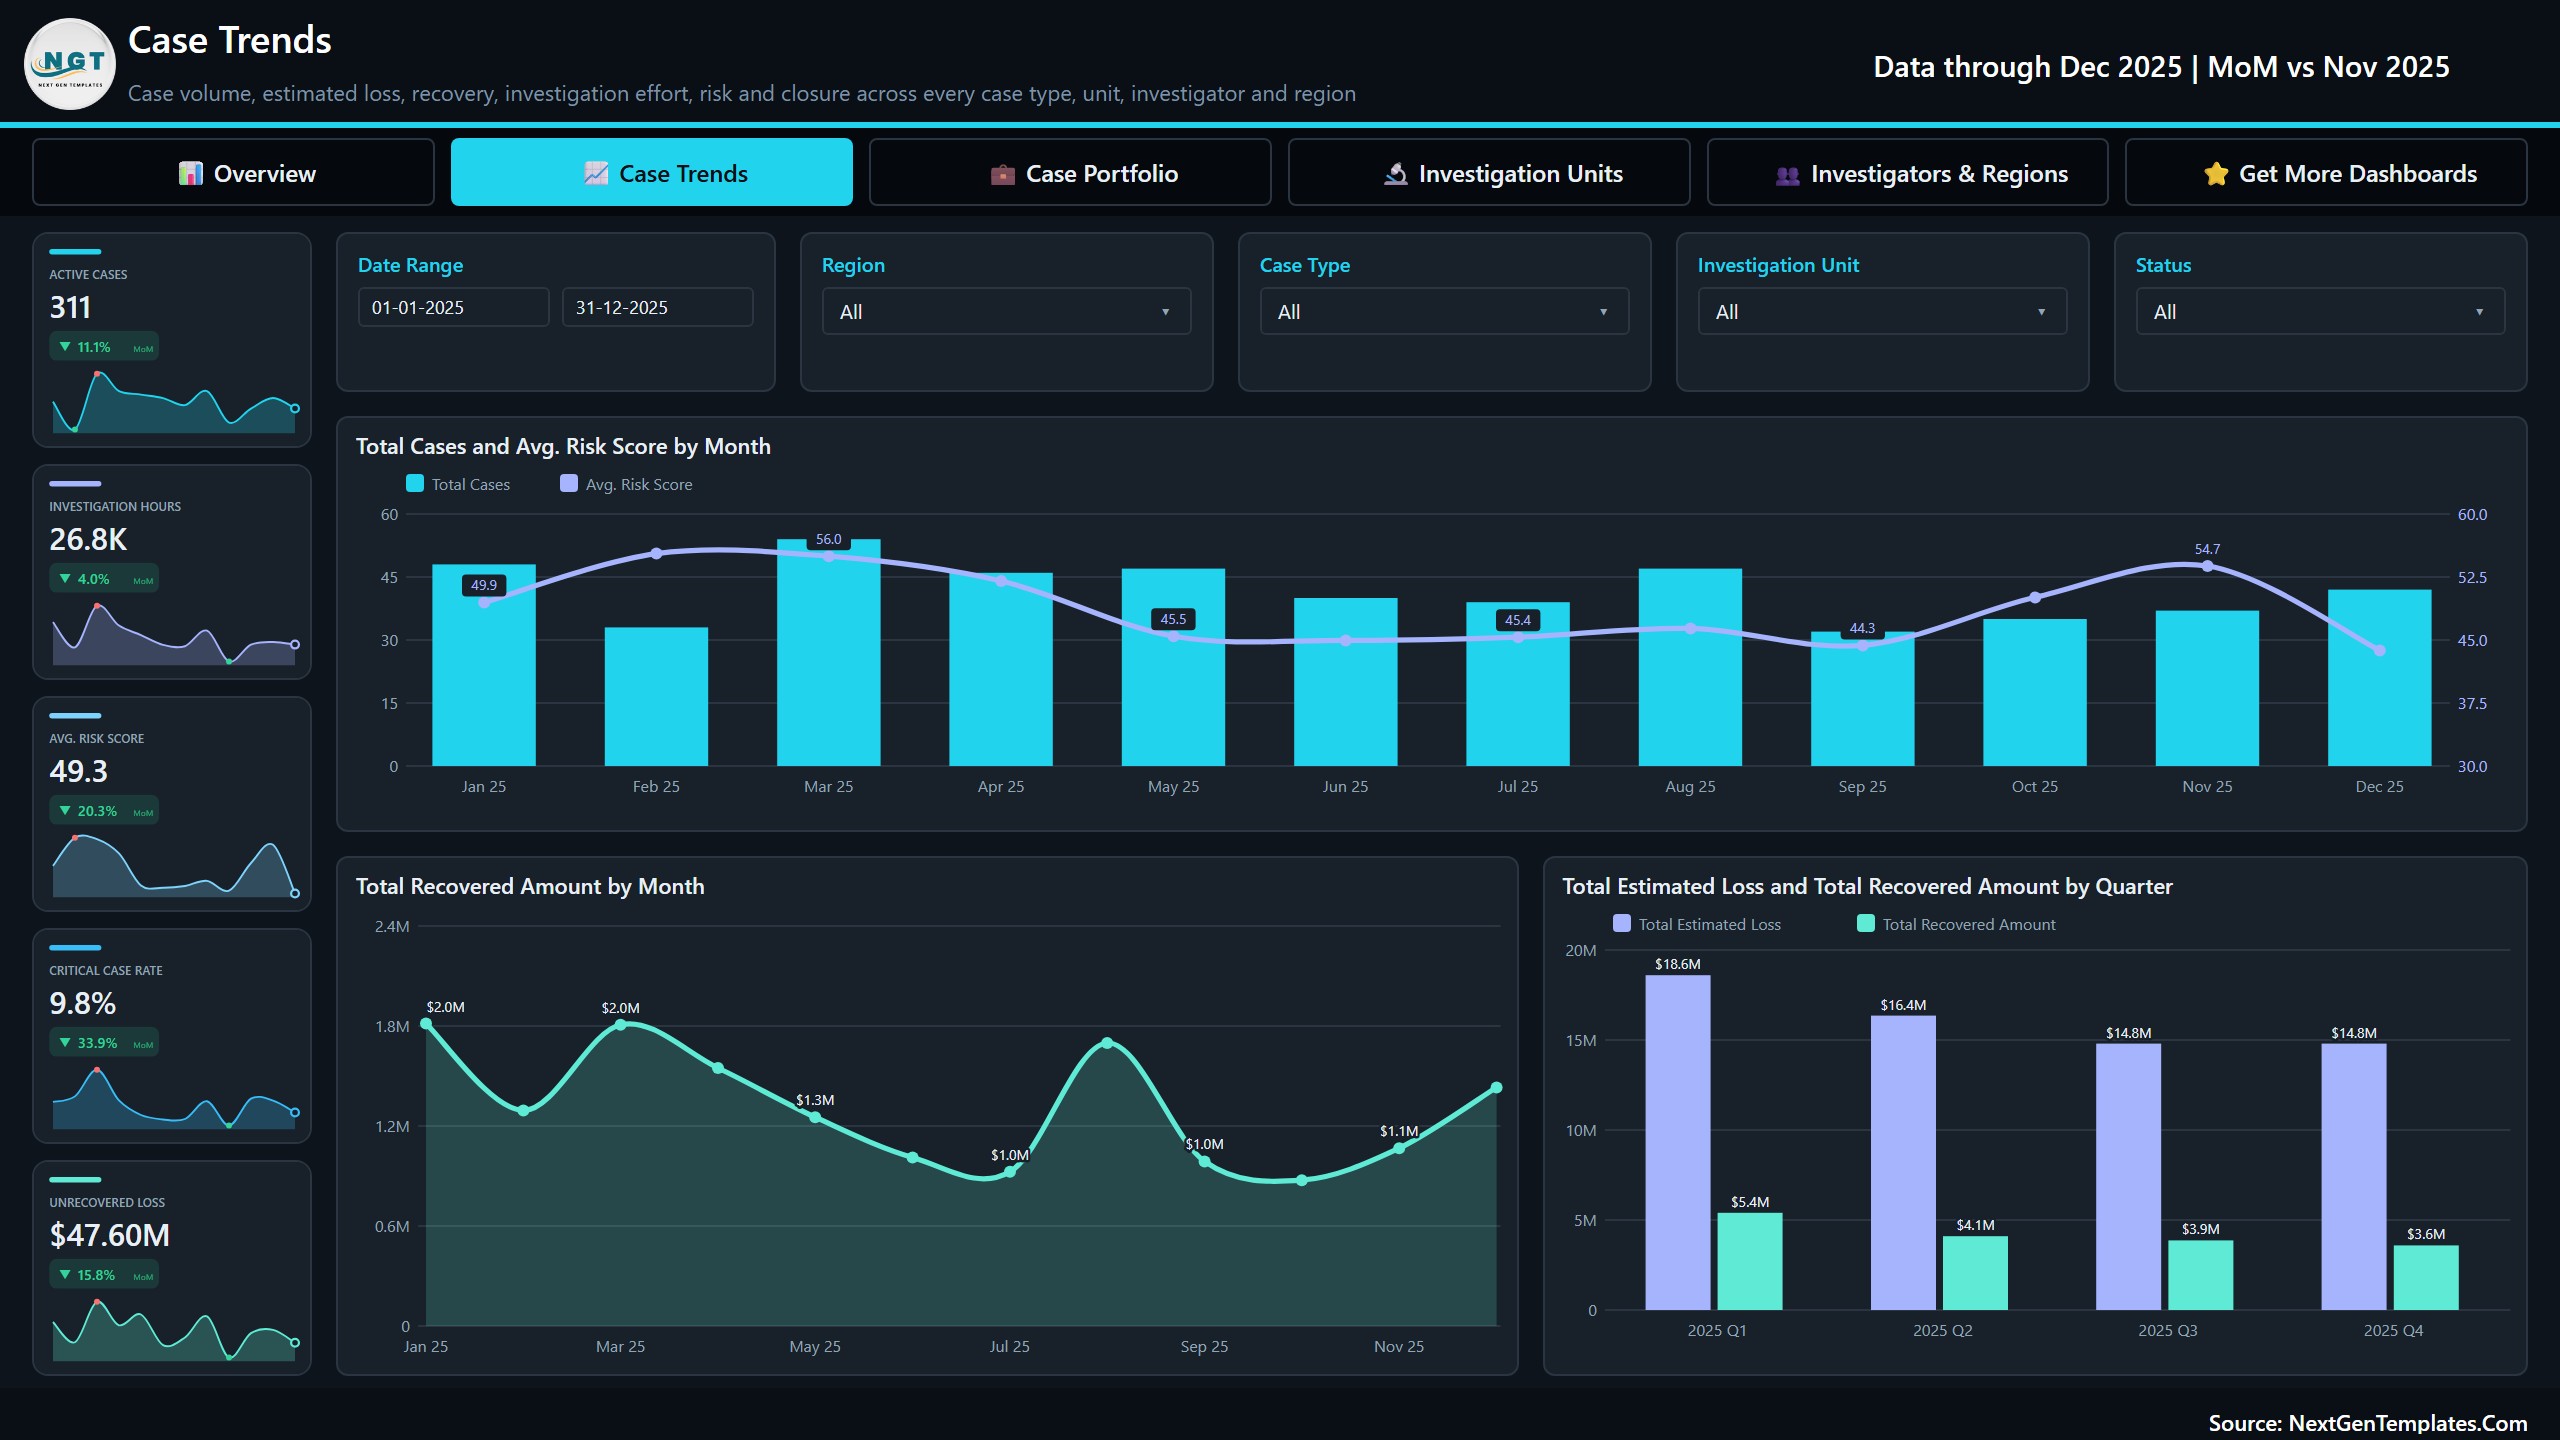
The time-series page, reporting Active Cases 311, Investigation Hours 26.8K, Avg. Risk Score 49.3, Critical Case Rate 9.8% and Unrecovered Loss $47.60M. Total Cases and Avg. Risk Score by Month puts volume and severity on one axis pair, Total Recovered Amount by Month tracks the cash coming back, and Total Estimated Loss and Total Recovered Amount by Quarter shows recovery falling from $5.4M in Q1 to $3.6M in Q4 while loss also declines. Forensics & Investigation Dashboard in Power BI
Page 3: Case Portfolio
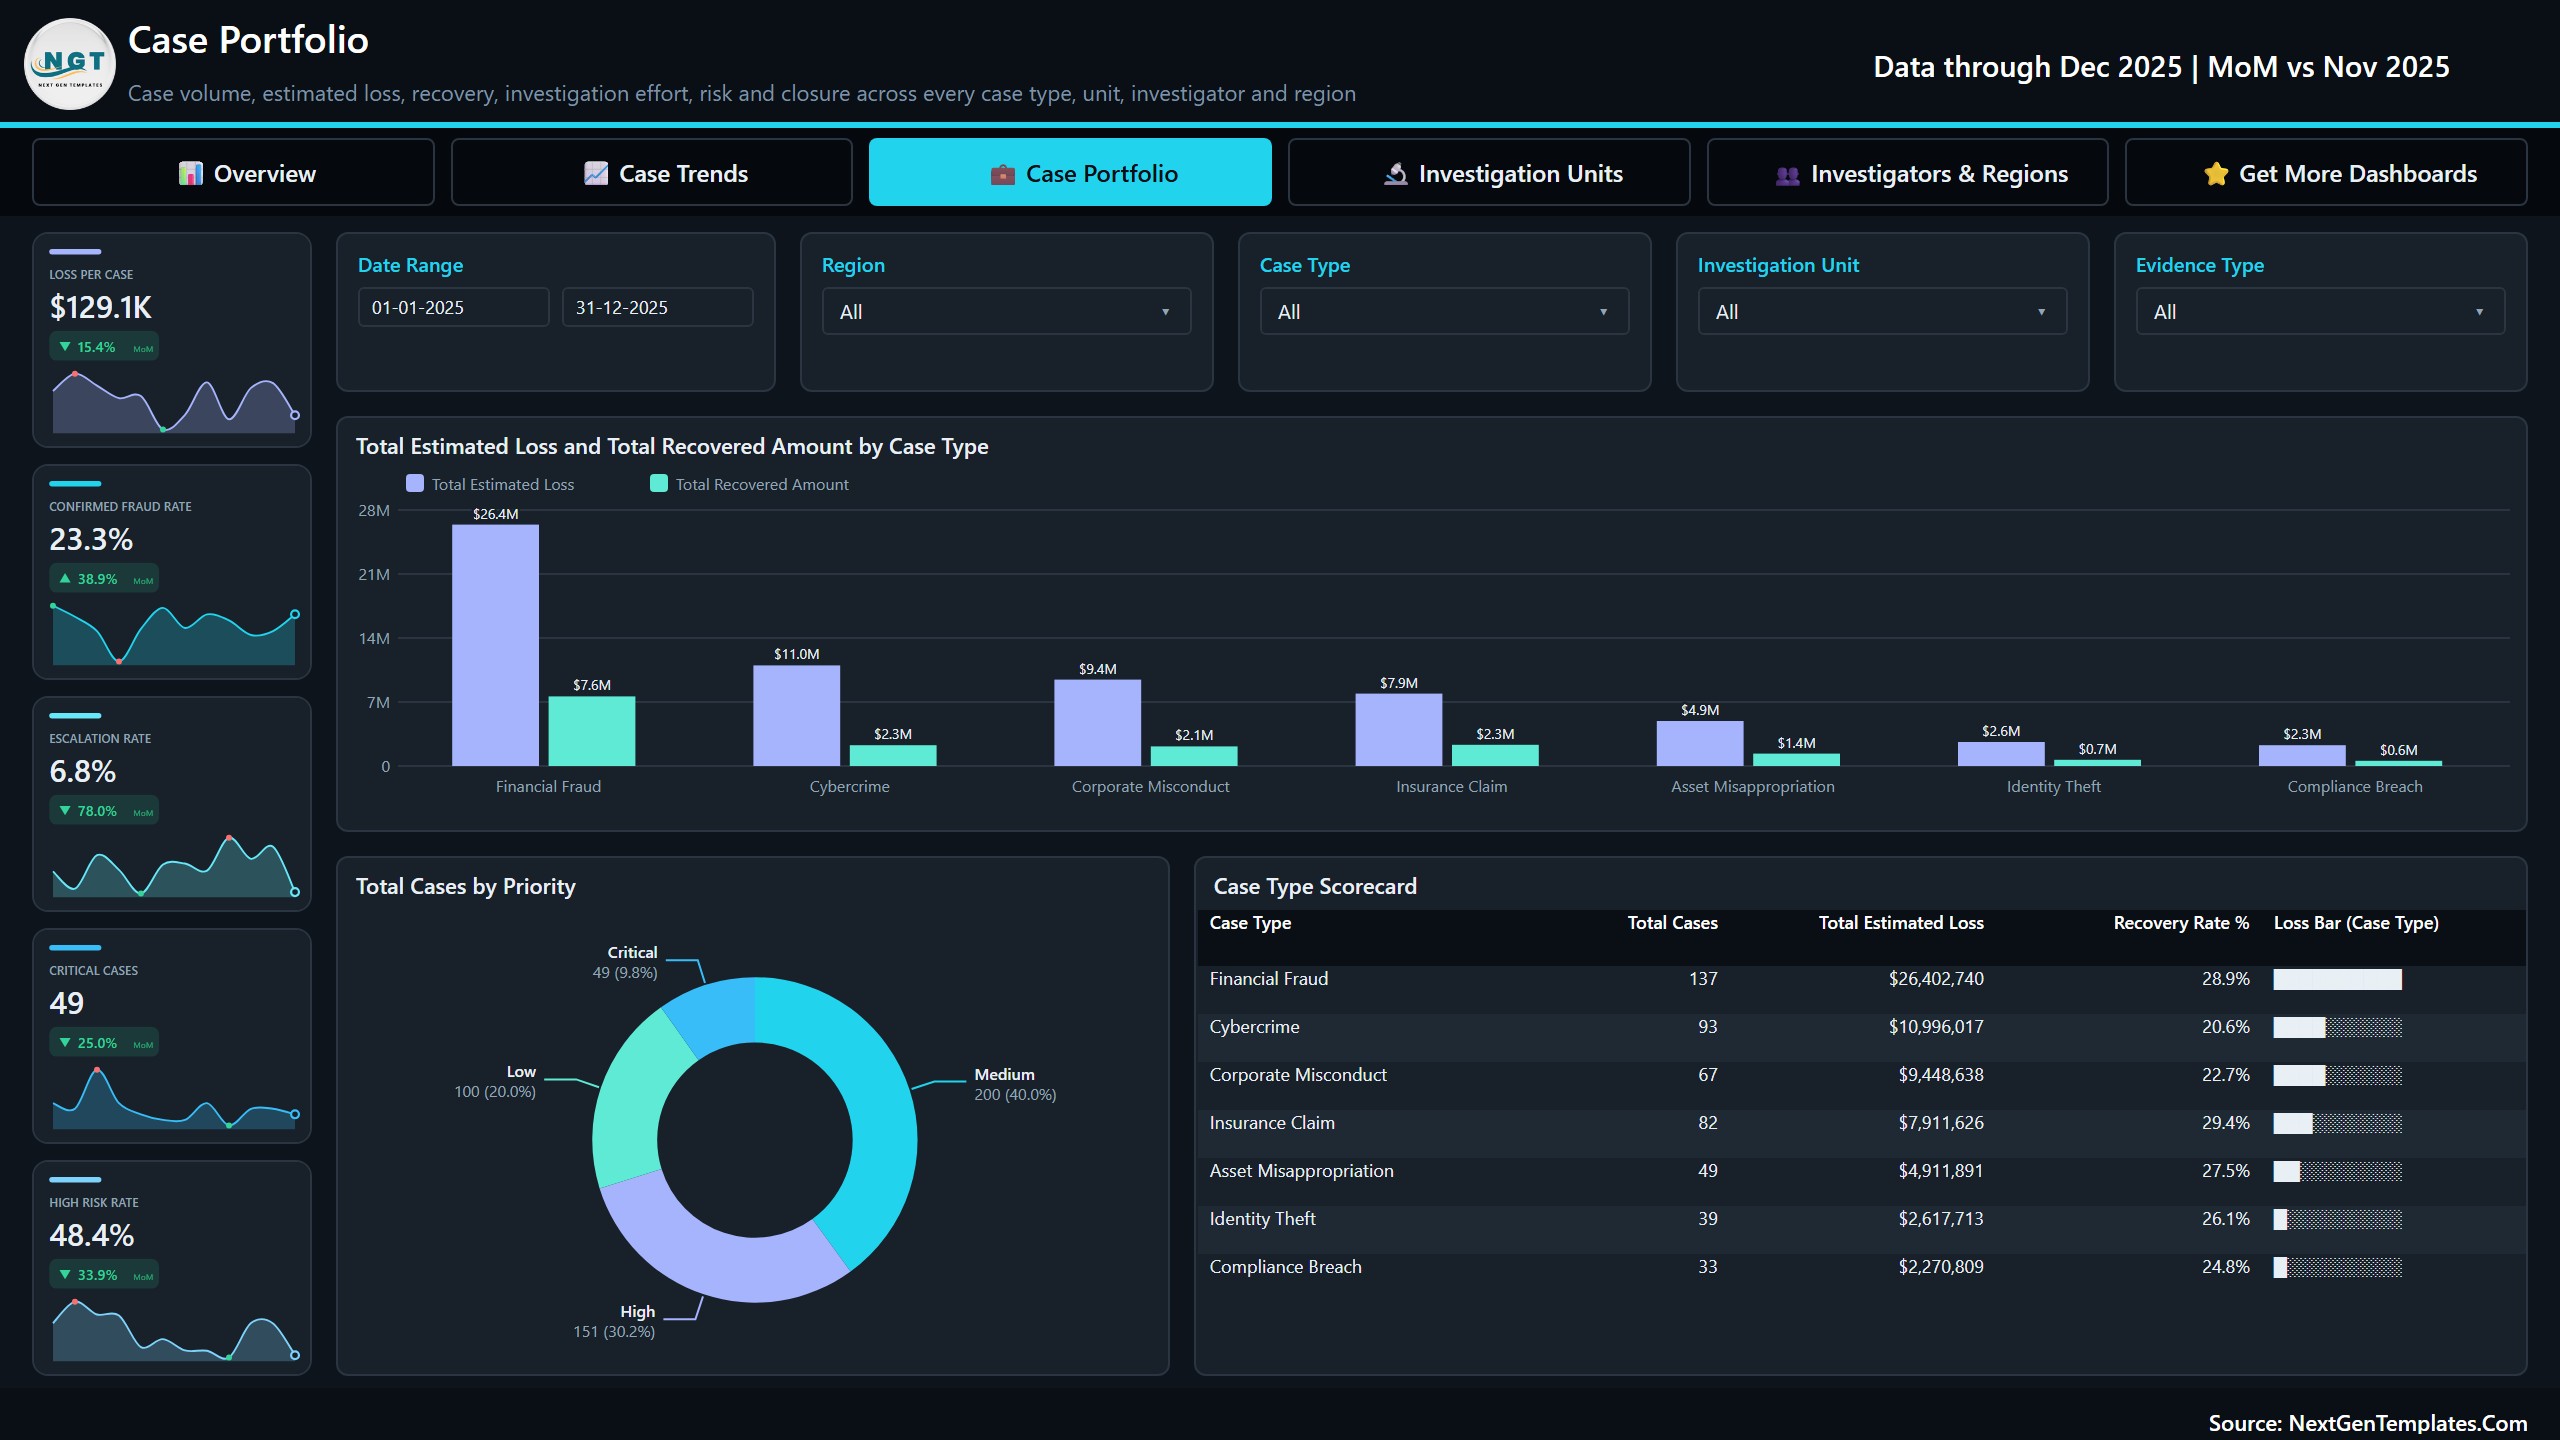
The case-type view, led by Loss Per Case $129.1K, Confirmed Fraud Rate 23.3%, Escalation Rate 6.8%, Critical Cases 49 and High Risk Rate 48.4%. Total Estimated Loss and Total Recovered Amount by Case Type sets the two bars side by side for all seven types, Total Cases by Priority splits Medium 200, High 151, Low 100 and Critical 49, and the Case Type Scorecard lists each type with its case count, estimated loss and recovery rate.
Page 4: Investigation Units
The capacity page. Hours Per Case, Evidence Per Case, Interviews Per Case and Recovered Per Hour sit above a 4.31 Quality Rating displayed as stars. Total Investigation Hours and Recovery Rate % by Investigation Unit compares Financial Investigation, Corporate Intelligence, Field Investigation, Compliance Review and Digital Forensics; Total Cases by Evidence Type ranks Financial Documents, Surveillance Media, Communication Logs, Physical Evidence, Witness Statements and Digital Records; and the Investigation Unit Scorecard adds case count, hours and average quality rating per unit.
Page 5: Investigators & Regions
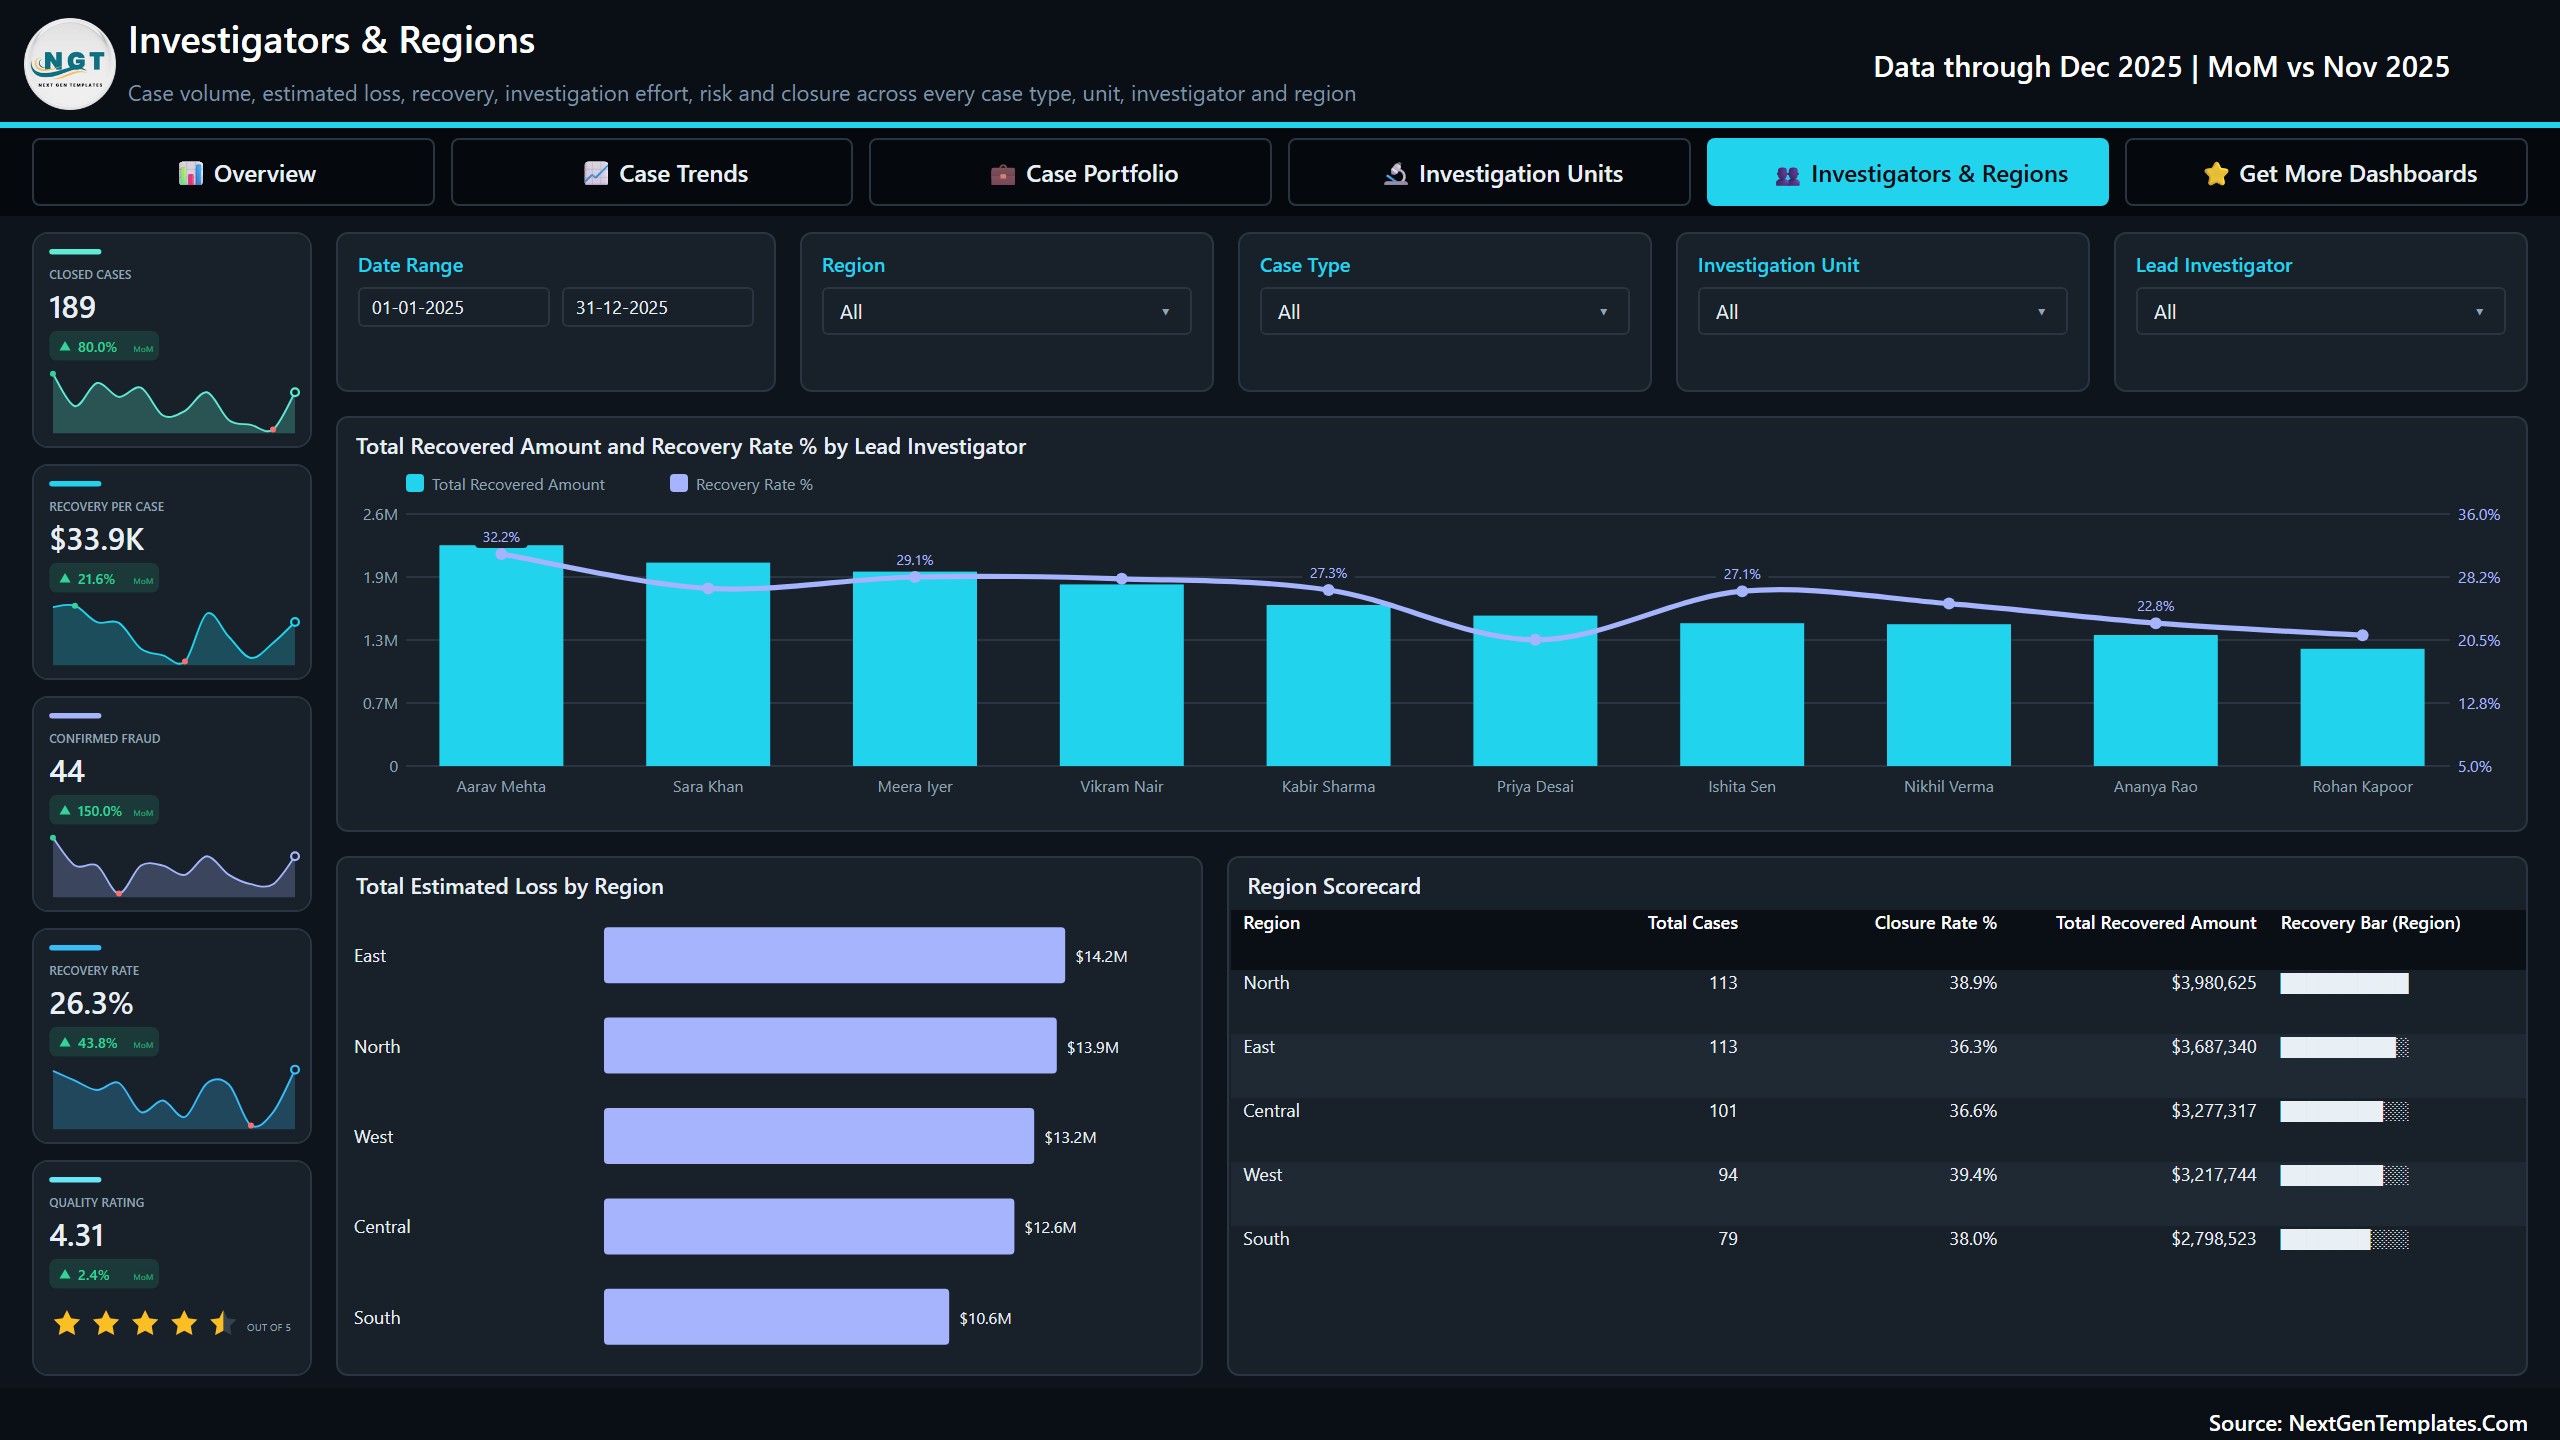
The people-and-place page, reporting Closed Cases 189, Recovery Per Case $33.9K, Confirmed Fraud 44, Recovery Rate 26.3% and Quality Rating 4.31. Total Recovered Amount and Recovery Rate % by Lead Investigator ranks ten named investigators on both recovered cash and rate, Total Estimated Loss by Region splits East, North, West, Central and South, and the Region Scorecard reports cases, closure rate and recovered amount for each region.
Feature Comparison: This Template vs. Tableau / Qlik vs. Paid Case-Management SaaS
| Feature | Forensics & Investigation Dashboard in Power BI | Tableau / Qlik build | Paid case-management SaaS (Case IQ, Resolver) |
|---|---|---|---|
| Cost | $29.99 one-time ✅ | Licence per creator, per month | Subscription, typically per user per month |
| Platform | Power BI Desktop (free) ✅ | Tableau Desktop / Qlik Sense licence | Vendor-hosted web app |
| Setup time | Under 15 minutes ✅ | Days of build work | Weeks, with vendor onboarding |
| Ready on day one | 5 pages, 25 KPIs, 15 visuals ✅ | Nothing — you build it | Vendor’s fixed report set |
| Editable model and visuals | Yes — .pbix plus Data.xlsx ✅ | Yes | No |
| Case intake, evidence, chain of custody | No — reporting only | No | Yes ✅ |
| Permissions and audit trail | No | Via server licence | Yes ✅ |
| Year-1 cost at 5 users | $29.99 total ✅ | Four figures | Four to five figures |
| Works offline | Yes, the file is yours ✅ | Yes | No |
For a team that needs the analytics layer and already has a system of record, this sits in the sweet spot. For intake, evidence custody and permissions, buy the SaaS.
Who Should Use This Template
Perfect for:
- Internal audit and corporate-investigation leads who export case records and need a reporting view over them
- Insurance special investigation units reporting claim-fraud volume, loss and recovery to management
- BI analysts who want a Power BI dashboard for case management reporting that they can restyle and extend
- Trainers and consultants who need a realistic investigation case analytics dashboard for demonstrations
Not a fit if:
- You need an actual case-management system with intake, evidence storage, chain of custody and permissions
- You need output that will stand up in court or in a regulatory filing
- You want to store real case detail or personal data — there is no access control in a .pbix file
- You need live operational alerting rather than periodic reporting
- You do not have Power BI Desktop, or you want to edit in a browser Forensics & Investigation Dashboard in Power BI
Real-World Use Cases
Ravi, head of internal audit at a manufacturer. Each month he drops a fresh case extract into Data.xlsx and walks his audit committee through the Case Portfolio page. The Case Type Scorecard answers their standing question — where the loss sits — in one screen, replacing the deck he used to rebuild by hand.
Meera, who runs a five-person special investigation unit at an insurer. She uses the Investigation Units page to compare hours per case and recovered-per-hour across her analysts, and Total Cases by Evidence Type to argue for a surveillance budget line. Case detail stays in the claims system; only aggregates reach the report.
Daniel, who teaches business intelligence. He hands students this fraud investigation dashboard template as a worked example of a multi-page report with a repeated slicer panel, and has them rebuild the recovery-rate measure from scratch in DAX.
Advantages of This Dashboard
The obvious advantage of a ready-made forensics dashboard template is cost: one payment against a per-seat subscription, with no renewal and no user-count creep. The less obvious one is time. A five-page report with a consistent slicer panel, 25 cards and three scorecard tables is roughly a week of build work if you start from an empty canvas, and most of that week goes into layout decisions that have nothing to do with your data.
The second advantage is that the measures are visible. Because you get the .pbix rather than a hosted report, you can open every measure, see exactly how recovery rate or closure rate is calculated, and change the definition to match how your organisation counts. A hosted tool gives you its definition and no way to argue with it.
Third, the pairing of effort and outcome on one page is unusual. Most case reporting stops at volume and status. Putting Recovered Per Hour next to Hours Per Case turns a workload report into a return-on-effort conversation, which is normally the one that unlocks headcount.
Opportunities for Improvement
An honest list. There is no row-level security in the file, so anyone who opens it sees everything — fine for aggregates, wrong for anything identifiable. The data model expects one row per case; if your source is event-level, you will need to aggregate before loading. The refresh is manual unless you publish to a workspace and schedule it. There is no what-if or forecasting page, and no drill-through to a case detail view, both of which you would need to add yourself.
The ten investigator names in the sample are fictional and Indian-market flavoured, which reads oddly if you demo the file unchanged to a European audience — rename them before a client demo. And the quarterly view covers a single year, so year-over-year comparison requires extending the sample calendar.
Best Practices
- Load aggregates, not identities. Strip names, account numbers and free-text notes before the extract ever reaches the file.
- Keep the column names in Data.xlsx exactly as shipped on your first refresh; rename dimensions afterwards, once you know the report works.
- Agree the definition of “closed” and “confirmed fraud” with your stakeholders before you publish, because both drive headline rates.
- Use the Date Range slicer rather than deleting rows when you want a narrower period — the month and quarter visuals depend on a continuous calendar.
- Publish to a workspace and schedule the refresh if more than two people need the report; sharing the .pbix by email means version drift within a fortnight.
- Get Power BI Desktop from Microsoft directly and keep it current; older builds occasionally render newer visual settings differently.
Explore Relevant Templates
- Forensics & Investigation KPI Dashboard in Power BI — the scorecard edition, with a month picker and traffic lights instead of these five analytical pages.
- Forensics & Investigation KPI Dashboard in Excel — the same scorecard idea for teams working in Excel.
- Anti-Money Laundering (AML) KPI Dashboard in Power BI — the closest neighbour on the financial-crime side.
- Digital Identity Platforms Dashboard in Power BI — another five-page analytical build, on identity and verification data.
- An Excel edition of this same subject, Forensics & Investigation Dashboard in Excel, is being prepared and will live at this link. It is an independent build, not a port — page counts, KPI names and chart sets differ between the two editions.
Frequently Asked Questions
What does this dashboard measure?
Case volume, estimated loss, recovered amount, recovery rate, closure rate, risk score, investigation hours, evidence and interview counts and quality rating — 25 KPI cards in all — sliced by case type, status, priority, evidence type, investigation unit, lead investigator, region and month.
Is the Forensics and Investigation Dashboard in Power BI a case-management system?
No. It is a reporting template only. There is no intake, no evidence storage, no chain-of-custody tracking, no permissions and no audit trail, and it does not connect to any case-management platform. It visualises a data extract that you supply and refresh yourself.
Can I use its output as evidence?
No. Nothing in the file is designed, tested or certified for evidentiary or legal admissibility. Treat it as internal management reporting. Anything destined for a court process or a regulatory filing should come from your system of record under your own controls.
Is the sample data real?
No. All 500 cases, the ten investigator names and every figure shipped in the file are fictional, generated so the visuals render realistically. Replace them with your own extract before showing the report to any stakeholder.
How long does setup take?
Under 15 minutes when your extract already has one row per case: unzip, open the .pbix, replace the rows in Data.xlsx, repoint the source and refresh. Renaming case types, units and regions to your own vocabulary adds a few more minutes.
How does it compare to paid case-management software?
Platforms such as Case IQ or Resolver handle intake, evidence and permissions, none of which this template does. What a single payment buys here is the analytics layer — five pages, 25 KPIs and 15 visuals — that you would otherwise build yourself or rent per seat.
Do I need a paid Power BI licence?
Not to open or edit it. Power BI Desktop is free. A Pro or Premium licence is only needed if you want to publish the report to the Power BI service and share it with colleagues there.
About the Author
Built by PK — Microsoft Certified Professional with 15+ years of Excel, Google Sheets and Power BI experience, and founder of NextGenTemplates, reaching 300K+ subscribers across YouTube. Every template is hand-built and tested before release. For context on the loss and detection figures this kind of reporting surfaces, the ACFE’s Report to the Nations is the standard benchmark.
Conclusion
If your cases already live in a system and what you lack is the reporting layer, the Forensics and Investigation Dashboard in Power BI gives you five pages, 25 KPI cards and 15 visuals for a single payment, with the model open for you to change. Just keep it on the right side of the line: aggregates in, identities out, and nothing from it going anywhere near a filing.
👉 Click here to purchase the Forensics & Investigation Dashboard in Power BI
Instant download · One-time payment · No subscription
🎥 More step-by-step tutorials: YouTube.com/@PKAnExcelExpert
Last updated: September 2026