Green building certification is now a board-level reporting topic for real estate owners, construction firms, consultants, facility teams, and sustainability leaders. Certification programs such as LEED, BREEAM, WELL, and Green Globes require project teams to track building area, audit performance, energy savings, waste diversion, utility savings, certification cost, and documentation progress across many locations. The Green Building Certification Dashboard in Excel gives that reporting structure in a ready-to-use workbook, so teams can replace scattered project trackers with a clean Excel dashboard.
This template includes five analysis pages, a Data sheet, and a Support sheet with pivot tables. Users can add their own records, refresh the workbook, and review certification progress through cards, charts, and slicers. It is designed for teams that want practical Excel-based reporting without subscribing to a full ESG or construction management SaaS platform.
Key Features of Green Building Certification Dashboard in Excel
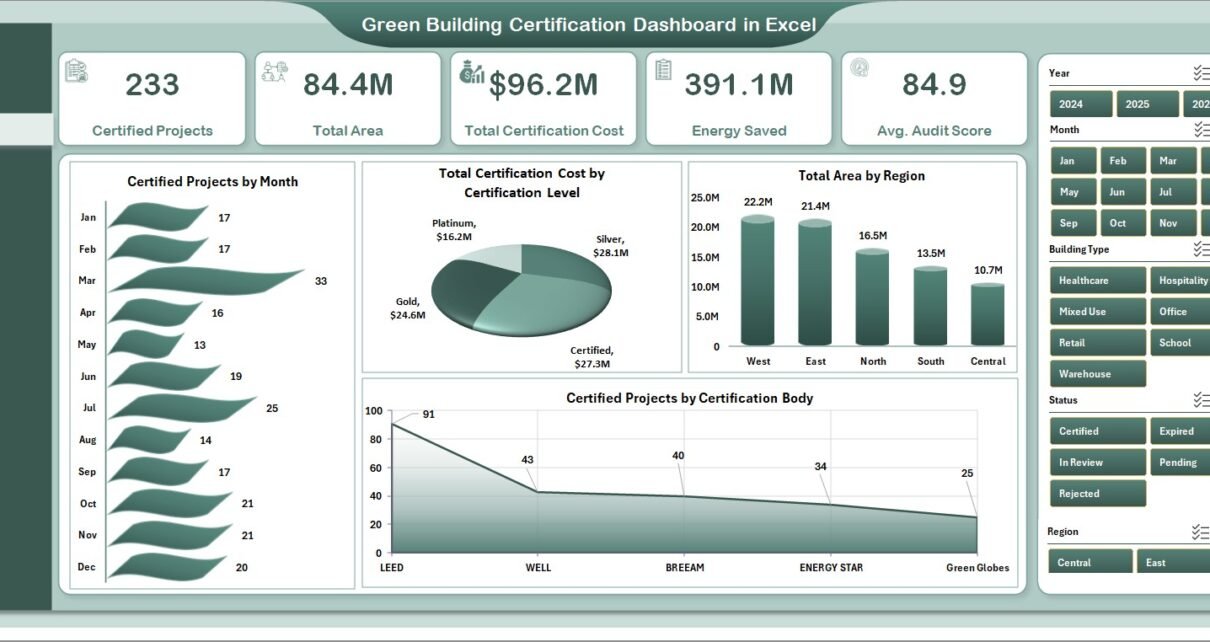
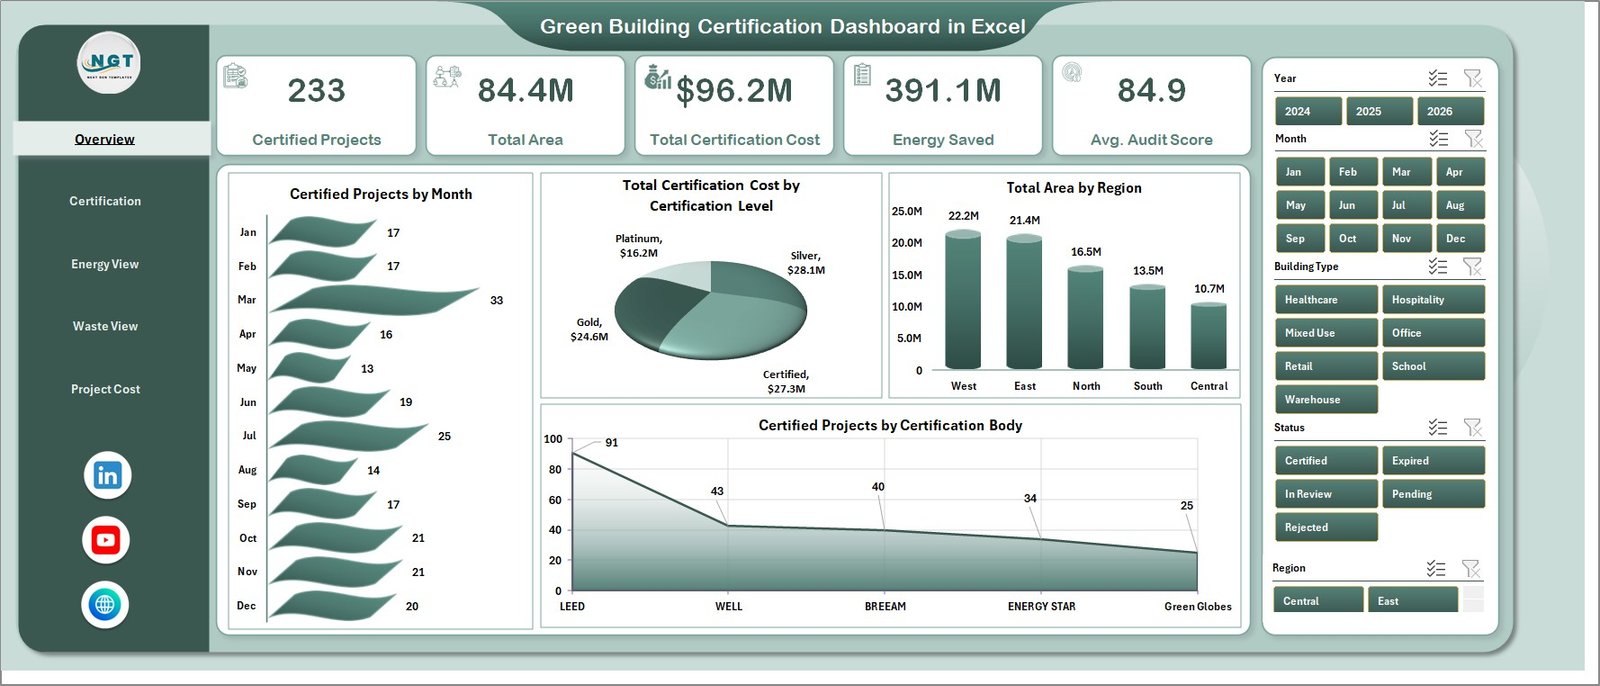
The dashboard gives a high-level view of certification performance using five headline cards: Certified Projects, Total Area, Total Certification Cost, Energy Saved, and Avg. Audit Score. These indicators help managers understand scale, cost, efficiency impact, and audit quality before drilling into specific charts.
The workbook also includes multiple slicers so users can filter the dashboard quickly. Depending on the data fields used in the template, teams can review results by region, city, certification level, certification body, project phase, building type, consultant, status, year, month, and other sustainability dimensions. This makes the dashboard useful for monthly reporting, consultant reviews, portfolio meetings, and ESG presentations.
The biggest advantage is the pivot-based structure. You do not need to rebuild charts after updating data. Add records in the Data sheet, keep the same format, click Refresh All from the Excel Data ribbon, and the pivot tables plus dashboard visuals update together. Microsoft also documents this workflow in its guidance for refreshing PivotTable data in Excel.
Dashboard Pages Explanation
1. Overview Page
The Overview page gives the first snapshot of the portfolio. The cards show Certified Projects, Total Area, Total Certification Cost, Energy Saved, and Avg. Audit Score. A sustainability manager can use these cards to answer basic leadership questions quickly: how many projects are certified, how much certified area is represented, how much has been spent, and whether the audit score is moving in the right direction.
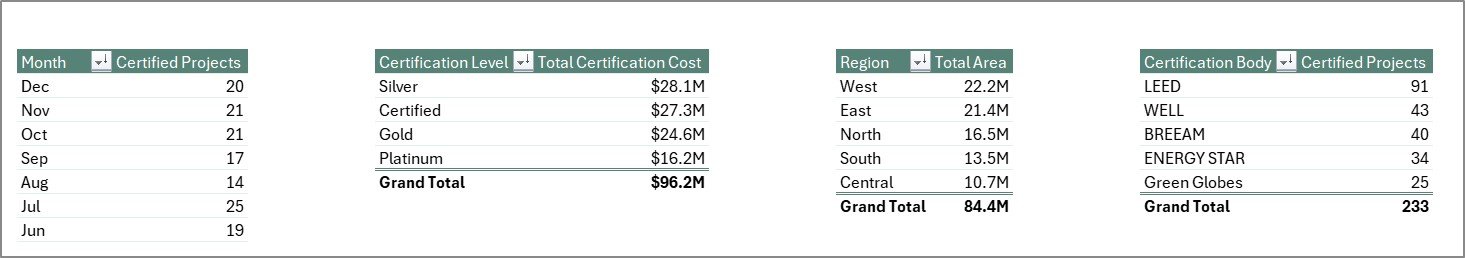
Certified Projects by Month shows how project completions or certifications trend over time. Total Certification Cost by Certification Level helps compare cost by achievement tier. Total Area by Region highlights where certified square footage is concentrated. Certified Projects by Certification Body shows the mix of programs or certification organizations across the portfolio.
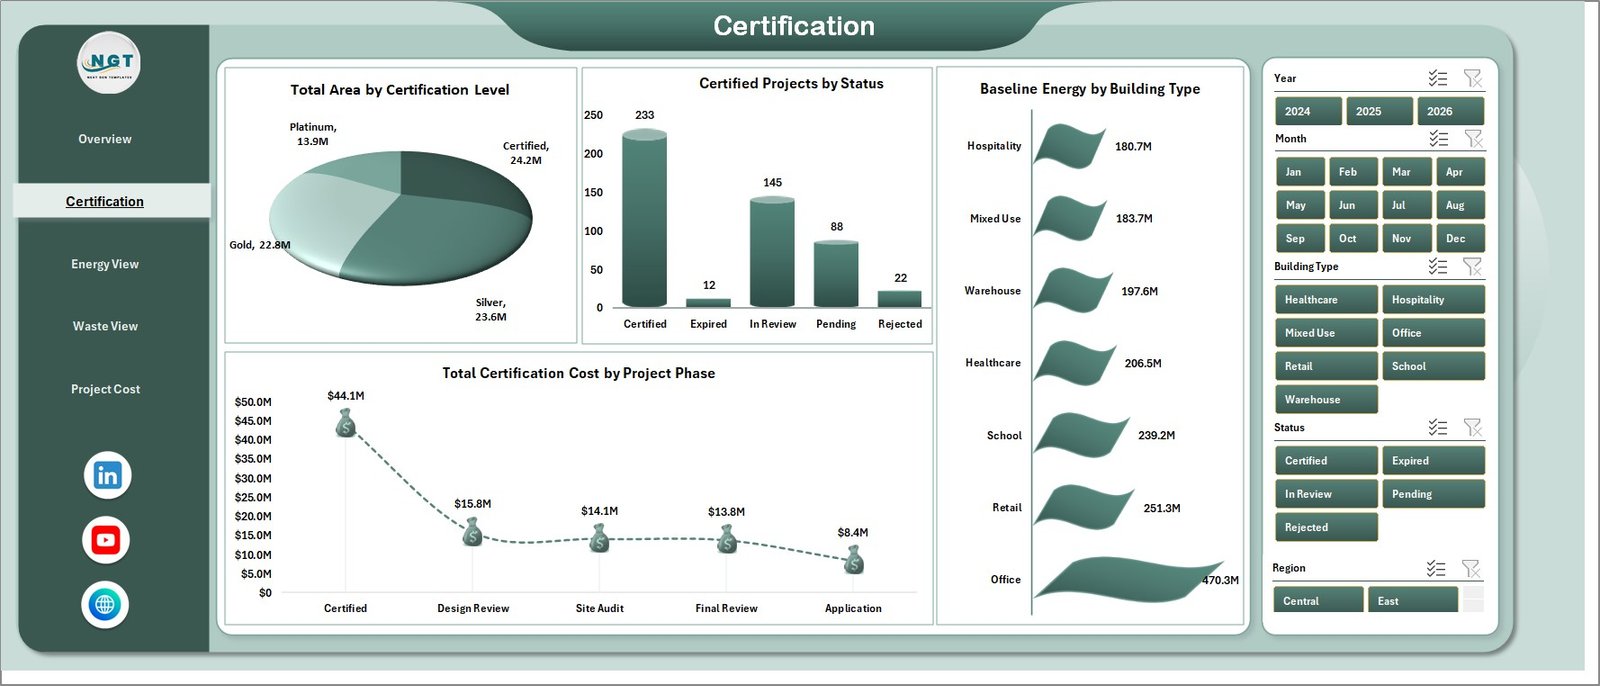
2. Certification Page
The Certification page focuses on certification progress and project structure. Total Area by Certification Level compares how much building area has reached each rating tier. Certified Projects by Status separates completed, pending, in-progress, or other project statuses so teams can see pipeline movement.
Baseline Energy by Building Type helps compare starting energy demand across building categories. Total Certification Cost by Project Phase shows how spending is distributed across phases such as design, documentation, construction, audit, and final certification.
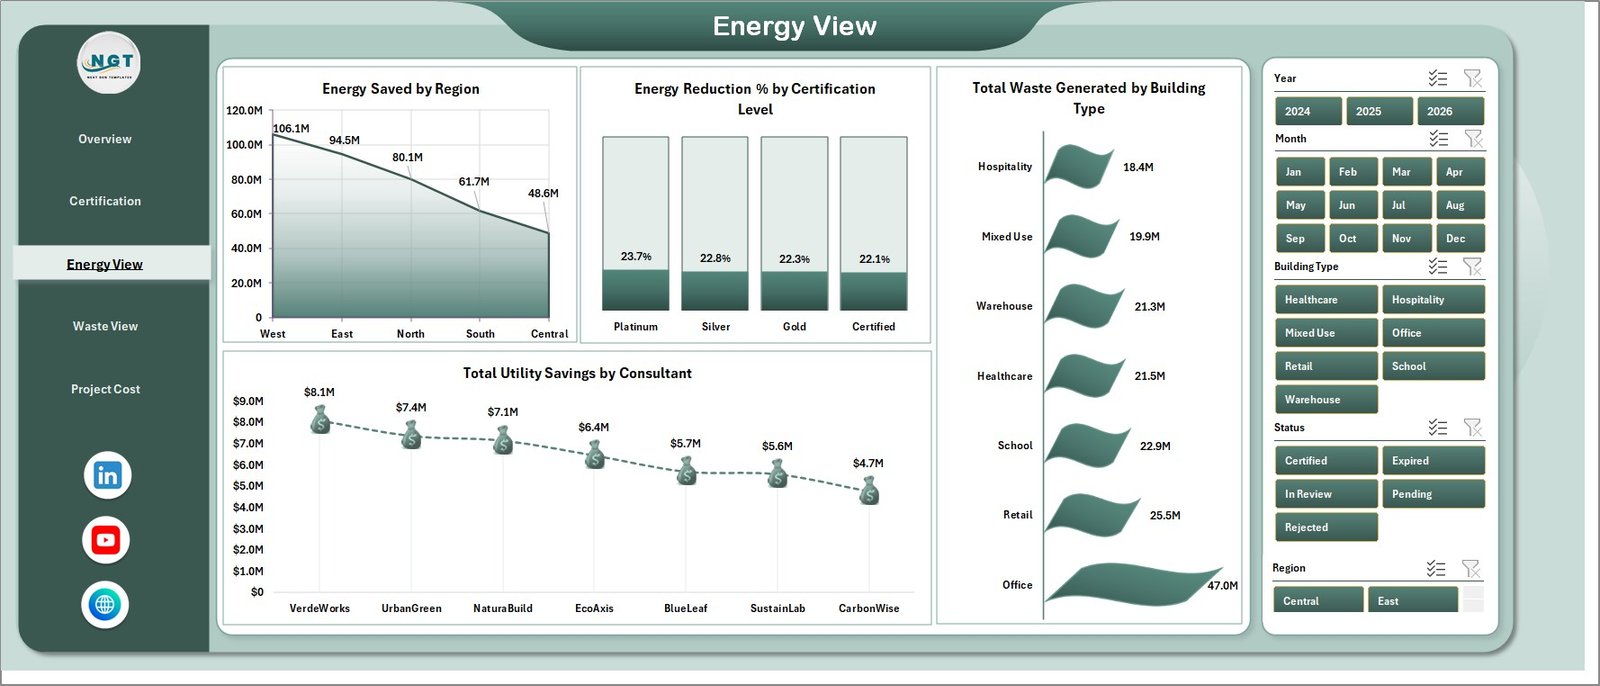
3. Energy View Page
The Energy View page explains whether certification work is producing measurable energy and utility improvements. Energy Saved by Region compares the energy impact across locations. Energy Reduction % by Certification Level shows whether higher certification levels are associated with better reduction performance.
Total Waste Generated by Building Type adds context around operational or construction waste by building category. Total Utility Savings by Consultant helps teams compare consultant contribution to savings outcomes.
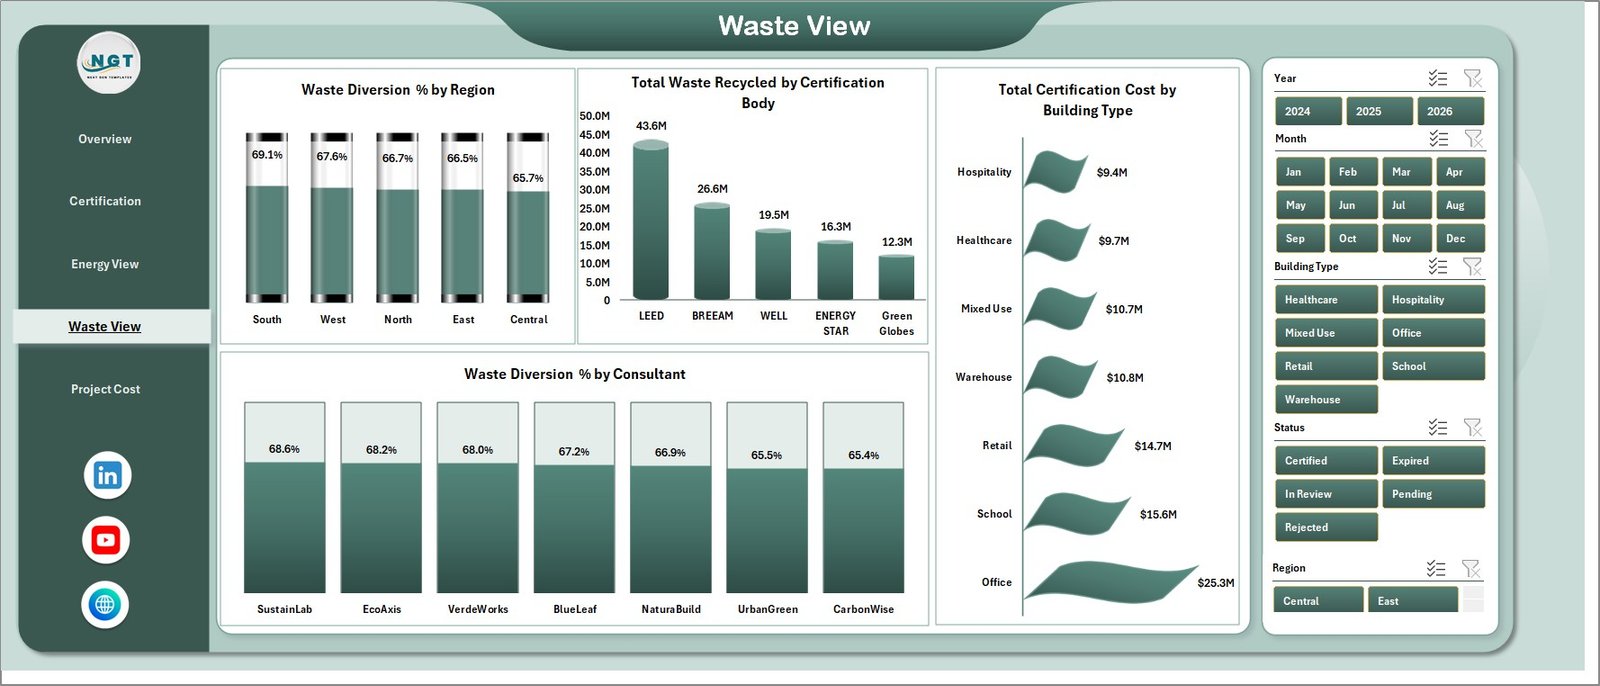
4. Waste View Page
The Waste View page is built for sustainability and circularity review. Waste Diversion % by Region compares how much waste is being diverted from landfill by location. Total Waste Recycled by Certification Body helps teams understand recycling results by certification route or governing body.
Total Certification Cost by Building Type compares cost pressure across building groups. Waste Diversion % by Consultant highlights which consultants are helping projects achieve stronger waste outcomes.
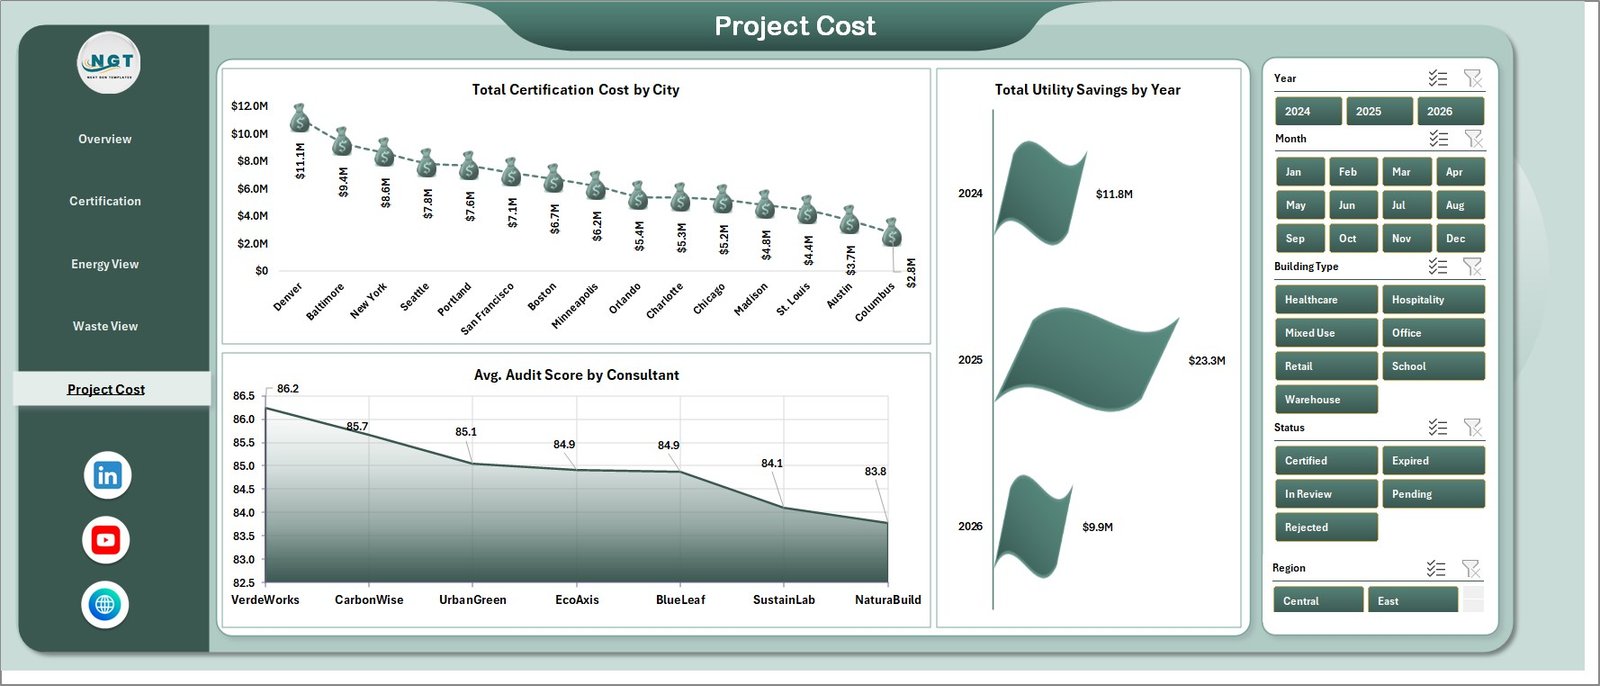
5. Project Cost Page
The Project Cost page helps teams review spend, consultant quality, and financial return. Total Certification Cost by City identifies cities with the highest certification cost. Avg. Audit Score by Consultant compares audit score performance by service provider. Total Utility Savings by Year helps measure whether green building investments are producing year-over-year savings.
6. Data Sheet Tab
The Data sheet is where users maintain the underlying records. Add your green building certification data in the same format, including the project, location, certification, consultant, phase, cost, energy, waste, and utility fields used by the workbook.
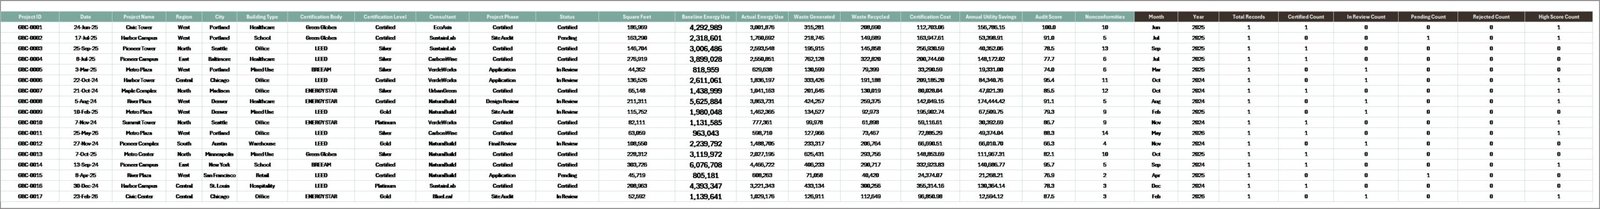
7. Support Sheet Tab
The Support sheet contains pivot tables that drive the dashboard. After updating the Data sheet, go to the Excel Data ribbon and click Refresh All. The pivots and connected charts refresh together. During normal reporting, this sheet can be hidden to keep the workbook clean for dashboard users.
Green Building Certification Dashboard in Excel vs. Google Sheets vs. Paid ESG SaaS – Feature Comparison
| Feature | Green Building Certification Dashboard in Excel | Google Sheets Alternative | Paid ESG SaaS |
|---|---|---|---|
| Cost | $17.99 one-time | Low software cost but manual build effort | Monthly or annual subscription |
| Platform | Microsoft Excel | Google Sheets | Vendor cloud system |
| Setup time | Replace data and refresh | Build charts, formulas, and filters manually | Configuration and onboarding |
| Real-time team collaboration | Available via OneDrive or SharePoint | Native | Usually included by plan |
| Mobile access | Excel mobile app | Sheets mobile app | Usually included |
| Customizable fields | Editable workbook and pivots | Editable but manual | Depends on vendor permissions |
| Share with link | Available through Microsoft 365 | Native sharing | Usually login controlled |
| Year-1 cost at 5 users | $17.99 plus Microsoft licensing if needed | Low license cost but more labor | Often hundreds or thousands |
| Certification-focused pages | Included | Must be built | Depends on module |
Who Should Use This Template
This template is ideal for sustainability managers, green building consultants, construction project managers, facility teams, ESG analysts, real estate portfolio managers, architects, engineering consultants, and certification coordinators who use Excel for monthly reporting.
It is also helpful for small and mid-sized organizations that need structured reporting but are not ready to buy an enterprise ESG system. If your team already keeps certification data in spreadsheets, this dashboard gives you a better reporting layer without changing platforms.
Real-World Use Cases
Asha, sustainability manager: Asha tracks certified projects, total certified area, energy saved, and average audit score before her monthly ESG meeting.
Daniel, green building consultant: Daniel compares utility savings and waste diversion by consultant and region to explain which project teams are producing the strongest outcomes.
Maria, real estate portfolio analyst: Maria reviews certification cost by city and certification level to prepare a budget commentary for leadership.
Advantages of Green Building Certification Dashboard in Excel
The main advantage is speed. The workbook gives you ready-made reporting pages for certification progress, cost, energy, waste, and utility savings. Instead of building pivot charts from scratch, users can focus on maintaining good project data.
The dashboard is also flexible. Because it is built in Excel, users can add fields, adjust chart titles, update colors, rename pages, and tailor slicers to their own certification process. The one-time price is useful for teams that need a reporting tool but want to avoid another recurring subscription.
Opportunities for Improvement
This template is not a live integration tool. Teams with automatic data feeds from building management systems, utility meters, ERP platforms, or ESG software may need a custom Power BI model or database connection. The workbook also depends on consistent data entry. If project names, cities, certification bodies, or consultant names are typed inconsistently, the pivot charts may split similar values into separate groups.
Best Practices
Keep the Data sheet structure unchanged when replacing sample data. Standardize certification level names, consultant names, city names, and building types before refreshing. Update the dashboard monthly so energy saved, utility savings, waste diversion, and certification cost remain current. Hide the Support sheet after setup so casual users work only with the dashboard pages and Data sheet.
Explore Relevant Templates
You can download the Green Building Certification Dashboard in Excel from NextGenTemplates. You may also like the Green Building KPI Dashboard in Excel, the Geothermal Energy Dashboard in Power BI, and the Nonprofit Grant Dashboard in Excel. Browse more Excel dashboard templates.
Frequently Asked Questions
What is the Green Building Certification Dashboard in Excel?
It is a ready-to-use Excel dashboard for tracking green building certification projects, area, cost, energy saved, audit score, waste diversion, utility savings, and certification progress.
What pages are included in the workbook?
The workbook includes Overview, Certification, Energy View, Waste View, Project Cost, Data Sheet, and Support Sheet tabs.
Can I use this dashboard for LEED or BREEAM tracking?
Yes. You can use the template for certification programs such as LEED, BREEAM, WELL, Green Globes, or internal green building scorecards, as long as your data follows the dashboard structure.
How do I update the dashboard?
Add or replace records in the Data sheet, keep the same column format, then click Refresh All from the Excel Data ribbon.
Can I hide the Support sheet?
Yes. The Support sheet contains pivot tables used by the dashboard and can be hidden after setup.
Is this template a subscription?
No. It is a one-time purchase Excel template from NextGenTemplates.
About the Author
Built by PK – Microsoft Certified Professional with 15+ years of Excel, Google Sheets, and Power BI experience. Founder of NextGenTemplates, reaching 300K+ subscribers across YouTube channels. Every template is hand-built and tested before release.
Conclusion
The Green Building Certification Dashboard in Excel is a practical reporting tool for teams that need to monitor certification progress, cost, audit scores, energy savings, waste diversion, and utility savings in one workbook. It is especially useful for consultants and sustainability teams that already manage project records in Excel and want a cleaner way to present results.
Visit our YouTube channel for step-by-step Excel and dashboard tutorials: Youtube.com/@PKAnExcelExpert.