Real Estate Crowdfunding Dashboard in Power BI is a ready-to-use Power BI dashboard template for tracking target raise, funded amount, platform fees, distributions, deals, active deals, investor segments, risk tiers, sponsors, platforms, funding rounds, regions, and property types in one interactive report. Real estate crowdfunding teams often work with exports from platforms, sponsor updates, investor reporting files, and manual investment logs. When those records stay scattered, it becomes harder to explain funding progress, fee impact, risk exposure, and distribution performance. This dashboard gives users 5 focused Power BI pages with KPI cards, charts, and slicers for faster portfolio review.
Power BI is especially useful for this type of reporting because it can combine structured tables, measures, relationships, filters, and visuals in one model. Microsoft provides official Power BI learning and documentation here: Microsoft Power BI documentation. The goal of this template is simple: help sponsors, analysts, fund managers, and investor relations teams review crowdfunding performance without building a .pbix report from a blank canvas.
Click here to purchase the Real Estate Crowdfunding Dashboard in Power BI.
Key Features of Real Estate Crowdfunding Dashboard in Power BI
- 5 interactive report pages covering Overview, Funding, Property, Investor, and Risk.
- 5 executive KPI cards showing Total Target Raise, Total Platform Fees, Total Distributions, Total Deals, and Active Deal Count.
- Funding analysis visuals for funding round, property type, and regional completion rate.
- Investor analysis views for quarterly distributions, investor count by platform, and funded amount by risk tier.
- Risk review page for platform fee ratio, exited deal count by sponsor, and total deals by risk tier.
- Multiple slicers so users can filter quickly during portfolio meetings and investor updates.
- Editable Power BI file that can be customized in Power BI Desktop.
Dashboard Pages Explanation
1 – Overview Page
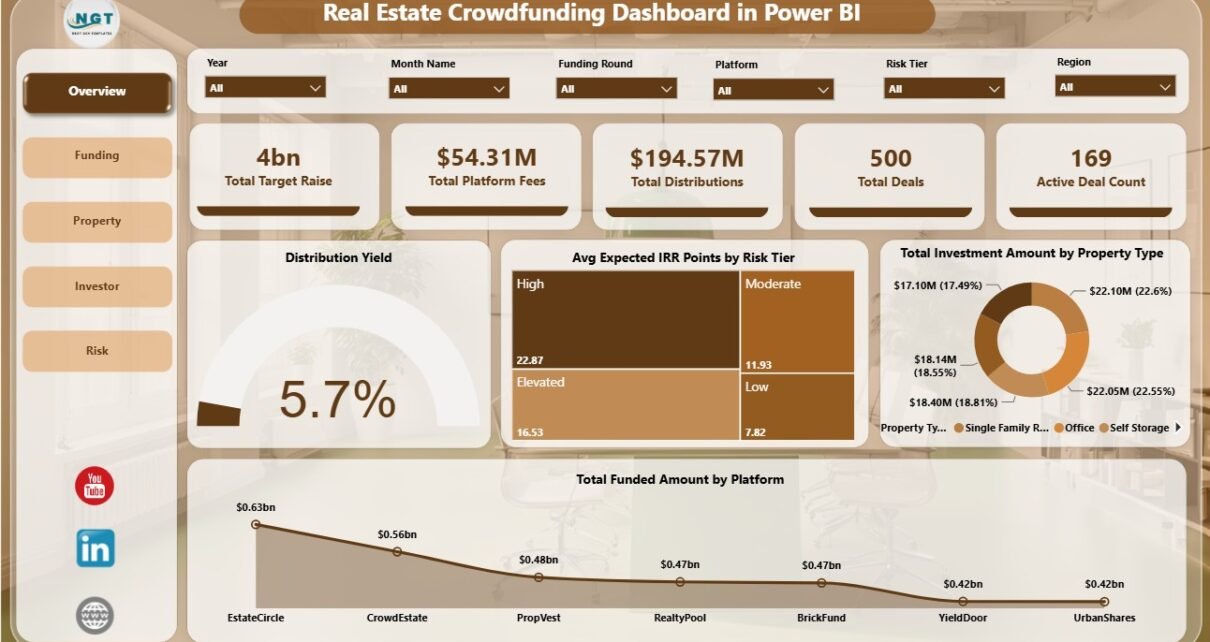
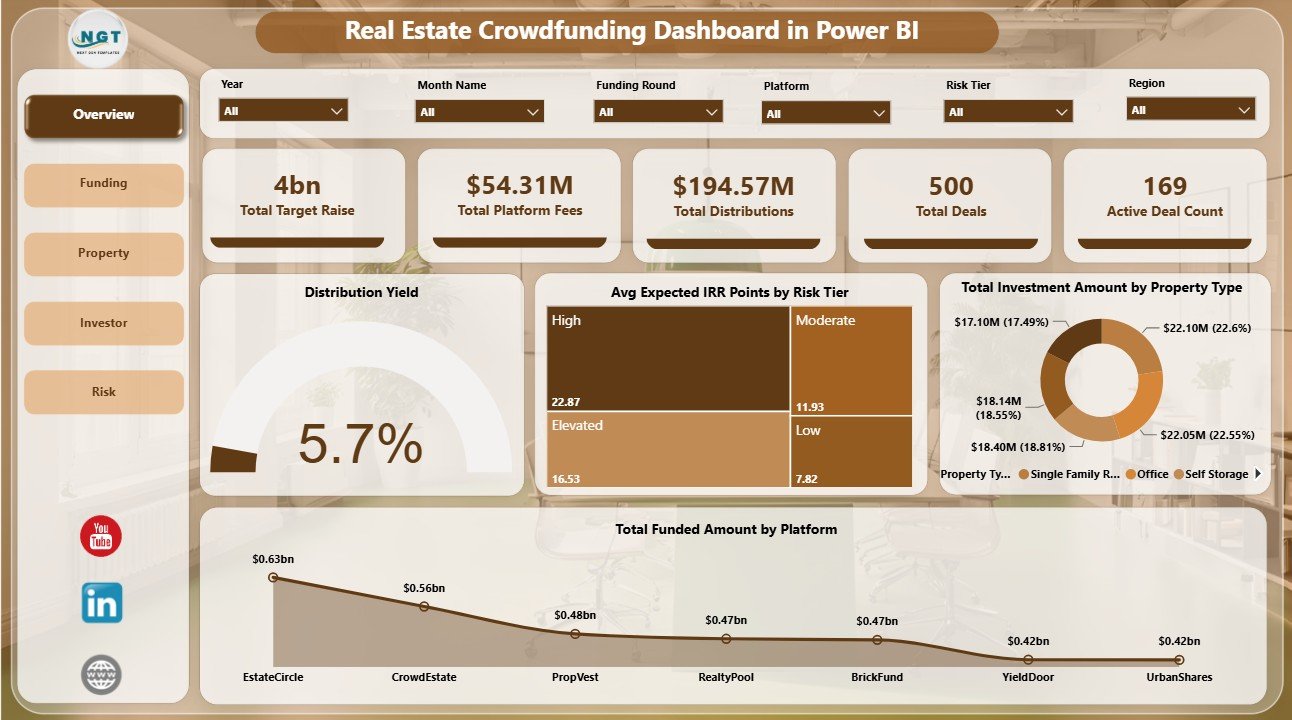
The Overview page gives a high-level view of the crowdfunding portfolio. At the top, users can see Total Target Raise, Total Platform Fees, Total Distributions, Total Deals, and Active Deal Count. These cards help decision-makers understand capital targets, fee burden, payout activity, deal volume, and current active opportunities before reviewing detailed charts.
Distribution Yield by Overall Portfolio: This chart shows distribution yield for the overall portfolio. It helps investors understand whether the portfolio is producing enough income return from funded and active deals.
Avg Expected IRR Points by Risk Tier: This chart compares expected IRR across risk tiers. It helps users check whether higher-risk opportunities are offering a return expectation that matches the risk profile.
Total Investment Amount by Property Type: This chart shows where investment capital is concentrated by property type. It helps compare exposure across multifamily, office, retail, industrial, mixed-use, and other real estate assets.
Total Funded Amount by Platform: This chart compares funded amount by crowdfunding platform. It helps analysts see which platforms are generating stronger fundraising results.
Real Estate Crowdfunding Dashboard in Power BI
2 – Funding
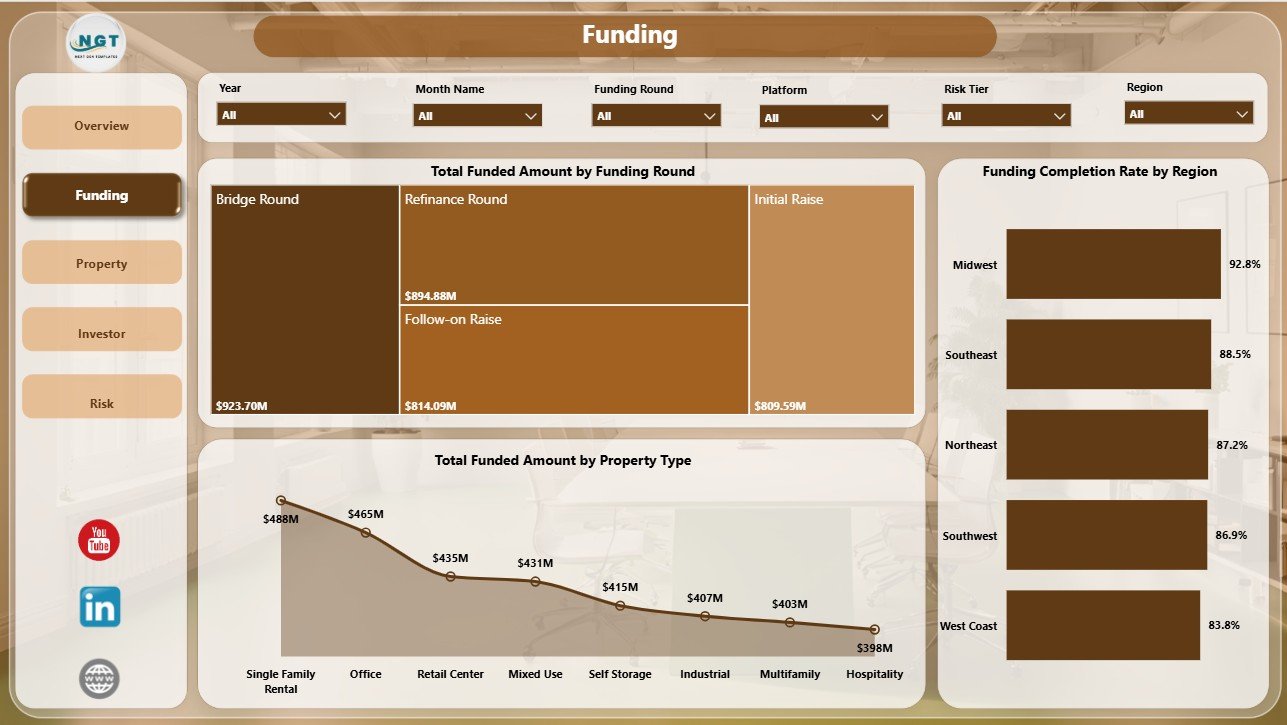
The Funding page focuses on capital movement, completion rate, and property type performance. Sponsors and analysts can use this page to compare how different funding rounds and regions are performing.
Total Funded Amount by Funding Round: This chart compares funded capital by round. It helps separate early campaign performance from follow-on or later-stage fundraising.
Total Funded Amount by Property Type: This chart compares funded capital by asset class. It helps reveal which property categories are attracting more investor demand.
Funding Completion Rate by Region: This chart compares completion rate by region. It helps identify markets where campaigns are filling quickly and regions that may need more investor outreach.
Funding
3 – Property
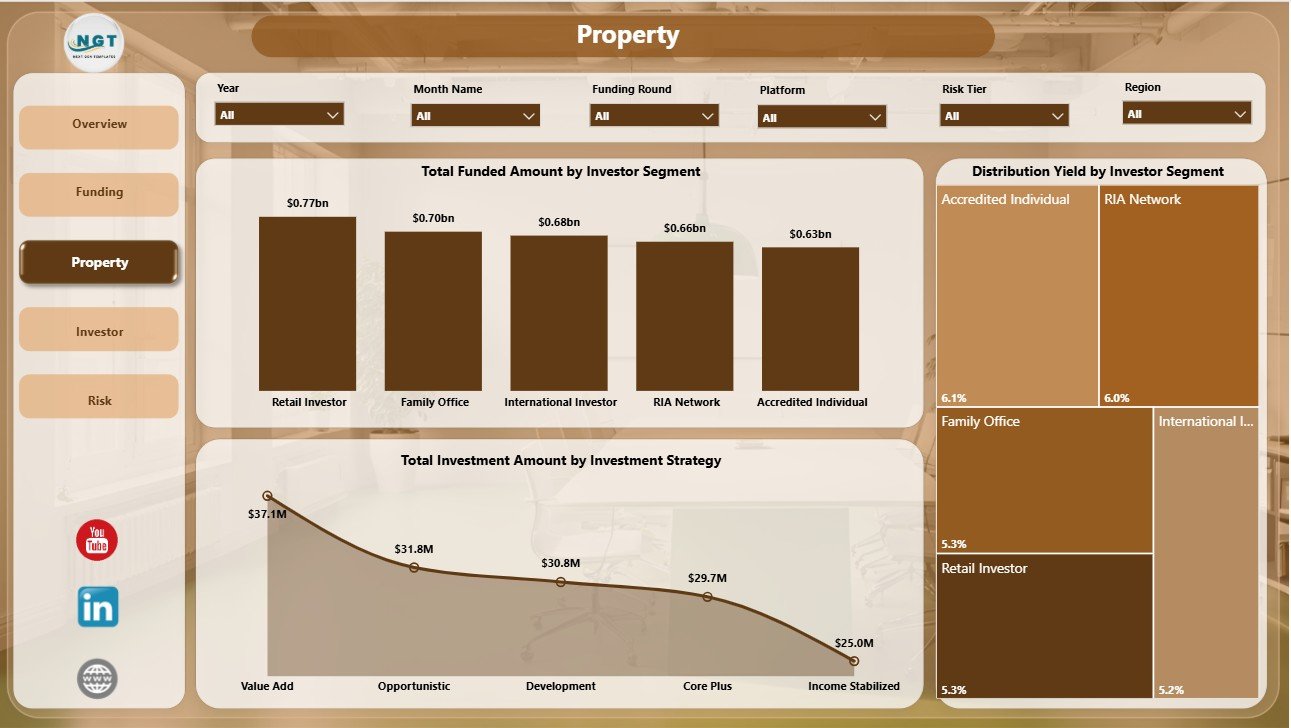
The Property page connects investor segment, investment strategy, and distribution yield analysis. It is useful for understanding how capital allocation and payout performance vary across the property-side portfolio.
Total Funded Amount by Investor Segment: This chart compares funded capital by investor segment. It helps separate activity from retail investors, accredited investors, institutions, or other investor groups.
Total Investment Amount by Investment Strategy: This chart shows investment amount by strategy. It helps compare core, value-add, opportunistic, income-focused, or other investment approaches.
Distribution Yield by Investor Segment: This chart compares yield by investor segment. It helps investor relations teams explain which investor groups are receiving stronger distribution performance.
Property
4 – Investor
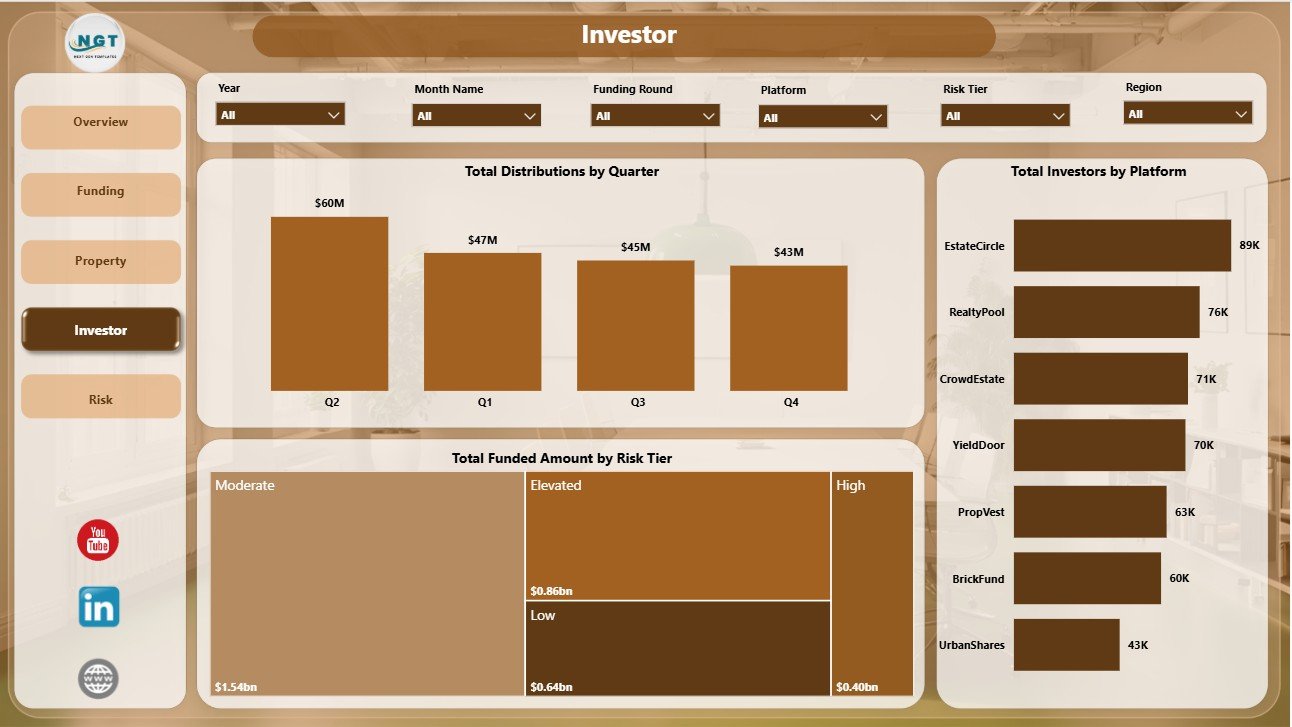
The Investor page focuses on payout timing, platform participation, and risk-tier exposure. This is especially useful for quarterly reviews and investor communication.
Total Distributions by Quarter: This chart tracks distributions across quarters. It helps users review payout timing and prepare quarterly income reporting.
Total Investors by Platform: This chart compares investor count by crowdfunding platform. It helps teams identify which platforms are building stronger investor reach.
Total Funded Amount by Risk Tier: This chart shows funded amount by risk tier. It helps analysts understand whether capital is concentrated in lower-risk or higher-risk opportunities.
Investor
5 – Risk
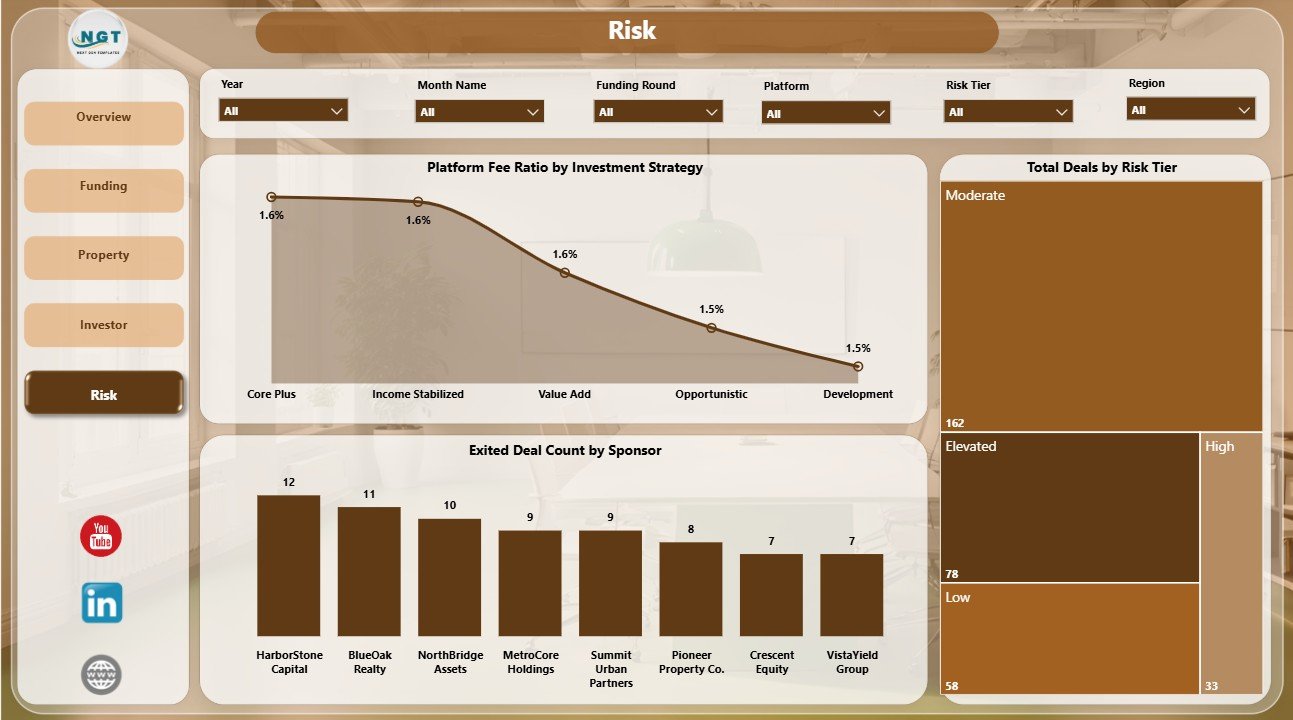
The Risk page brings together platform fee ratio, sponsor exit history, and risk-tier deal count. It helps investors and managers bring risk context into performance discussions.
Platform Fee Ratio by Investment Strategy: This chart compares fee ratio by strategy. It helps users see where fees may reduce net investor return.
Exited Deal Count by Sponsor: This chart compares exited deals by sponsor. It helps teams review sponsor activity and completed deal history.
Total Deals by Risk Tier: This chart counts deals by risk tier. It helps users understand portfolio risk mix and spot concentration in any one risk group.
Risk
Real Estate Crowdfunding Dashboard in Power BI vs. Tableau vs. Paid CRM/SaaS – Feature Comparison
| Feature | Real Estate Crowdfunding Dashboard in Power BI | Tableau or Qlik alternative | Paid real estate SaaS |
|---|---|---|---|
| Cost | $17.99 one-time sale price | BI license plus analyst build time | Monthly or annual subscription |
| Platform | Power BI Desktop and optional Power BI Service | Desktop or cloud BI platform | Vendor-hosted cloud system |
| Setup time | Open PBIX, replace data, refresh | Build model and visuals manually | Implementation and onboarding |
| Real-time team collaboration | Available after publishing to Power BI Service | Available by plan | Usually included |
| Mobile access | Available through Power BI mobile after publishing | Available through vendor app | Usually included |
| Customizable fields | Editable measures, visuals, pages, labels, and data connections | Editable with BI skills | Often limited by vendor settings |
| Share with link | Available through workspace permissions | Available through platform permissions | Usually login controlled |
| Year-1 cost at 5 users | Template cost plus Microsoft licensing choice | License cost plus build time | Can become hundreds or thousands per year |
| Crowdfunding reporting focus | Built around funding, targets, fees, distributions, investors, sponsors, platforms, and risk tiers | Must be built manually | Depends on selected modules |
Who Should Use This Template
This template is a good fit for real estate crowdfunding sponsors, fund managers, investment analysts, investor relations teams, platform operators, and consultants who need a repeatable Power BI report for deal and investor performance. It is especially useful when the team already has structured exports and wants a clean analytical layer.
It is not the right tool if you need investor portal logins, payment processing, compliance automation, CRM workflow, legal document management, or live API synchronization. Use operational systems as the source of truth and this dashboard as the reporting layer.
Real-World Use Cases
Amanda, investor relations manager, uses the Overview and Investor pages before quarterly updates to explain distributions, active deals, investor count, and risk-tier exposure.
Rohit, real estate sponsor, reviews the Funding page to compare completion rate by region and funded amount by funding round before planning investor outreach.
Meera, portfolio analyst, uses the Risk page to review fee ratios, exited deals by sponsor, and total deals by risk tier before portfolio review meetings.
Advantages of Real Estate Crowdfunding Dashboard in Power BI
- Interactive portfolio reporting across 5 focused Power BI pages.
- Better funding visibility by round, platform, property type, and region.
- Investor-focused analysis for distributions, segments, and platform participation.
- Risk review support through risk tier, sponsor, and platform fee visuals.
- Lower cost than commissioning a custom BI dashboard from scratch.
Opportunities for Improvement
Because this is a Power BI template, it does not automatically connect to every crowdfunding platform, investor portal, bank account, CRM, or accounting system. Users may need to prepare their data in the expected structure or customize the source connection. Large organizations may also want additional security roles, scheduled refresh, or governed workspaces in Power BI Service.
Best Practices
- Keep field names and data types consistent when replacing the sample source.
- Use one clean record structure for deals, investors, platforms, sponsors, and dates.
- Refresh the Power BI model after every source data update.
- Check slicer selections before presenting screenshots or exported PDFs.
- Keep a backup copy before changing DAX measures, relationships, or report pages.
Explore Relevant Templates
For a spreadsheet version, see the Real Estate Crowdfunding Dashboard in Excel. For broader real estate analysis, explore the Real Estate & Property Bundle. You may also like the Property Management Dashboard in Power BI and the Real Estate Investment Trusts (REITs) KPI Dashboard in Excel.
Frequently Asked Questions
What does the Real Estate Crowdfunding Dashboard in Power BI track?
It tracks target raise, platform fees, distributions, deals, active deal count, funded amount, investment amount, property type, platform, funding round, region, investor segment, investment strategy, risk tier, sponsor, and quarter.
How many Power BI pages are included?
The report includes 5 pages: Overview, Funding, Property, Investor, and Risk.
Can I use my own data?
Yes. Replace or connect the sample source with your own structured crowdfunding data and refresh the report in Power BI Desktop.
Do I need Power BI Pro?
No for local editing and analysis in Power BI Desktop. Power BI Pro may be needed if you want to publish and share the report through Power BI Service.
Can I customize the dashboard?
Yes. You can edit visuals, measures, pages, slicers, colors, labels, and source connections in Power BI Desktop.
Is this a full investor portal?
No. It is a reporting dashboard template, not a portal, payment processor, CRM, or compliance system.
About the Author
Built by PK – Microsoft Certified Professional with 15+ years of Excel, Google Sheets, and Power BI experience. Founder of NextGenTemplates, reaching 300K+ subscribers across YouTube channels. Every template is hand-built and tested before release.
Conclusion
The Real Estate Crowdfunding Dashboard in Power BI gives real estate sponsors, analysts, fund managers, and investor relations teams a cleaner way to review funding, distributions, fees, investors, sponsors, platforms, property types, and risk tiers. Instead of starting from a blank Power BI file, users get 5 ready pages that can be adapted to their own structured crowdfunding data.
Click here to purchase the Real Estate Crowdfunding Dashboard in Power BI and start analyzing crowdfunding performance in one interactive report.
For step-by-step Excel and Power BI tutorials, visit YouTube.com/@PKAnExcelExpert.
Last updated: August 1, 2026