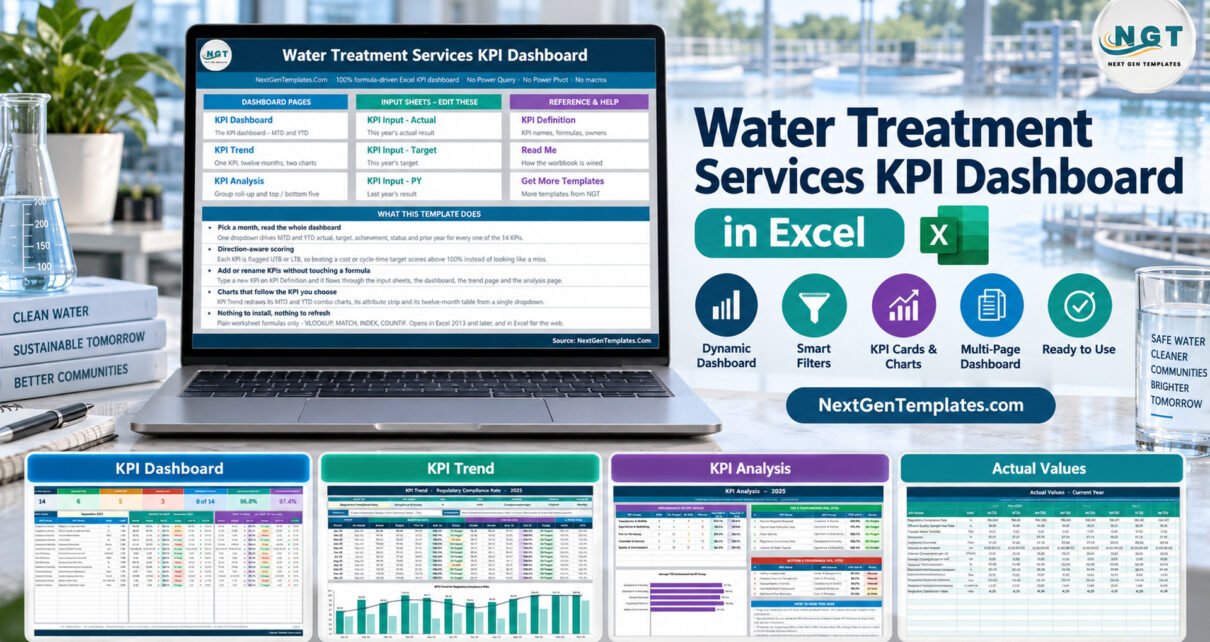
Water Treatment Services KPI Dashboard in Excel brings 14 defined water-treatment measures into one formula-driven workbook. Instead of reviewing compliance, laboratory, operations, maintenance, cost, safety, and service figures in separate files, a manager can compare month-to-date and year-to-date actuals, targets, achievement, status, and prior-year performance from one selected month. The workbook also includes KPI trend and KPI analysis pages, three monthly input sheets, an editable KPI master list, and a user manual. It is a management reporting template, not a replacement for regulatory, laboratory, engineering, SCADA, or maintenance systems.
This article explains exactly what the workbook contains, where it fits, and how teams can use it responsibly. The screenshots show sample values for demonstration; buyers replace those figures with their own verified data.
Key Features of Water Treatment Services KPI Dashboard in Excel
The template is built around the recurring monthly review cycle. Select a month and the dashboard presents MTD and YTD values for each KPI. Direction-aware calculations support both upper-the-better measures, such as compliance or uptime, and lower-the-better measures, such as turbidity, downtime, energy intensity, dosing cost, turnaround time, or incident rate. As a water treatment operations dashboard, it keeps the focus on management review rather than live process control.
- 14 KPI definitions covering quality, reliability, efficiency, safety, and customer service.
- MTD and YTD comparisons for actual, target, prior-year, achievement, and status.
- Traffic-light exceptions using On Target, At Risk, and Missed classifications.
- Trend analysis for one selected KPI across twelve months.
- Group and rank analysis with KPI-group achievement plus top-five and bottom-five results.
- Editable KPI master list for names, units, formulas, definitions, types, owners, priorities, and frequency.
- No macros, Power Query, or Power Pivot; the design uses ordinary worksheet formulas.
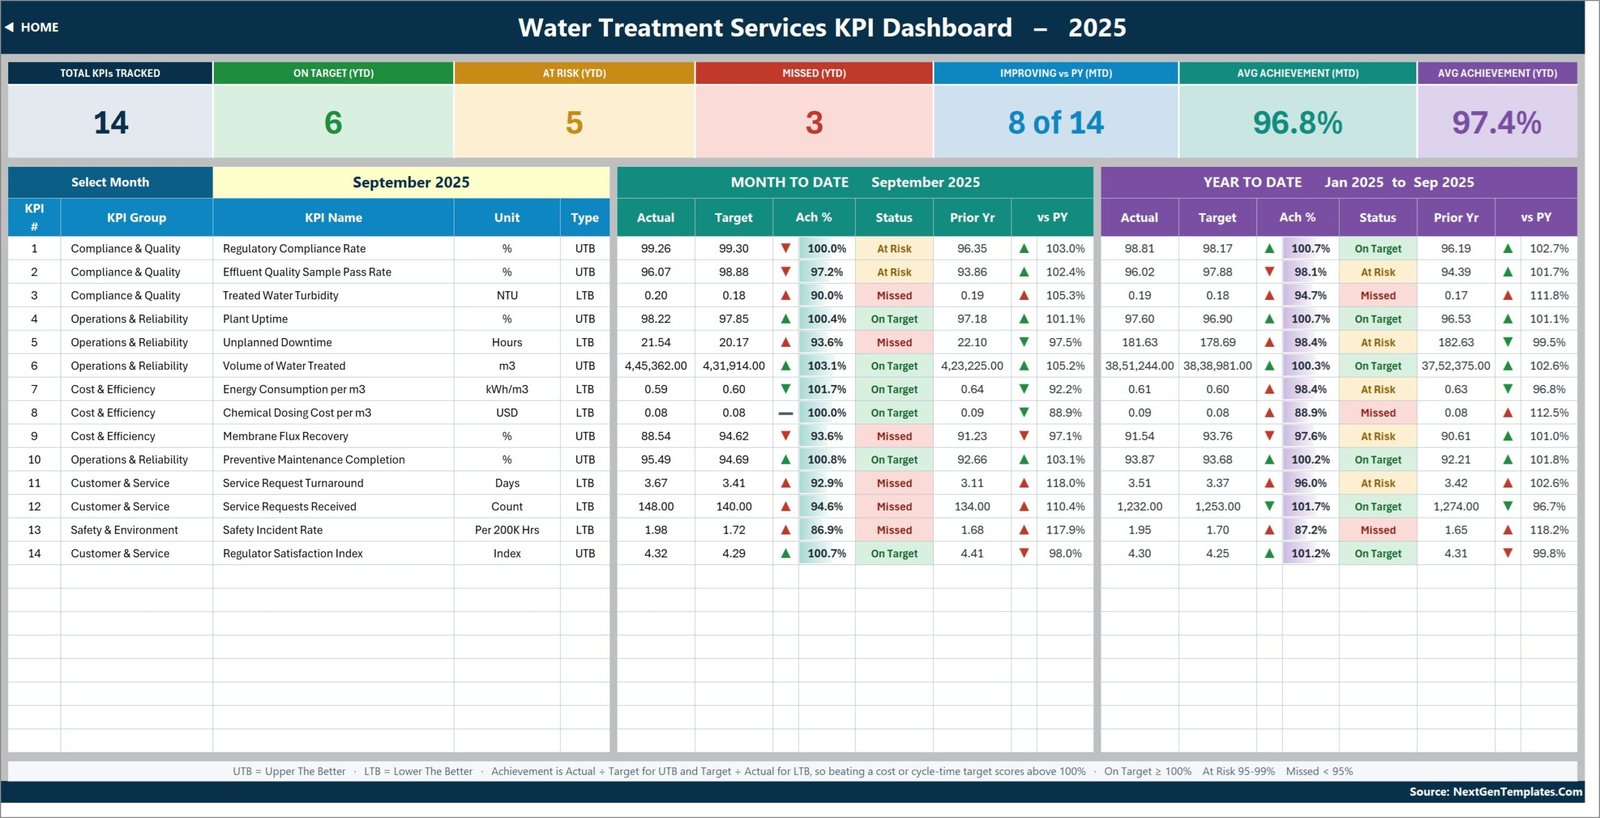
The main dashboard shows sample MTD and YTD results for the selected month.
Dashboard Pages Explanation
Home and navigation
The Home page explains what the template does and links to the KPI Dashboard, KPI Trend, KPI Analysis, three input sheets, KPI Definition, Read Me, and additional template resources. It also states the operating model clearly: choose a reporting month, review MTD and YTD results, and update source figures through the input sheets.
KPI Dashboard
The main page tracks Regulatory Compliance Rate, Effluent Quality Sample Pass Rate, Treated Water Turbidity, Plant Uptime, Unplanned Downtime, Volume of Water Treated, Energy Consumption per m3, Chemical Dosing Cost per m3, Membrane Flux Recovery, Preventive Maintenance Completion, Service Request Turnaround, Service Requests Received, Safety Incident Rate, and Regulator Satisfaction Index.
Summary cards count total KPIs, On Target, At Risk, and Missed results, improving measures, and average MTD/YTD achievement. This makes the Excel KPI dashboard for water treatment useful as a compact management-review page without hiding the underlying KPI rows.
KPI Trend
Select one KPI to review its monthly values in a twelve-month table and two charts. The page carries the KPI group, unit, type, formula, definition, owner, priority, and frequency so the chart is interpreted with the correct business context.
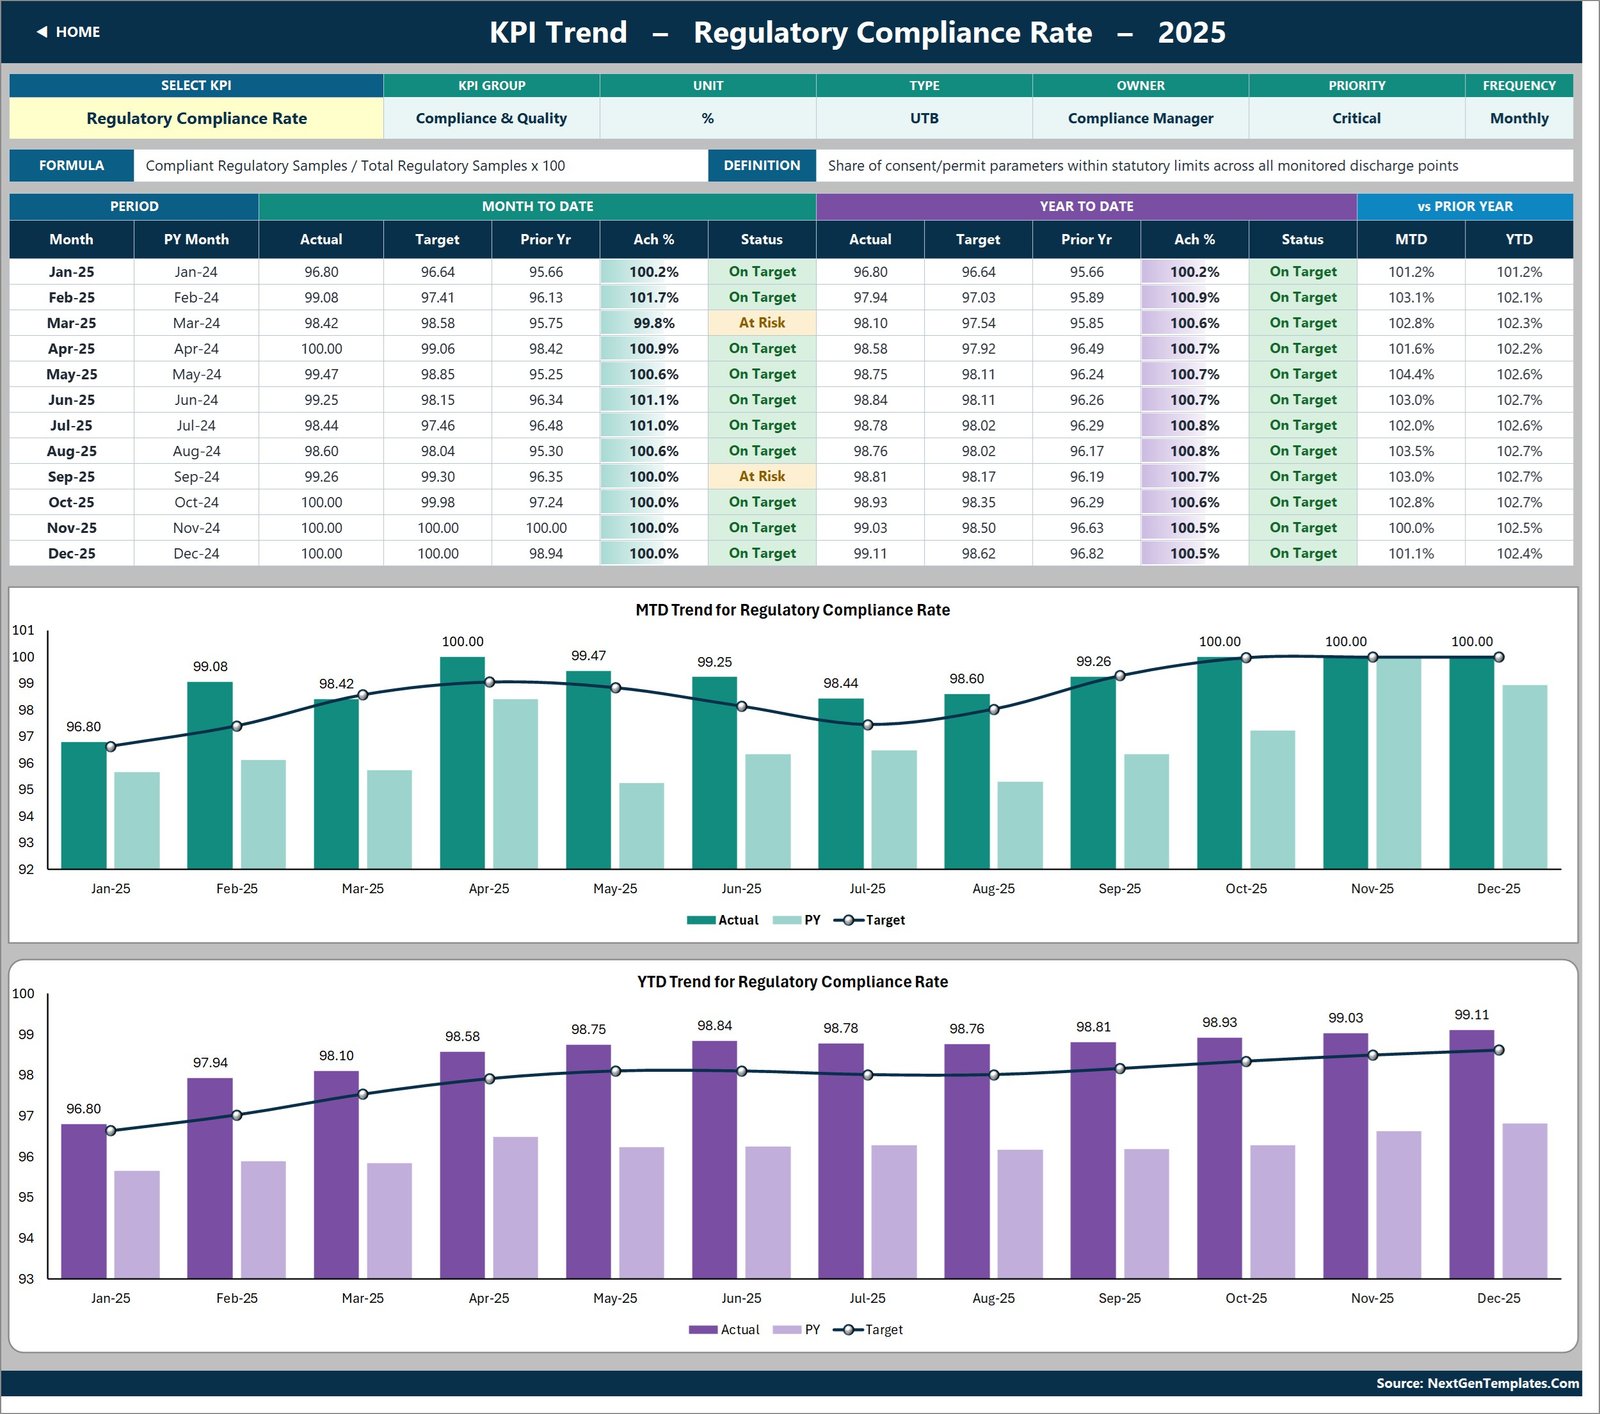
KPI Trend combines the selected measure’s definition, monthly table, and charts.
KPI Analysis
The analysis page rolls achievement up by KPI group, then lists the top five and bottom five YTD results. This supports focused discussion: leaders can see whether quality, reliability, efficiency, service, or safety is creating the largest performance gap before opening detailed source records.
Input and definition sheets
Three input pages hold current-year actuals, current-year targets, and prior-year values by month. The KPI Definition sheet stores the names, groups, units, formulas, definitions, UTB/LTB direction, owners, priorities, and reporting frequency. A Read Me page documents the workflow and scoring logic.
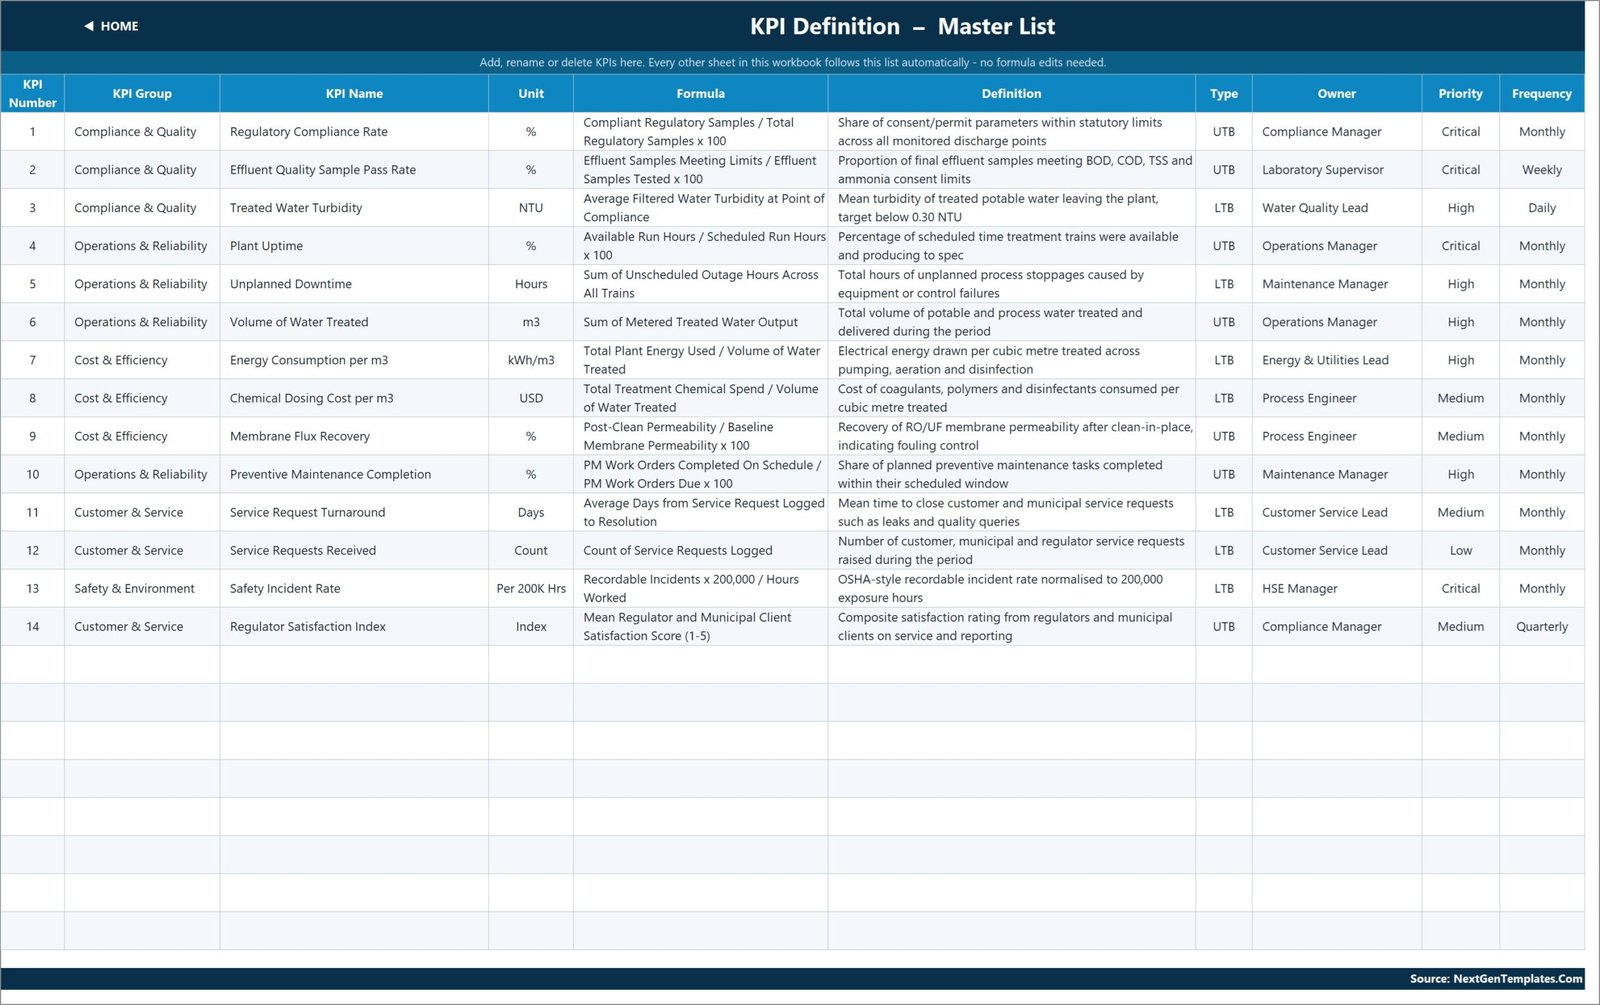
The editable KPI Definition sheet is the workbook’s master list.
Water Treatment Services KPI Dashboard in Excel vs. Google Sheets vs. Paid CMMS/SaaS – Feature Comparison
| Factor | Excel template | Google Sheets alternative | Paid CMMS/SaaS |
|---|---|---|---|
| Commercial model | One-time template purchase | Template or setup cost | Usually recurring subscription |
| Platform | Microsoft Excel | Web browser | Vendor application |
| Setup time | Replace sample monthly values | Copy and configure a sheet | Implementation may be required |
| Team collaboration | Shared through your Microsoft environment | Native simultaneous editing | Usually role-based access |
| Mobile access | Depends on Excel environment | Browser/app access | Often included |
| Custom fields | Editable KPI master list | Editable sheet structure | Depends on plan |
| Water-treatment setup | 14 included KPIs | Depends on template | May need configuration |
| Live integration | Not included | Not included by default | May support integrations |
Who Should Use This Template
This water treatment KPI template suits plant managers, compliance managers, laboratory supervisors, operations managers, maintenance teams, process engineers, energy and utilities leads, HSE managers, customer-service managers, and contract water-service teams. It works best where reliable monthly source data already exists and leadership needs a consistent review format.
It is not designed for live process control, sample custody, permit submissions, maintenance work orders, customer billing, incident case management, or telemetry. Teams should continue using approved source systems and procedures for those controlled activities.
Real-World Use Cases
Monthly plant performance review
An operations manager can review uptime, downtime, treated volume, energy intensity, chemical cost, and maintenance completion before assigning follow-up actions. The dashboard points to exceptions; it does not diagnose equipment faults.
Compliance and quality meeting
A compliance lead can present regulatory compliance, sample pass rate, turbidity, and regulator satisfaction alongside definitions and owners, while retaining laboratory evidence in the approved LIMS or records system.
Client or municipal service review
A contract manager can use water treatment performance tracking to prepare a structured discussion covering service turnaround, request volume, safety, cost, reliability, and quality trends without mixing operational source records into the presentation file.
Advantages of Water Treatment Services KPI Dashboard in Excel
The strongest advantage is consistency. Every KPI carries a group, unit, formula, definition, direction, owner, priority, and frequency. The same selected-month logic then flows through the dashboard, trend, and analysis pages. Because the workbook is formula-driven, it can fit teams that prefer Excel and do not need a database-backed reporting project.
The template also separates editable inputs from reporting pages. That reduces the temptation to overwrite formulas during routine updates. The manual and Read Me page provide a practical starting point for administrators taking over the file.
Opportunities for Improvement
The workbook does not import data automatically, apply user permissions, keep an audit log, issue alerts, or validate laboratory methods. Those needs require separate systems or a tailored solution. Users may also want to adapt the included KPIs to local permits, treatment processes, reporting periods, units, and organisational responsibilities.
Any modification should be tested on a copy. A KPI name or definition can be edited through the master list, but users remain responsible for checking formulas, units, thresholds, and source-data quality.
Best Practices
- Keep an untouched master copy of the download.
- Document the source and owner for each KPI.
- Align targets with approved operating plans and regulatory requirements.
- Enter actual, target, and prior-year values on the designated input sheets only.
- Review lower-the-better and upper-the-better types before interpreting achievement.
- Reconcile dashboard figures to approved source records each month.
- Use KPI Trend and KPI Analysis to guide questions, then investigate in the source systems.
- Control file access and retention according to your organisation’s policies.
For general spreadsheet guidance, see Microsoft Excel help and learning.
Explore Relevant Templates
On this site, you can also read about the Water Desalination KPI Dashboard in Excel, Sewage Treatment KPI Dashboard in Excel, and Water Resource Management KPI Dashboard in Excel. Each serves a different reporting scope, so compare the KPI definitions before choosing.
Frequently Asked Questions
Does this dashboard require macros?
No. It uses worksheet formulas and does not require VBA, Power Query, or Power Pivot.
How many KPIs are included?
The workbook includes 14 KPIs across compliance, quality, operations, reliability, cost, efficiency, safety, environment, customer, and service topics.
Can the KPI list be changed?
Yes. The KPI Definition page is designed for editing names, groups, units, formulas, definitions, types, owners, priorities, and frequencies. Test structural changes on a copy.
Does it connect to SCADA, LIMS, or CMMS software?
No. Users enter or paste monthly actual, target, and prior-year figures into the input sheets.
Does the template prove regulatory compliance?
No. It summarises user-provided figures for management reporting. Regulatory determinations must come from approved procedures, evidence, and competent personnel.
What is included in the download?
The customer ZIP includes the Excel workbook and the Excel KPI Dashboard user manual.
Can I use it for wastewater and potable-water operations?
The supplied KPI list includes measures relevant to both contexts, but the buyer must adapt terminology, units, limits, and definitions to the actual treatment process.
About the Author
Built by PK – Microsoft Certified Professional with 15+ years of Excel, Google Sheets, and Power BI experience. Founder of NextGenTemplates, reaching 300K+ subscribers across YouTube channels. Every template is hand-built and tested before release.
Conclusion
The Water Treatment Services KPI Dashboard in Excel is a focused option for teams that already have reliable monthly data and need a repeatable way to review 14 operational KPIs. Its main dashboard, KPI Trend, KPI Analysis, three input sheets, and editable definition list help turn disconnected figures into a structured management conversation.
Download the Water Treatment Services KPI Dashboard in Excel from NextGenTemplates and replace the sample values with your verified monthly data. For more Excel dashboard tutorials, visit PK-AnExcelExpert on YouTube.