Bathroom remodeling teams often watch several moving parts at once: quote conversion, project cycle time, inspection pass rate, rework, waterproofing defects, margin, and customer satisfaction. A Bathroom Remodeling KPI Dashboard in Excel brings those monthly numbers into one review workbook so owners and operations managers can see which parts of the remodeling process are improving and which need attention.
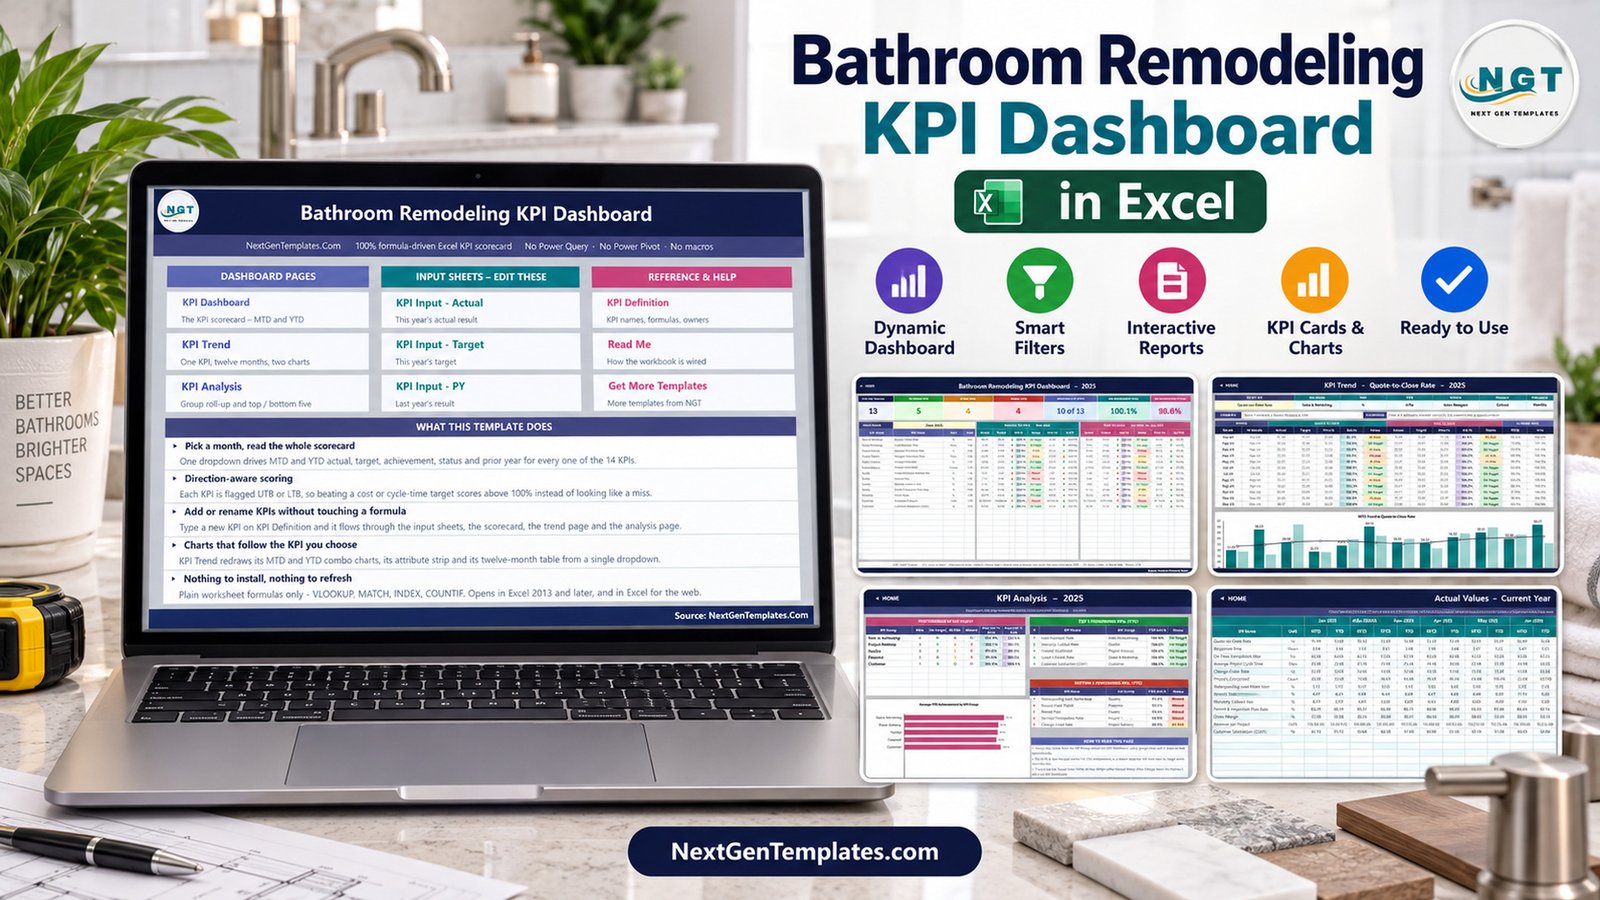
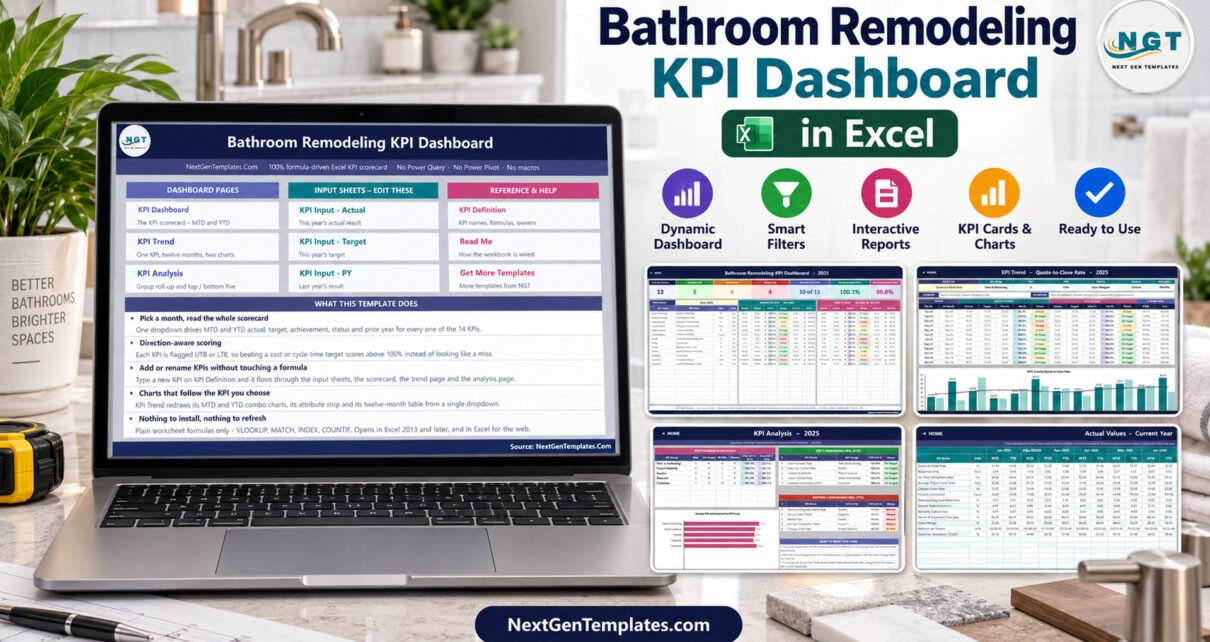
This template is built for practical monthly reporting. It includes a KPI dashboard, KPI trend page, KPI analysis page, three input sheets for actuals, targets and prior-year values, plus KPI definitions and read-me guidance. It is not a CRM or scheduling app. It is an Excel KPI dashboard for summarizing the performance numbers a bathroom remodeler already tracks.
Key Features of Bathroom Remodeling KPI Dashboard in Excel
The dashboard tracks 14 KPIs across sales and marketing, project delivery, quality, financial, and customer groups. The visible KPI list includes Quote-to-Close Rate, Lead Response Time, On-Time Completion Rate, Average Project Value, Change Order Rate, Project Completed, Waterproofing Leak Defect Rate, Rework Rate, Permit Inspection Pass Rate, Gross Margin, Revenue per Project, and Customer Satisfaction.
Each KPI has current month actual, target, achievement, status, prior-year comparison, and year-to-date scoring. The workbook also supports direction-aware scoring, which matters for bathroom remodeling metrics. A lower lead response time or defect rate should score well when it improves, while higher gross margin or satisfaction should score well when it rises.
The template uses normal Excel formulas. It does not depend on macros, Power Query, or Power Pivot, so teams can open the workbook, replace the sample values, and start reviewing monthly performance quickly. For general Excel formula support, Microsoft also maintains helpful guidance in Microsoft Excel Help and Learning.
Dashboard Pages Explanation
Home and Read Me
The first page explains the workbook flow: dashboard pages, editable input sheets, and reference sheets. It also makes the workflow clear: pick a month, review the scorecard, analyze trends, update inputs, and adjust KPI definitions where needed.
KPI Dashboard
The KPI Dashboard page is the main management view. It lists each KPI by group and shows monthly and year-to-date actuals, targets, achievement percentages, statuses, and prior-year values. This is the page to use in a monthly operations meeting when the team needs a quick health check.
KPI Trend
The KPI Trend page focuses on one selected KPI across twelve months. It includes monthly values and charts for MTD and YTD performance. A bathroom remodeling business can use this page to see whether close rate, project value, rework, or customer satisfaction is moving in the right direction.
KPI Analysis
The KPI Analysis page summarizes performance by KPI group and highlights top and bottom performing KPIs for the year. This is useful when the dashboard shows mixed results and the manager wants to know whether the issue sits in sales, project delivery, quality, financial performance, or customer experience.
Input and Definition Sheets
The three input sheets hold current-year actuals, current-year targets, and prior-year values. The KPI Definition page stores KPI names, descriptions, groups, owners, units, type, priority, and frequency. That structure makes it easier to adapt the template to your own bathroom remodeling process without rewriting formulas.
Bathroom Remodeling KPI Dashboard in Excel vs. Google Sheets vs. Paid CRM/SaaS – Feature Comparison
| Feature | This Excel template | Google Sheets alternative | Paid SaaS alternative |
|---|---|---|---|
| Cost | One-time Excel template | Low cost if Google Workspace is already used | Monthly or annual subscription |
| Setup time | Replace sample KPI values and targets | Similar setup, stronger sharing | Longer account and workflow setup |
| Collaboration | Best for controlled workbook review | Best for multi-user browser editing | Best for role-based operational workflows |
| Customization | Edit KPI definitions, groups, targets, and owners | Flexible but dependent on Drive permissions | Depends on plan and admin access |
| Best fit | Monthly bathroom remodeling KPI reporting | Shared cloud KPI entry | CRM, estimating, dispatch, and job management |
Who Should Use This Template
This Excel remodeling KPI dashboard is useful for bathroom remodeling company owners, operations managers, project coordinators, quality leads, and sales managers. It fits teams that already have monthly numbers but want a cleaner reporting rhythm.
It is not intended to replace estimating software, construction accounting software, CRM pipelines, or field scheduling systems. Think of it as the monthly KPI review layer that sits above your operational systems.
Real-World Use Cases
Sales review: A remodeling owner can compare quote-to-close rate, lead response time, and average project value before changing advertising spend or sales follow-up rules.
Project delivery review: An operations manager can track on-time completion, change orders, completed projects, and average project value to spot capacity or planning issues.
Quality review: A quality lead can watch waterproofing leak defect rate, rework rate, permit inspection pass rate, and customer satisfaction before small issues become reputation problems.
Advantages of Bathroom Remodeling KPI Dashboard in Excel
The biggest advantage is focus. Instead of scrolling through raw job lists, the user sees a KPI scorecard built around remodeling performance. The trend page adds month-by-month context, while the analysis page groups performance so the team can discuss root causes.
The second advantage is control. Because it is an Excel workbook, a manager can keep the file internally, adjust definitions, and use it offline. For small and mid-sized bathroom remodeling firms, that can be a better fit than adopting a complex platform before the KPI process is mature.
Opportunities for Improvement
This template does not automatically connect to CRMs, accounting apps, or project management systems. Users need to enter or paste the monthly KPI results. It also does not handle job-level scheduling, crew assignments, invoice collection, or customer communication.
If your team needs live multi-user entry, mobile field updates, or automated system integrations, a cloud solution may be a better operational tool. This workbook is strongest as a structured monthly management dashboard.
Best Practices
- Keep KPI definitions stable for at least one quarter so trends remain meaningful.
- Separate lower-is-better KPIs from higher-is-better KPIs before reviewing achievement scores.
- Use one owner per KPI so follow-up is clear.
- Update actuals, targets, and prior-year values before the monthly meeting.
- Use KPI Analysis to pick the top two improvement priorities rather than chasing every metric at once.
Explore Relevant Templates
You can pair this workbook with related NextGenTemplates products such as the Home Renovation Contractor KPI Dashboard in Excel, Kitchen Remodeling KPI Dashboard in Excel, Security System Installation KPI Dashboard in Excel, and Bathroom Remodeling KPI Scorecard in Excel. Browse more Excel KPI templates in the Excel KPI Dashboard category.
Frequently Asked Questions
What is included in the Bathroom Remodeling KPI Dashboard in Excel?
The workbook includes dashboard, trend, analysis, actual input, target input, prior-year input, KPI definition, read-me, and related-template pages.
Does the template use macros?
No. It is formula-driven and does not require macros, Power Query, or Power Pivot.
Can I change the KPI names?
Yes. KPI names, groups, units, owners, definitions, and targets can be adjusted in the workbook.
Is this for Excel or Google Sheets?
This product is the Excel KPI Dashboard edition. Related scorecard or Google Sheets products are separate templates.
Can this replace a CRM?
No. It summarizes KPI performance. It does not manage leads, appointments, estimates, contracts, or customer messages.
About the Author
Built by PK – Microsoft Certified Professional with 15+ years of Excel, Google Sheets, and Power BI experience. Founder of NextGenTemplates, reaching 300K+ subscribers across YouTube channels. Every template is hand-built and tested before release.
For more Excel reporting ideas, explore our Excel dashboard tutorials. This remodeling KPI workbook fits best when a remodeling business wants a clear scorecard before moving into heavier systems.
Conclusion
This Excel KPI dashboard for bathroom remodelers is a focused way to review remodeling sales, delivery, quality, financial, and customer KPIs without building a scorecard from scratch. It gives bathroom remodelers a practical monthly dashboard, clear trend views, and editable KPI definitions in a familiar Excel format.
For more tutorials, visit PK: An Excel Expert on YouTube.