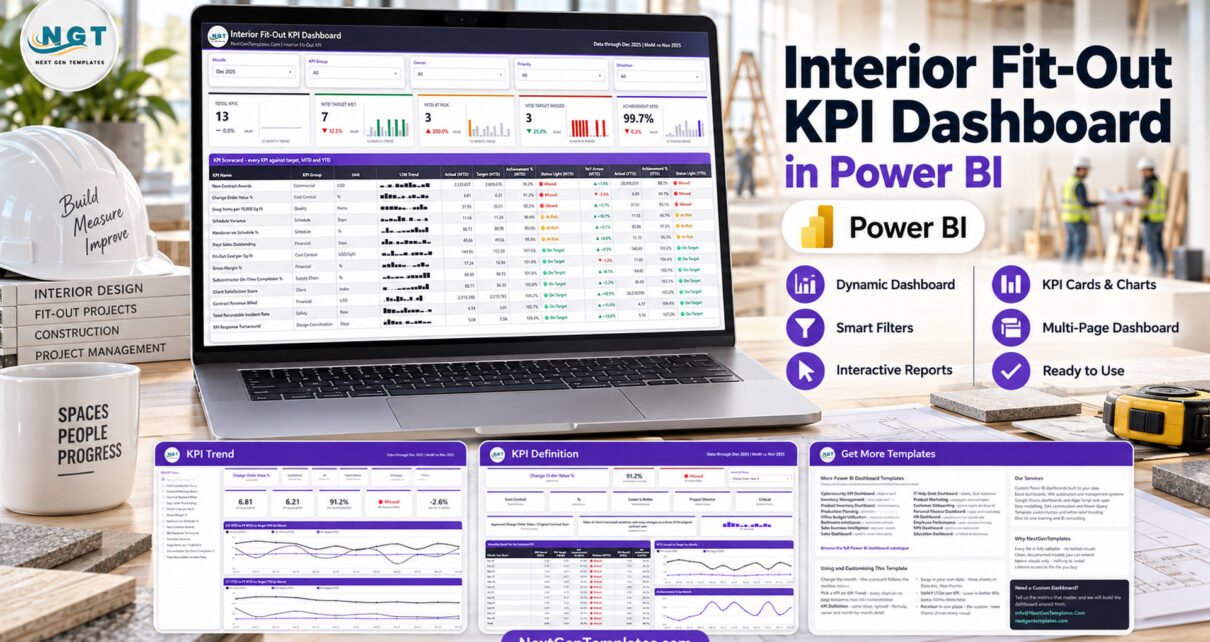
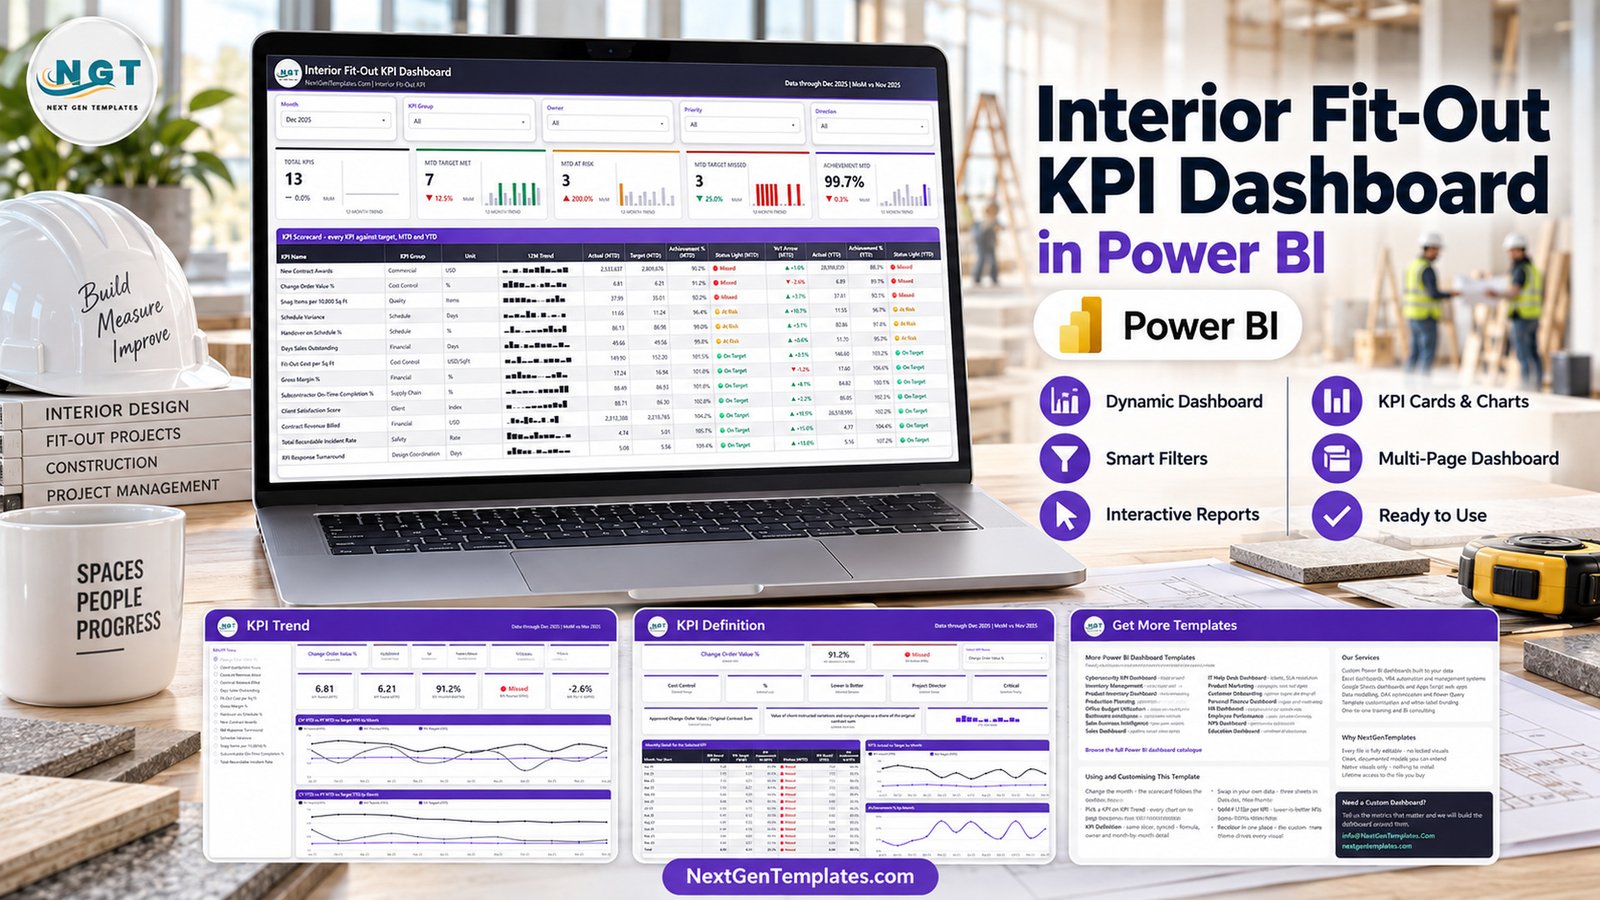
The Interior Fit-Out KPI Dashboard in Power BI scores 13 fit-out KPIs across 9 KPI groups on 4 report pages. Every KPI is measured against a monthly target, with MTD and YTD achievement, a red, amber or green status light, and a year-over-year arrow. The download includes 24 months of fictional sample actuals and 12 months of targets, so the report works as soon as you open it.
Fit-out contractors juggle margin, change orders, handover dates, snag lists, subcontractor packages and site safety at the same time, usually across several spreadsheets. When the monthly review arrives, nobody can say in one glance which numbers are on target and which are slipping. This template turns those numbers into one month-picker scorecard, and it belongs to our Power BI KPI Dashboard family rather than the analytical dashboard line.
Key Features of the Interior Fit-Out KPI Dashboard in Power BI
- 13 KPIs built for fit-out work: Contract Revenue Billed, Gross Margin %, New Contract Awards, Fit-Out Cost per Sq Ft, Change Order Value %, Schedule Variance, Handover on Schedule %, RFI Response Turnaround, Subcontractor On-Time Completion %, Snag Items per 10,000 Sq Ft, Total Recordable Incident Rate, Days Sales Outstanding and Client Satisfaction Score.
- Direction-aware achievement: six KPIs are higher-is-better and seven are lower-is-better. Lower-is-better KPIs score Target divided by Actual, so coming in under a cost or cycle-time target scores above 100%.
- Clear status thresholds: On Target is 100% or more, At Risk is 95% to 100%, and Missed is below 95%, for both MTD and YTD.
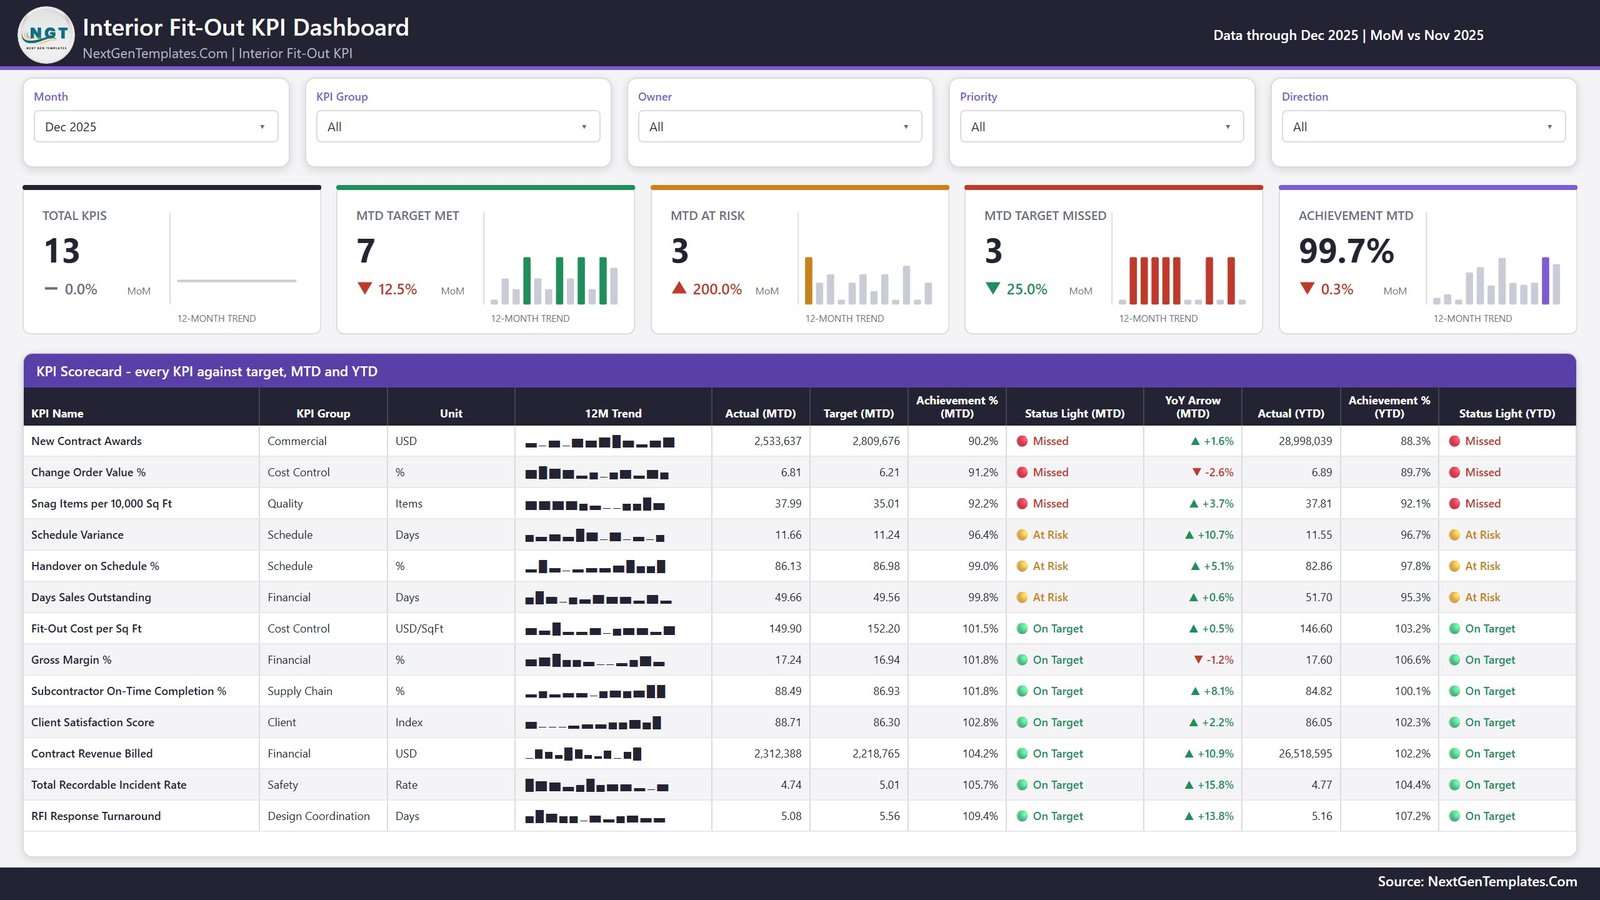
- Five slicers: Month, KPI Group, Owner, Priority and Direction on the scorecard page.
- Trend context everywhere: a 12-month sparkline on every KPI row and inside the five header cards.
- Year-over-year comparison: the YoY Arrow (MTD) flips for lower-is-better KPIs, so an up-arrow always means an improvement on the same month last year.
- Owner and priority for each KPI: ten named owners, from Commercial Director to HSE Manager, and three priority levels (Critical, High and Medium).
Three statements summarise the design. First, every cross-KPI number is either an achievement % or a count of KPIs, because the KPIs use different units. Second, absolute values only appear per KPI, where they mean something. Third, nothing in the report is hard-coded to a KPI name, so you can rename, add or delete KPIs in Data.xlsx and refresh.
Dashboard Pages Explanation
The report has four visible pages and two hidden tooltip pages, KPI Detail and Trend Detail, which appear only when you hover over a visual. All of them read from three sheets in Data.xlsx: KPI Definition, Input_ Target and Input_ Actual.
Page 1: KPI Scorecard
The scorecard opens with five cards: Total KPIs, MTD Target Met, MTD At Risk, MTD Target Missed and Achievement MTD, each with a month-over-month change and a 12-month trend. Below them, one table lists all 13 KPIs with KPI Group, Unit, 12M Trend, Actual (MTD), Target (MTD), Achievement % (MTD), Status Light (MTD), YoY Arrow (MTD), Actual (YTD), Achievement % (YTD) and Status Light (YTD). With December 2025 selected, the sample shows 7 KPIs on target, 3 at risk and 3 missed, with 99.7% average MTD achievement.
Page 2: KPI Trend
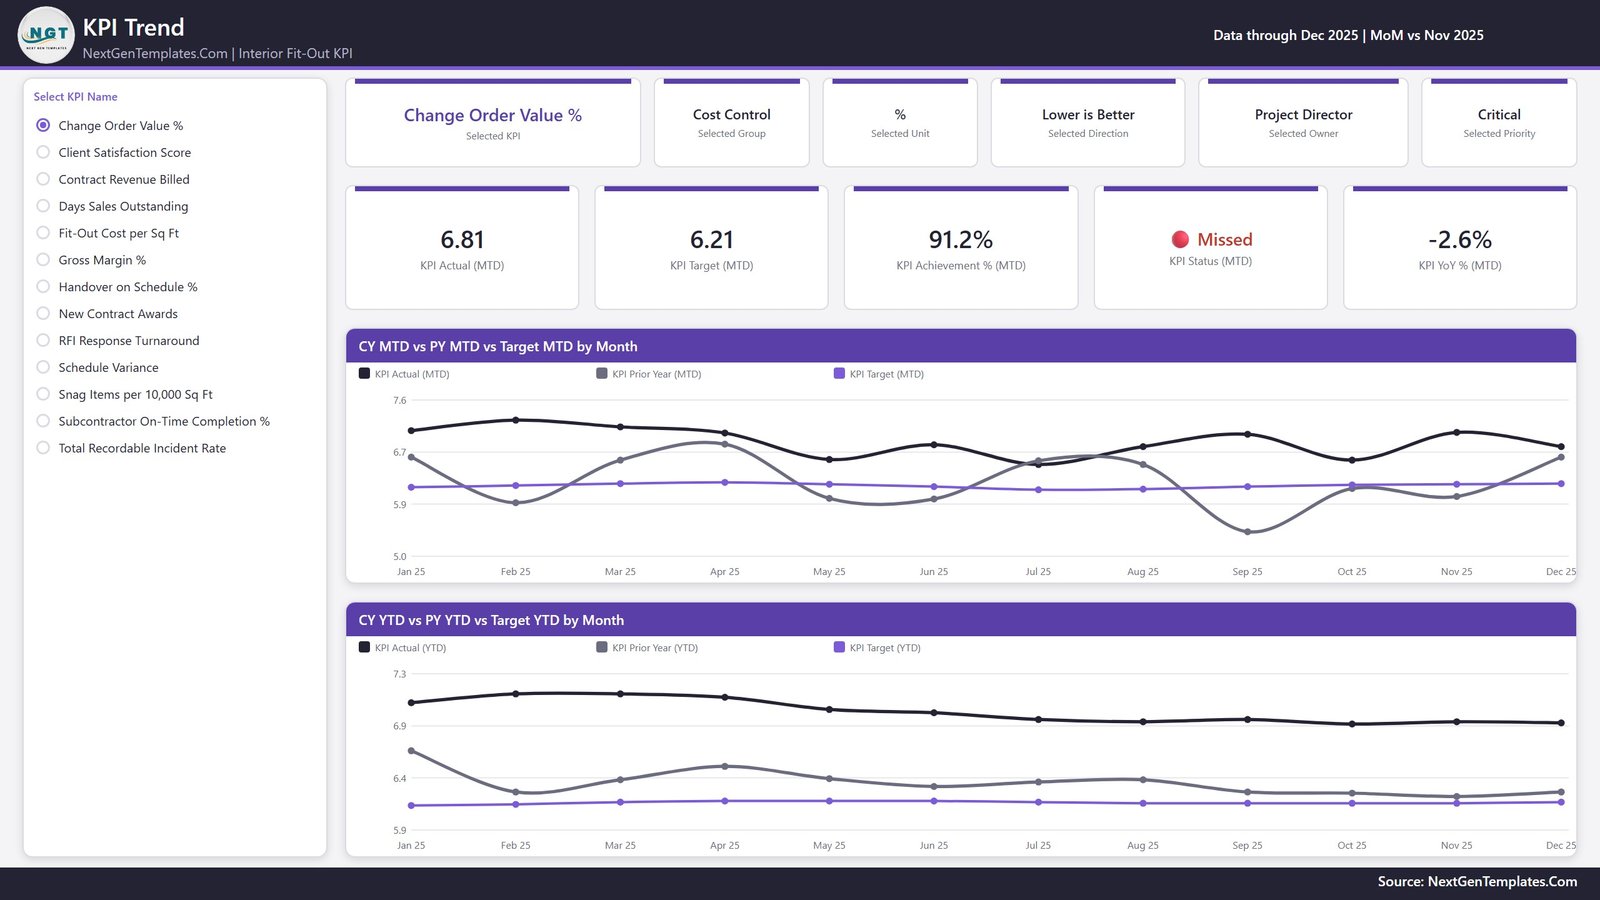
A list of all 13 KPIs sits on the left. Selecting one fills six context cards (KPI, Group, Unit, Direction, Owner and Priority) and five value cards (KPI Actual, KPI Target, KPI Achievement % and KPI Status for MTD, plus KPI YoY %). Two charts follow: CY MTD vs PY MTD vs Target MTD by Month and CY YTD vs PY YTD vs Target YTD by Month.
Page 3: KPI Definition
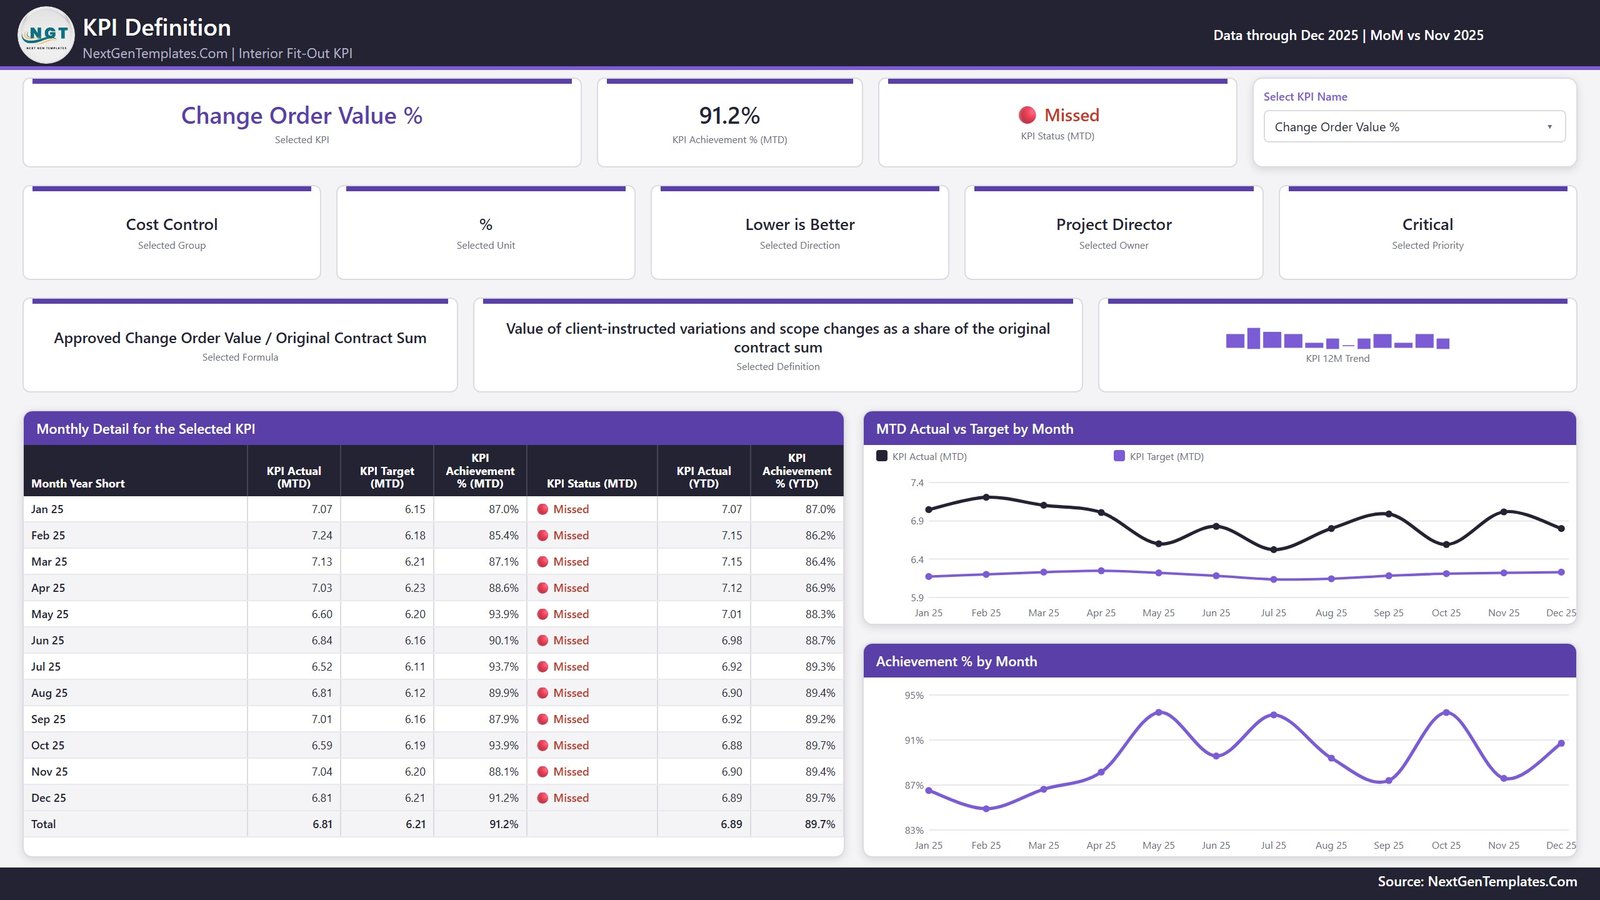
This page explains one KPI at a time. It shows the selected formula (for example, Approved Change Order Value / Original Contract Sum), a plain-language definition, a KPI 12M Trend, and a Monthly Detail table with Actual, Target, Achievement % and Status for MTD plus Actual and Achievement % for YTD. Two charts complete it: MTD Actual vs Target by Month and Achievement % by Month.
Page 4: Get More Templates
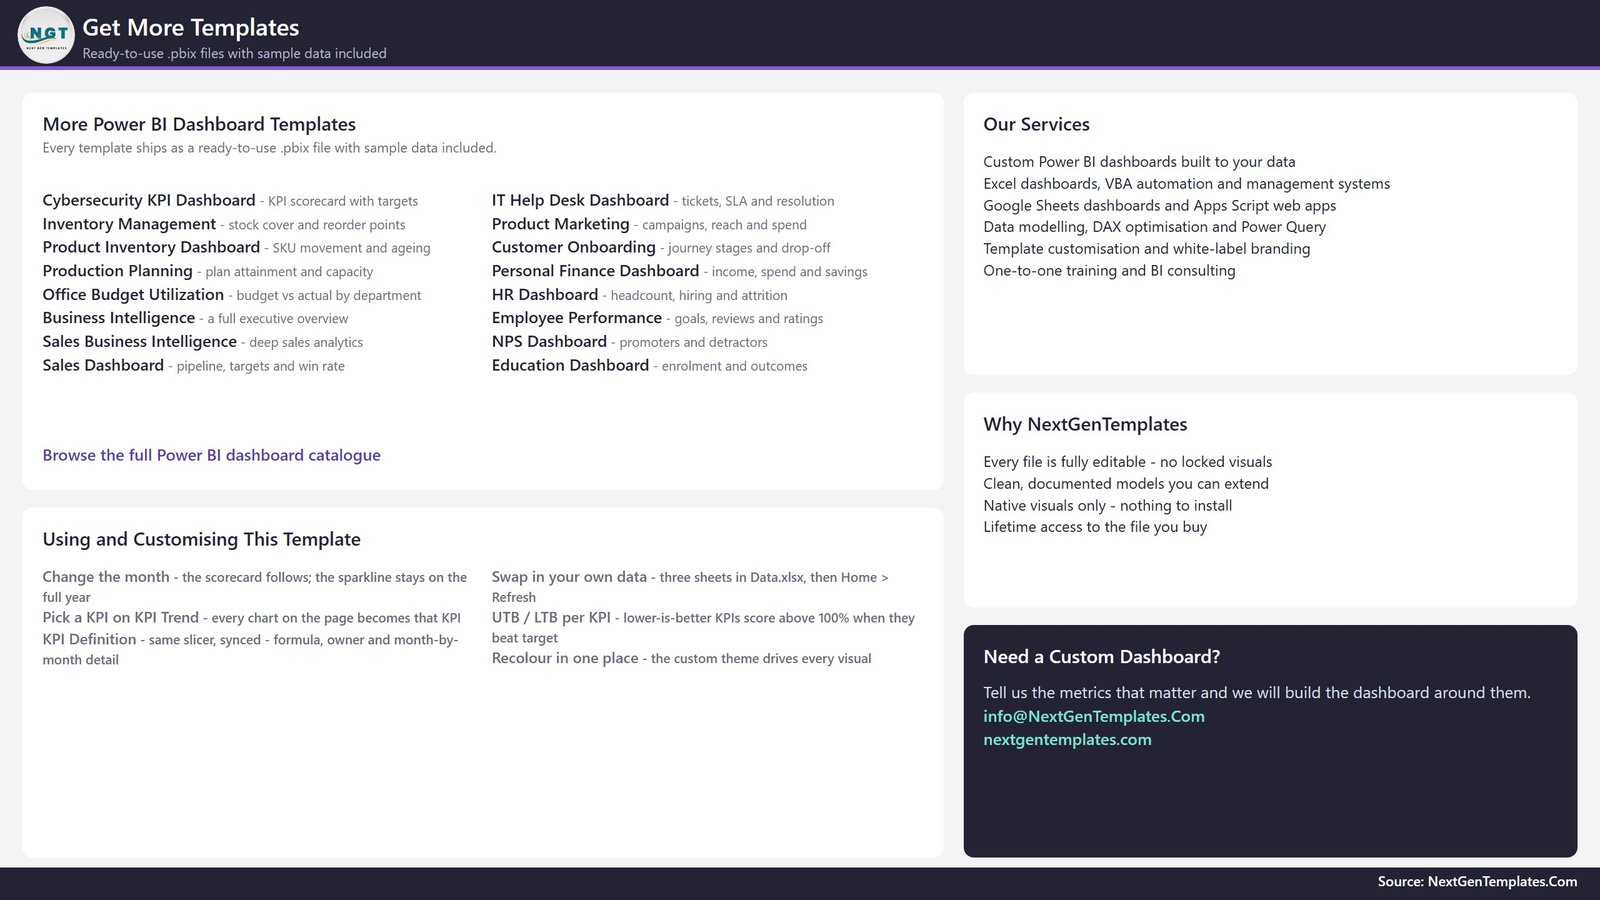
The final page holds short customisation notes, including how to change the month, swap in your own data and recolour the report through one theme, plus links to more Power BI templates.
Power BI Fit-Out Template vs. Tableau / Qlik vs. Construction SaaS: Feature Comparison
| Feature | This Power BI fit-out template | Tableau / Qlik alternative | Construction SaaS platform |
|---|---|---|---|
| Cost | ✅ $12.99 one-time | Per-user authoring licences | Recurring subscription, usually per user or per project |
| Platform | ✅ Power BI Desktop (free, Windows) | Tableau Desktop or Qlik Sense | Vendor web app |
| Setup time | ✅ Open, keep Data.xlsx beside it, refresh | Build KPIs and status logic from scratch | Onboarding and configuration |
| Fit-out KPIs ready to use | ✅ 13, with formulas and definitions | ❌ Blank canvas | Depends on the modules bought |
| Direction-aware status lights | ✅ Built in | Build calculated fields yourself | Varies by vendor |
| Prior-year comparison | ✅ CY vs PY vs Target charts | Build it yourself | Varies by vendor |
| Customisable KPI list | ✅ Edit rows in Data.xlsx | ✅ Fully flexible | Limited to vendor fields |
| Real-time team collaboration | Needs a Power BI licence to publish online | Needs a server or cloud licence | ✅ Built in |
| Year-1 cost at 5 users | ✅ $12.99 for the template file | Five annual licences | Five seats of subscription |
For fit-out teams that want a monthly KPI pack with honest traffic lights without adding another subscription, this Power BI template sits in the sweet spot.
Who Should Use This Template
Perfect for:
- Interior fit-out and refurbishment contractors that report monthly performance to directors
- Project directors and commercial managers on office, retail and hospitality fit-outs
- PMO analysts and consultants building a KPI pack for a fit-out client
- Power BI users who want a working example of direction-aware KPI scoring
Not a fit if:
- You need a scheduling, cost ledger or snag-logging system. This template scores monthly KPI values you enter; it does not capture site records.
- You only use a Mac, because Power BI Desktop runs on Windows.
- You need building-code, fire-rating, licensing or certification tracking, which the template does not provide.
Real-World Use Cases
A commercial director at an office fit-out contractor filters the scorecard to Critical priority before the monthly board meeting. Gross Margin %, Change Order Value % and Total Recordable Incident Rate appear with their status lights, so the discussion starts with the two red rows instead of a stack of spreadsheets.
A project director running retail roll-outs opens Schedule Variance on the KPI Trend page. The CY vs PY vs Target chart shows handovers later than target but earlier than last year, and the Monthly Detail table on KPI Definition pinpoints the months that slipped.
A PMO analyst supporting a hospitality refurbishment programme replaces the sample rows with the client’s figures, renames two KPIs to match the contract language, refreshes, and delivers a monthly KPI report the same afternoon.
Advantages of This Fit-Out KPI Dashboard
- Faster monthly reviews: one page answers which KPIs are on target, at risk or missed for any month.
- Fair scoring: lower-is-better KPIs such as Fit-Out Cost per Sq Ft and RFI Response Turnaround are scored the right way round.
- Context, not just a number: prior-year lines and 12-month sparklines show whether a miss is a blip or a trend.
- Accountability built in: each KPI carries an owner and a priority, and both are slicers.
- No lock-in: a one-time purchase, and the data stays in your own Excel file.
Opportunities for Improvement
- YTD is typed, not calculated. Data.xlsx holds a YTD column you fill in. Sum money for YTD, and average percentages, days, rates and index scores. The Read Me sheet explains the rule, but the report will not correct a wrong entry.
- MoM % on the header cards compares counts. Moving from 1 to 3 at-risk KPIs shows +200%, which looks dramatic for a small change.
- Hidden tooltip pages. KPI Detail and Trend Detail are hidden in view mode; open them in Power BI Desktop if you want to restyle the hover cards.
- Monthly grain only. There is no project, site or weekly breakdown; the model works at KPI-by-month level.
Best Practices
- Agree each KPI’s formula and owner before loading numbers, and write them into the KPI Definition sheet.
- Set targets for all 12 months at the start of the year so the achievement % is stable month to month.
- Load the prior year’s actuals too; every PY and YoY figure depends on them.
- Keep Data.xlsx next to the .pbix, or update the source path under Transform data > Data source settings.
- Review red KPIs on KPI Trend first, then use KPI Definition to confirm the formula before debating the number.
New to Power BI? Microsoft’s guide to getting started with Power BI Desktop covers refresh, slicers and data sources.
Explore Relevant Templates
If you run a related trade, these published Power BI KPI dashboards follow the same month-picker layout:
- Kitchen Remodeling KPI Dashboard in Power BI
- Bathroom Remodeling KPI Dashboard in Power BI
- Home Renovation Contractor KPI Dashboard in Power BI
Also available as: the Interior Fit-Out KPI Dashboard in Google Sheets, a separate browser-based build (walkthrough on NeoTechNavigators). Excel editions are in preparation.
Frequently Asked Questions
What KPIs does this fit-out dashboard track?
It tracks 13 KPIs in 9 groups: Financial, Commercial, Cost Control, Schedule, Design Coordination, Supply Chain, Quality, Safety and Client. Examples include Gross Margin %, Change Order Value %, Handover on Schedule %, Snag Items per 10,000 Sq Ft and Client Satisfaction Score, each with a formula, definition, owner and priority.
Do I need a paid Power BI licence?
No. The template opens and refreshes in Power BI Desktop, which Microsoft provides free for Windows. A Power BI licence is only needed if you want to publish the report to the Power BI Service and share it with colleagues online.
How long does setup take?
The sample opens in under a minute. Loading your own data means filling one definition row per KPI, then monthly target and actual rows, and pressing Refresh. No DAX or model changes are needed to swap in your numbers.
Can I change the KPIs?
Yes. Every card, table and chart is driven by the rows in Data.xlsx. Rename a KPI in all three sheets, because the name is the join key, or add and delete rows, then refresh. Groups, units, formulas, owners and priorities are free text.
How does it compare to a construction SaaS platform?
A SaaS platform captures site data and handles collaboration but charges a recurring fee. This template does one job, a monthly KPI scorecard against target, for a one-time price, and your data stays in your own file.
Is the sample data real?
No. All figures are fictional sample values labelled in USD, created to show how the scorecard behaves. Replace them with your own numbers before using the report for decisions.
About the Author
Built by PK, who has more than 15 years of hands-on Excel, Google Sheets and Power BI experience and founded NextGenTemplates. Every template is built and tested before release. Watch the tutorials at Youtube.com/@PKAnExcelExpert.
Conclusion
If your fit-out business already tracks margin, change orders, handovers, snags and safety, this report gives those numbers one monthly scorecard with fair, direction-aware traffic lights and prior-year context. It is quick to load, easy to adapt, and yours to keep.
👉 Click here to Purchase the Interior Fit-Out KPI Dashboard in Power BI
✅ Instant download · One-time payment · No subscription
Last updated: September 2026