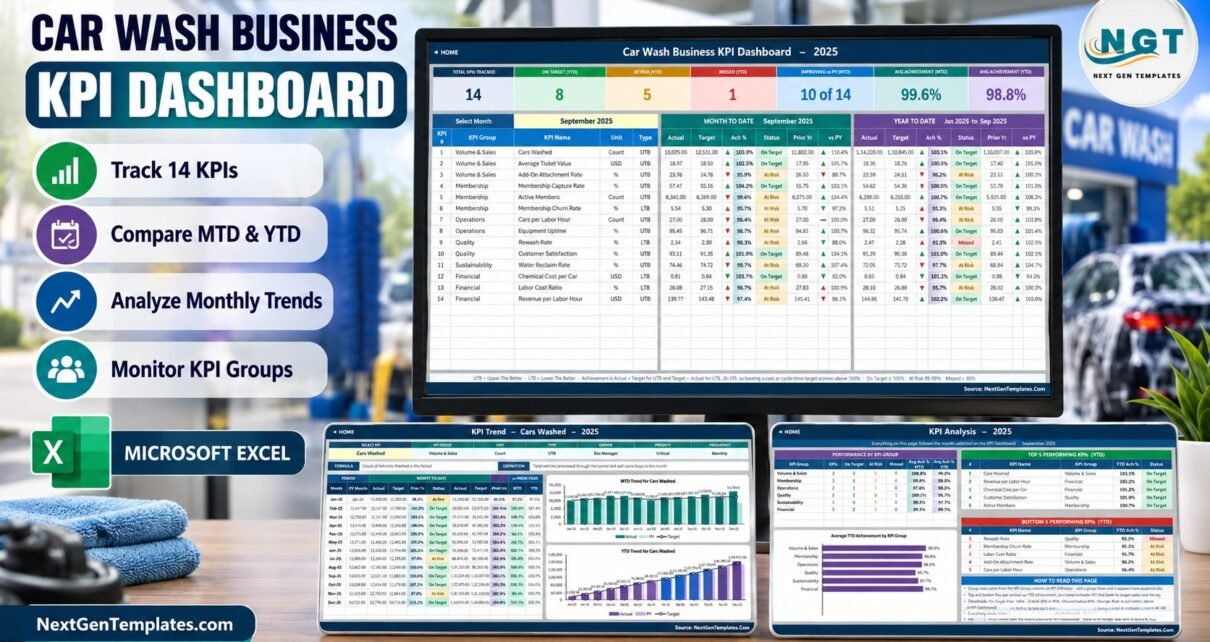
The Car Wash Business KPI Dashboard in Excel scores 14 car wash KPIs in 6 groups – month-to-date and year-to-date – against target and prior year, on a 10-sheet workbook driven by one month dropdown. In the sample year for September 2025, 8 KPIs are On Target, 5 are At Risk and 1 is Missed, with average achievement of 99.6% MTD and 98.8% YTD.
Most car wash owners already have the numbers: the POS prints cars washed and revenue, payroll gives labor hours, and the membership platform reports active plans and cancellations. What is usually missing is one place that sets those figures against a target and last year, and says plainly which ones need attention. This car wash KPI dashboard does exactly that, with plain Excel formulas and no macros.
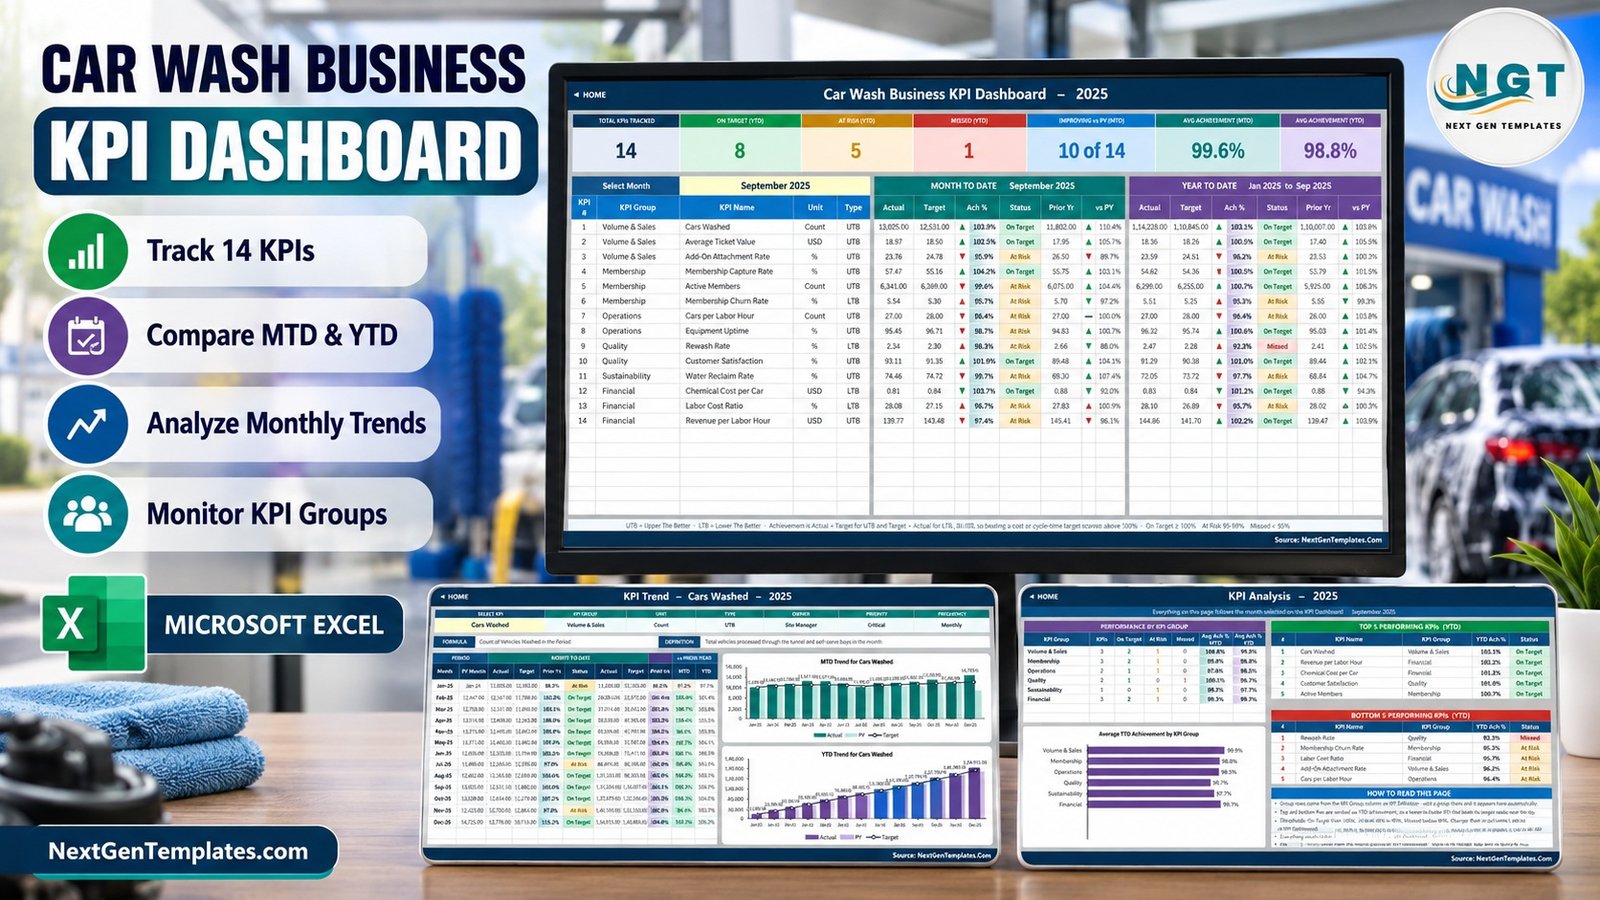
This is the month-picker KPI dashboard family. It is a different template from the Car Wash Business KPI Scorecard in Google Sheets, which uses its own KPI set and layout.
Key Features of the Car Wash Business KPI Dashboard in Excel
- One month picker. Cell D6 on the KPI Dashboard sheet lists the twelve months of the reporting year; the dashboard and the analysis page follow it.
- 14 ready-made car wash KPIs. Cars Washed, Average Ticket Value, Add-On Attachment Rate, Membership Capture Rate, Active Members, Membership Churn Rate, Cars per Labor Hour, Equipment Uptime, Rewash Rate, Customer Satisfaction, Water Reclaim Rate, Chemical Cost per Car, Labor Cost Ratio and Revenue per Labor Hour.
- Direction-aware achievement. Ten KPIs are UTB (upper the better) and four are LTB (lower the better): Membership Churn Rate, Rewash Rate, Chemical Cost per Car and Labor Cost Ratio. For an LTB KPI achievement is Target divided by Actual, so beating a cost target scores above 100%.
- Traffic lights and arrows. On Target from 100%, At Risk from 95% to 99%, Missed below 95%. The arrow shows the raw direction; its colour shows whether that direction is good.
- Room to grow. The sheets are wired for 22 KPIs, so eight more can be added on KPI Definition without touching a formula.
- No add-ins. The Home page states the workbook uses VLOOKUP, MATCH, INDEX and COUNTIF only – no Power Query, no Power Pivot, no macros.
Dashboard Pages Explanation
Home
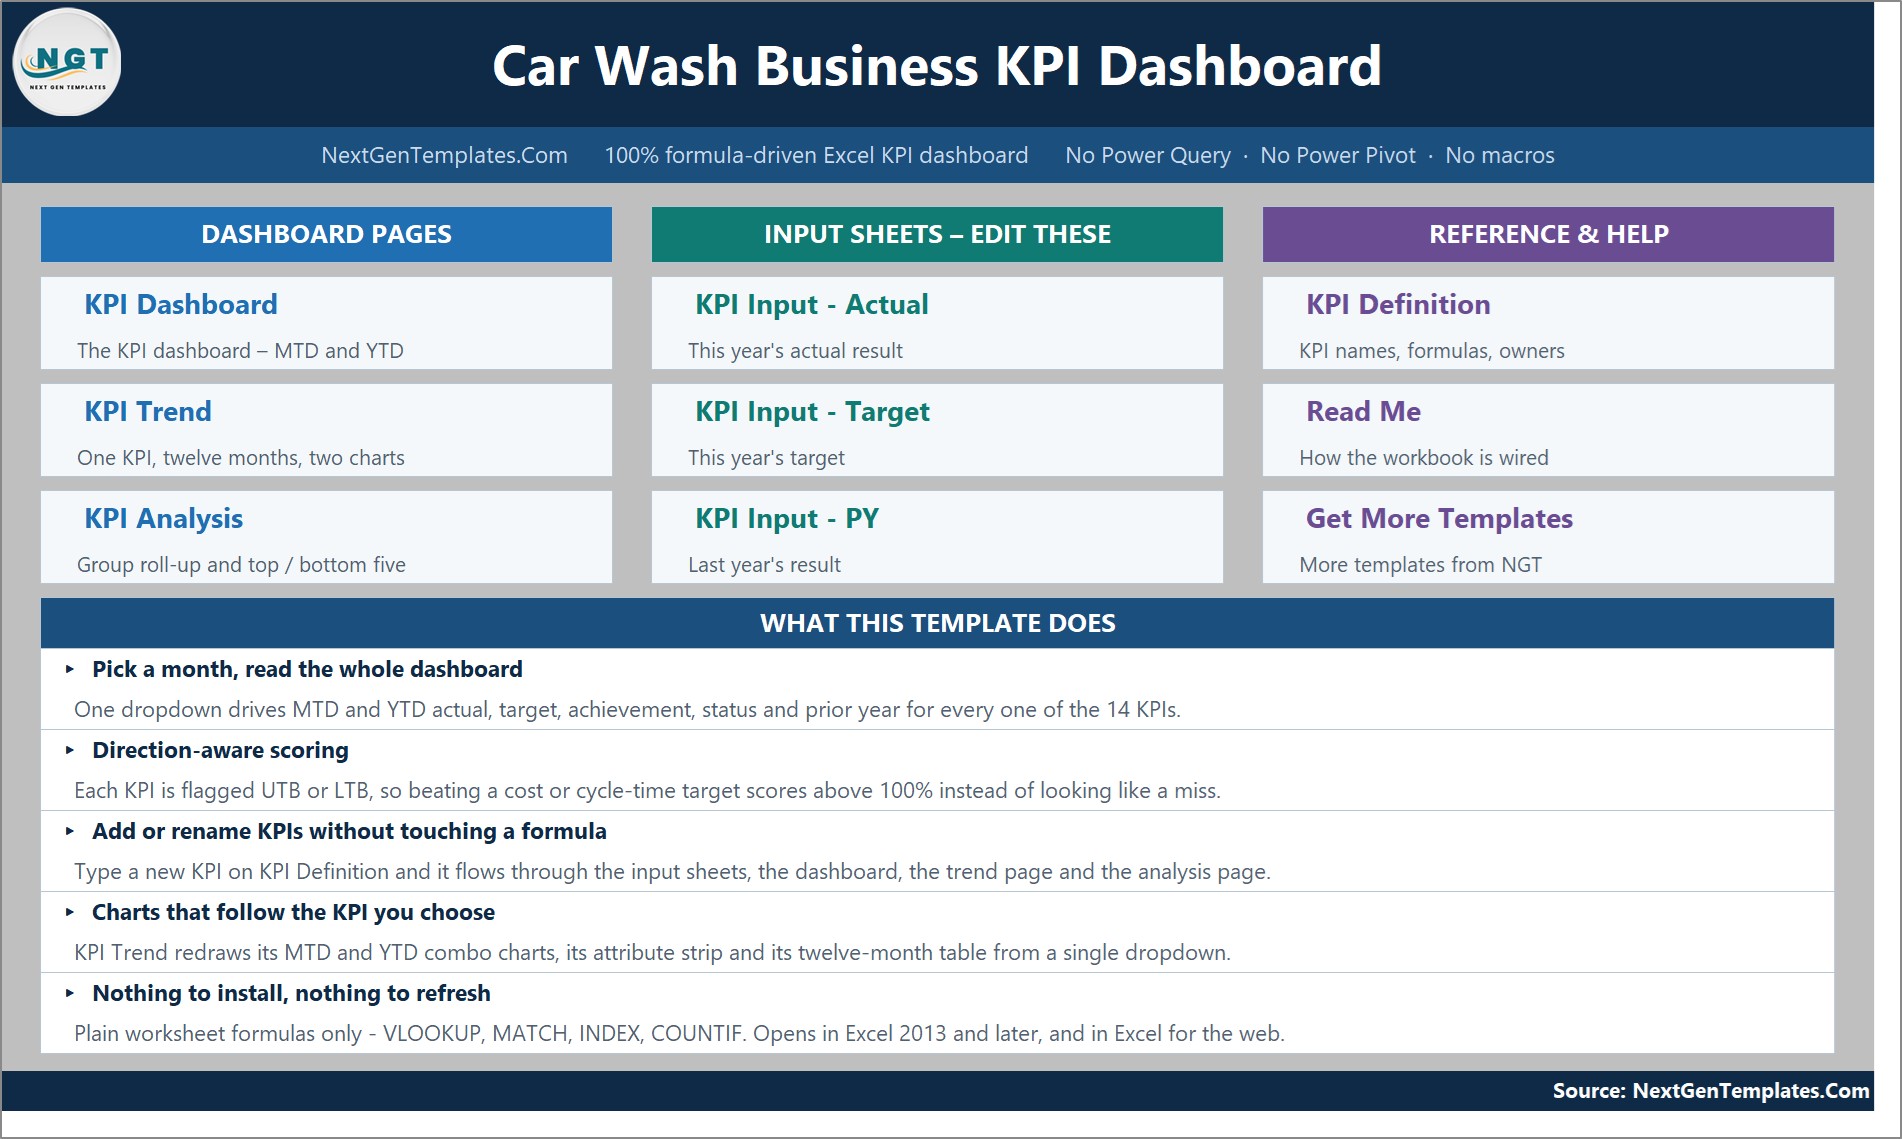
The Home sheet groups navigation into Dashboard Pages, Input Sheets and Reference & Help, and summarises the five things the template does.
KPI Dashboard
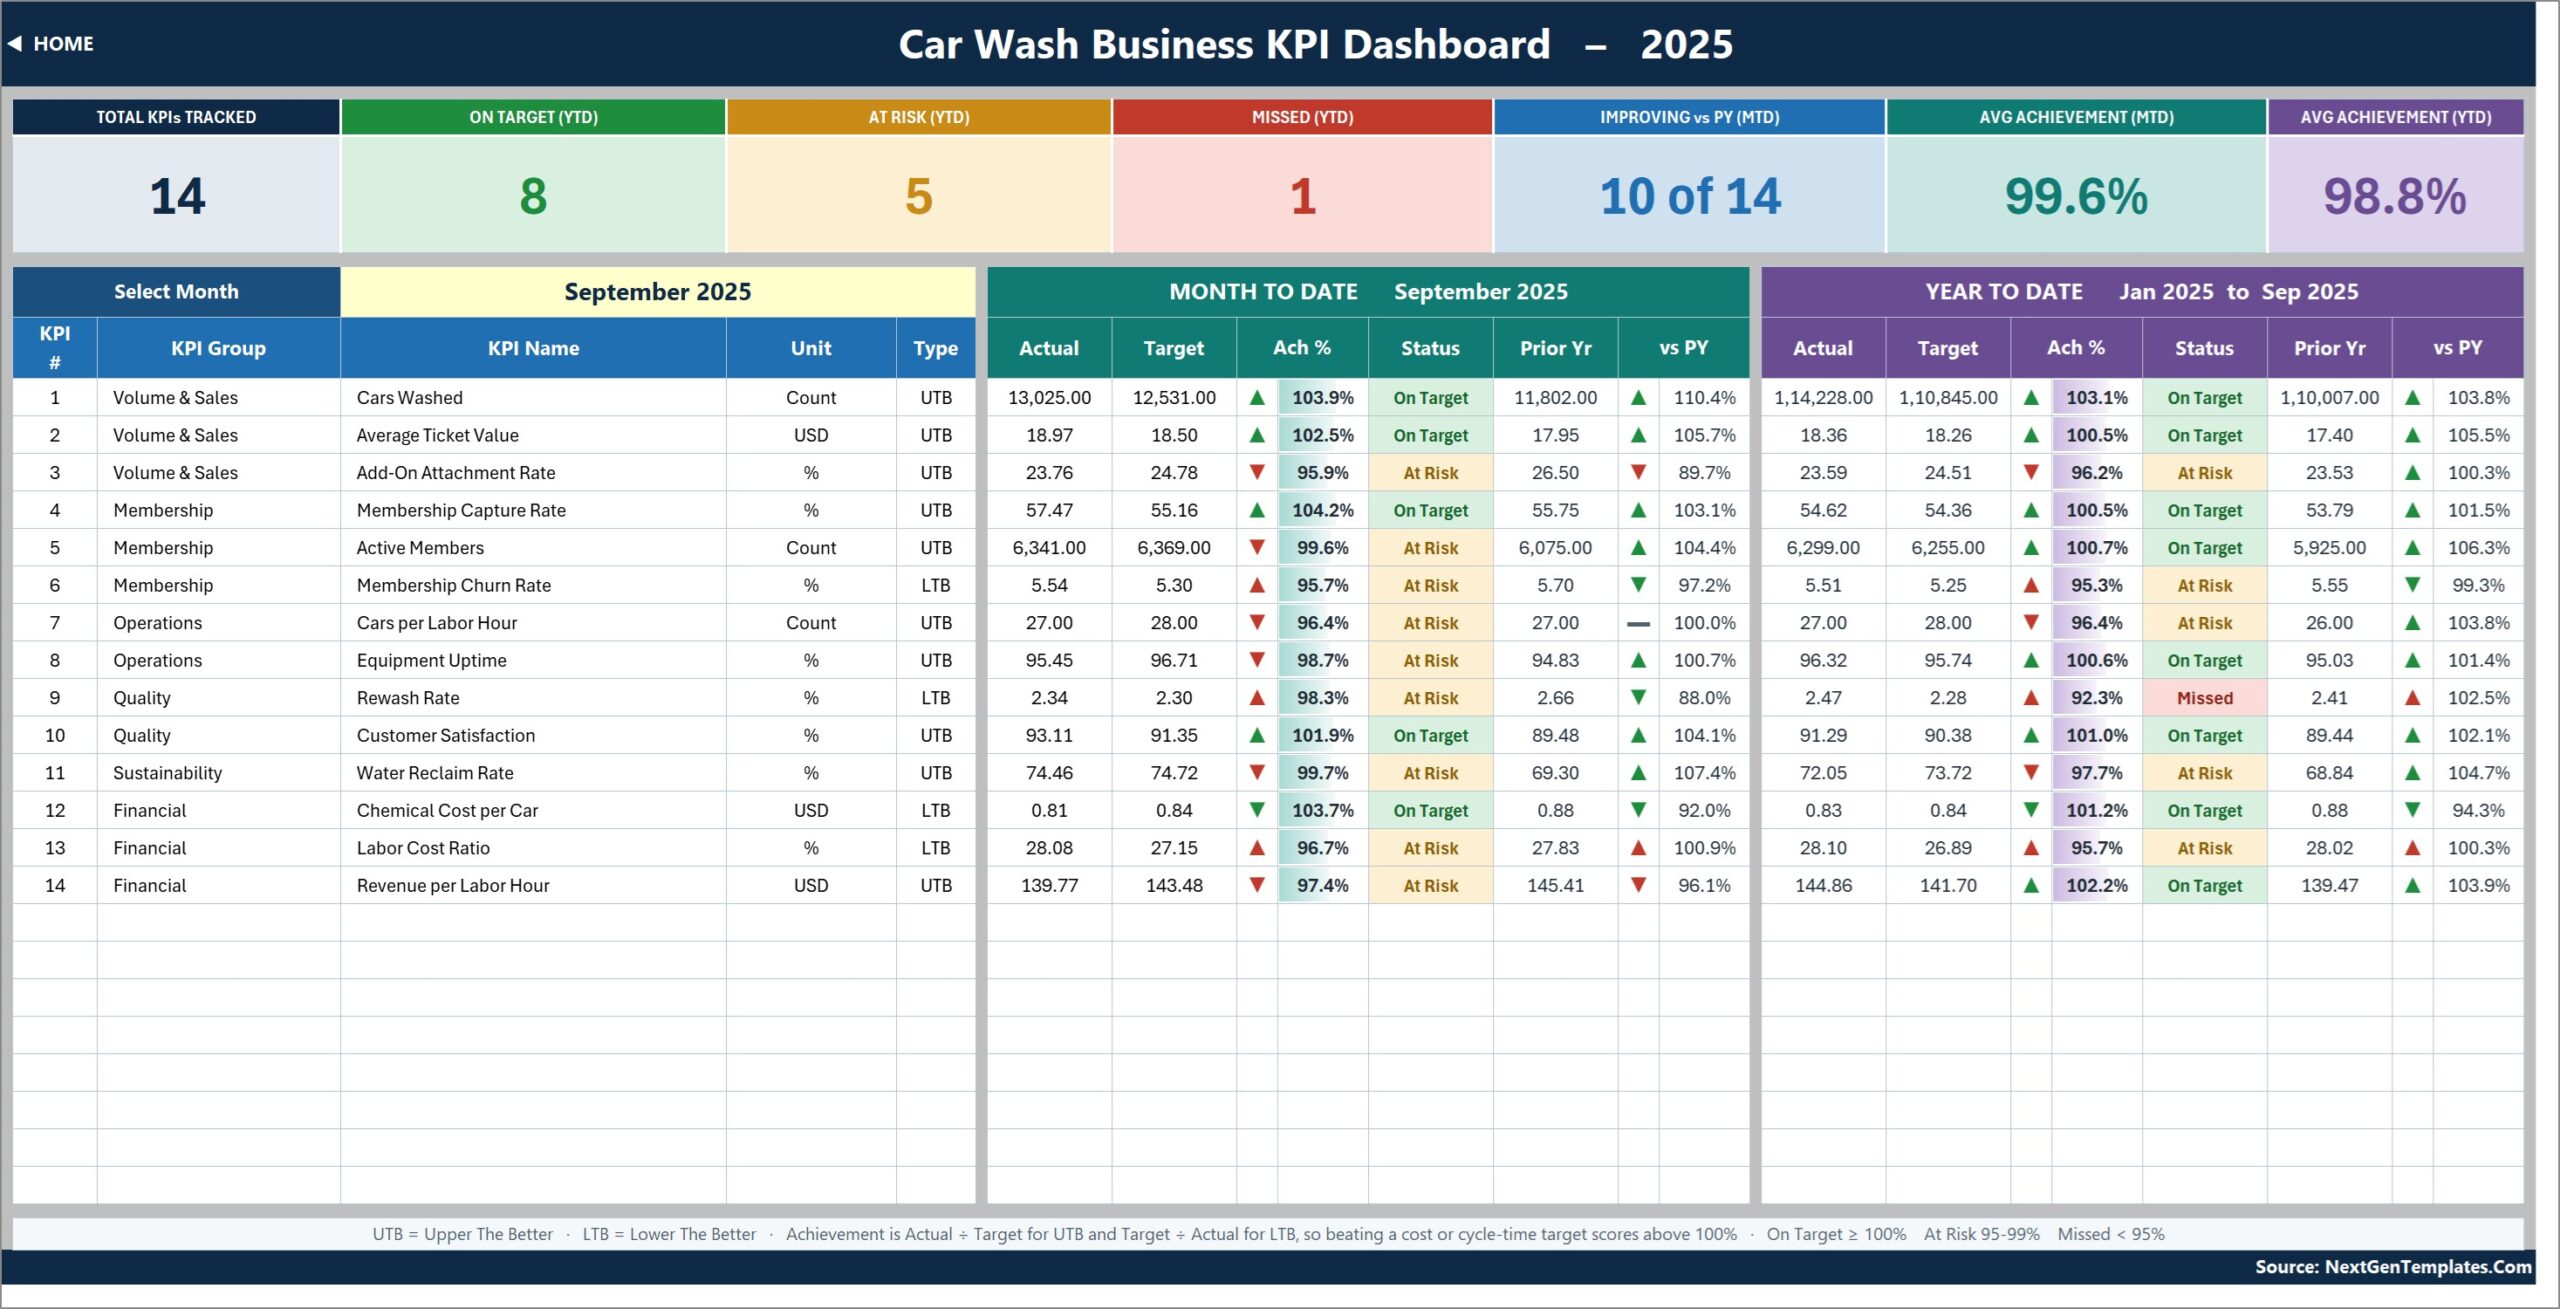
Seven cards sit on top: Total KPIs Tracked (14), On Target YTD, At Risk YTD, Missed YTD, Improving vs PY MTD (10 of 14 in the sample), Avg Achievement MTD and Avg Achievement YTD. Below them, each KPI row shows group, name, unit and type, then MTD and YTD blocks of Actual, Target, Ach %, Status, Prior Yr and vs PY.
KPI Trend
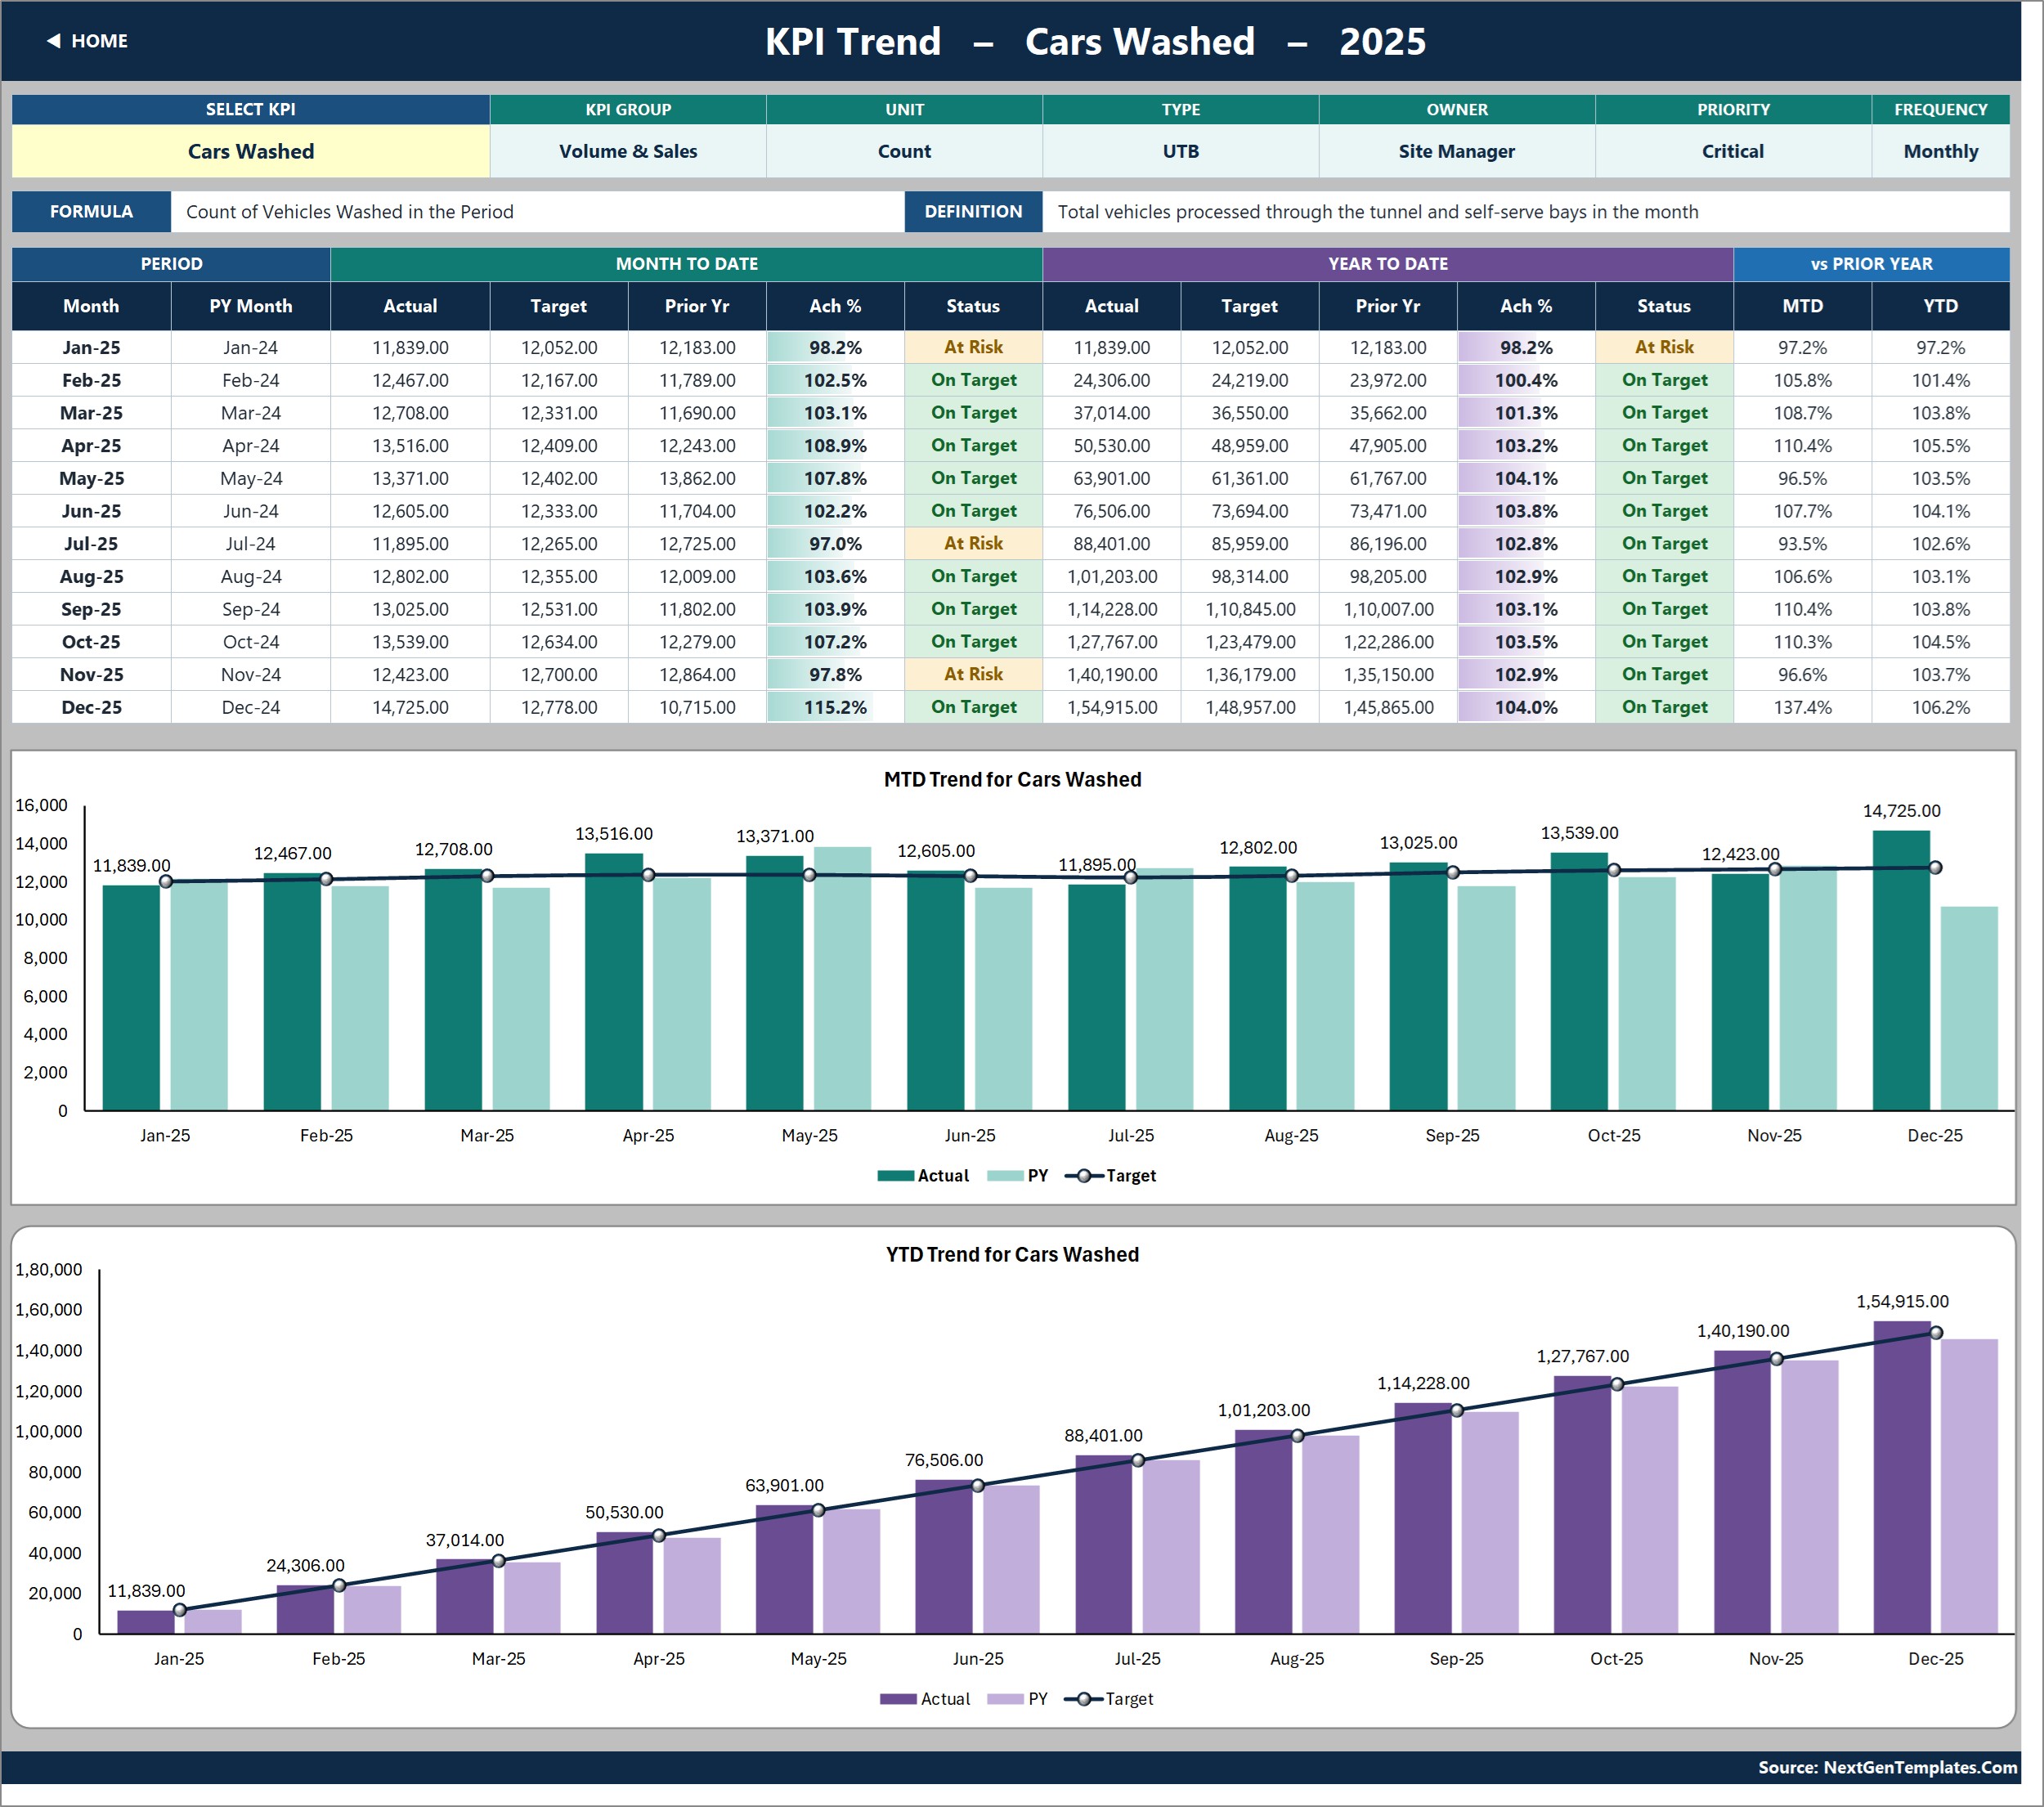
Choose a KPI in cell B4. An attribute strip shows its group, unit, type, owner, priority, frequency, formula and definition. A twelve-month table lists MTD and YTD actual, target, prior year, achievement and status, and two charts plot MTD Trend by Month and YTD Trend by Month with Actual and PY columns and a Target line.
KPI Analysis
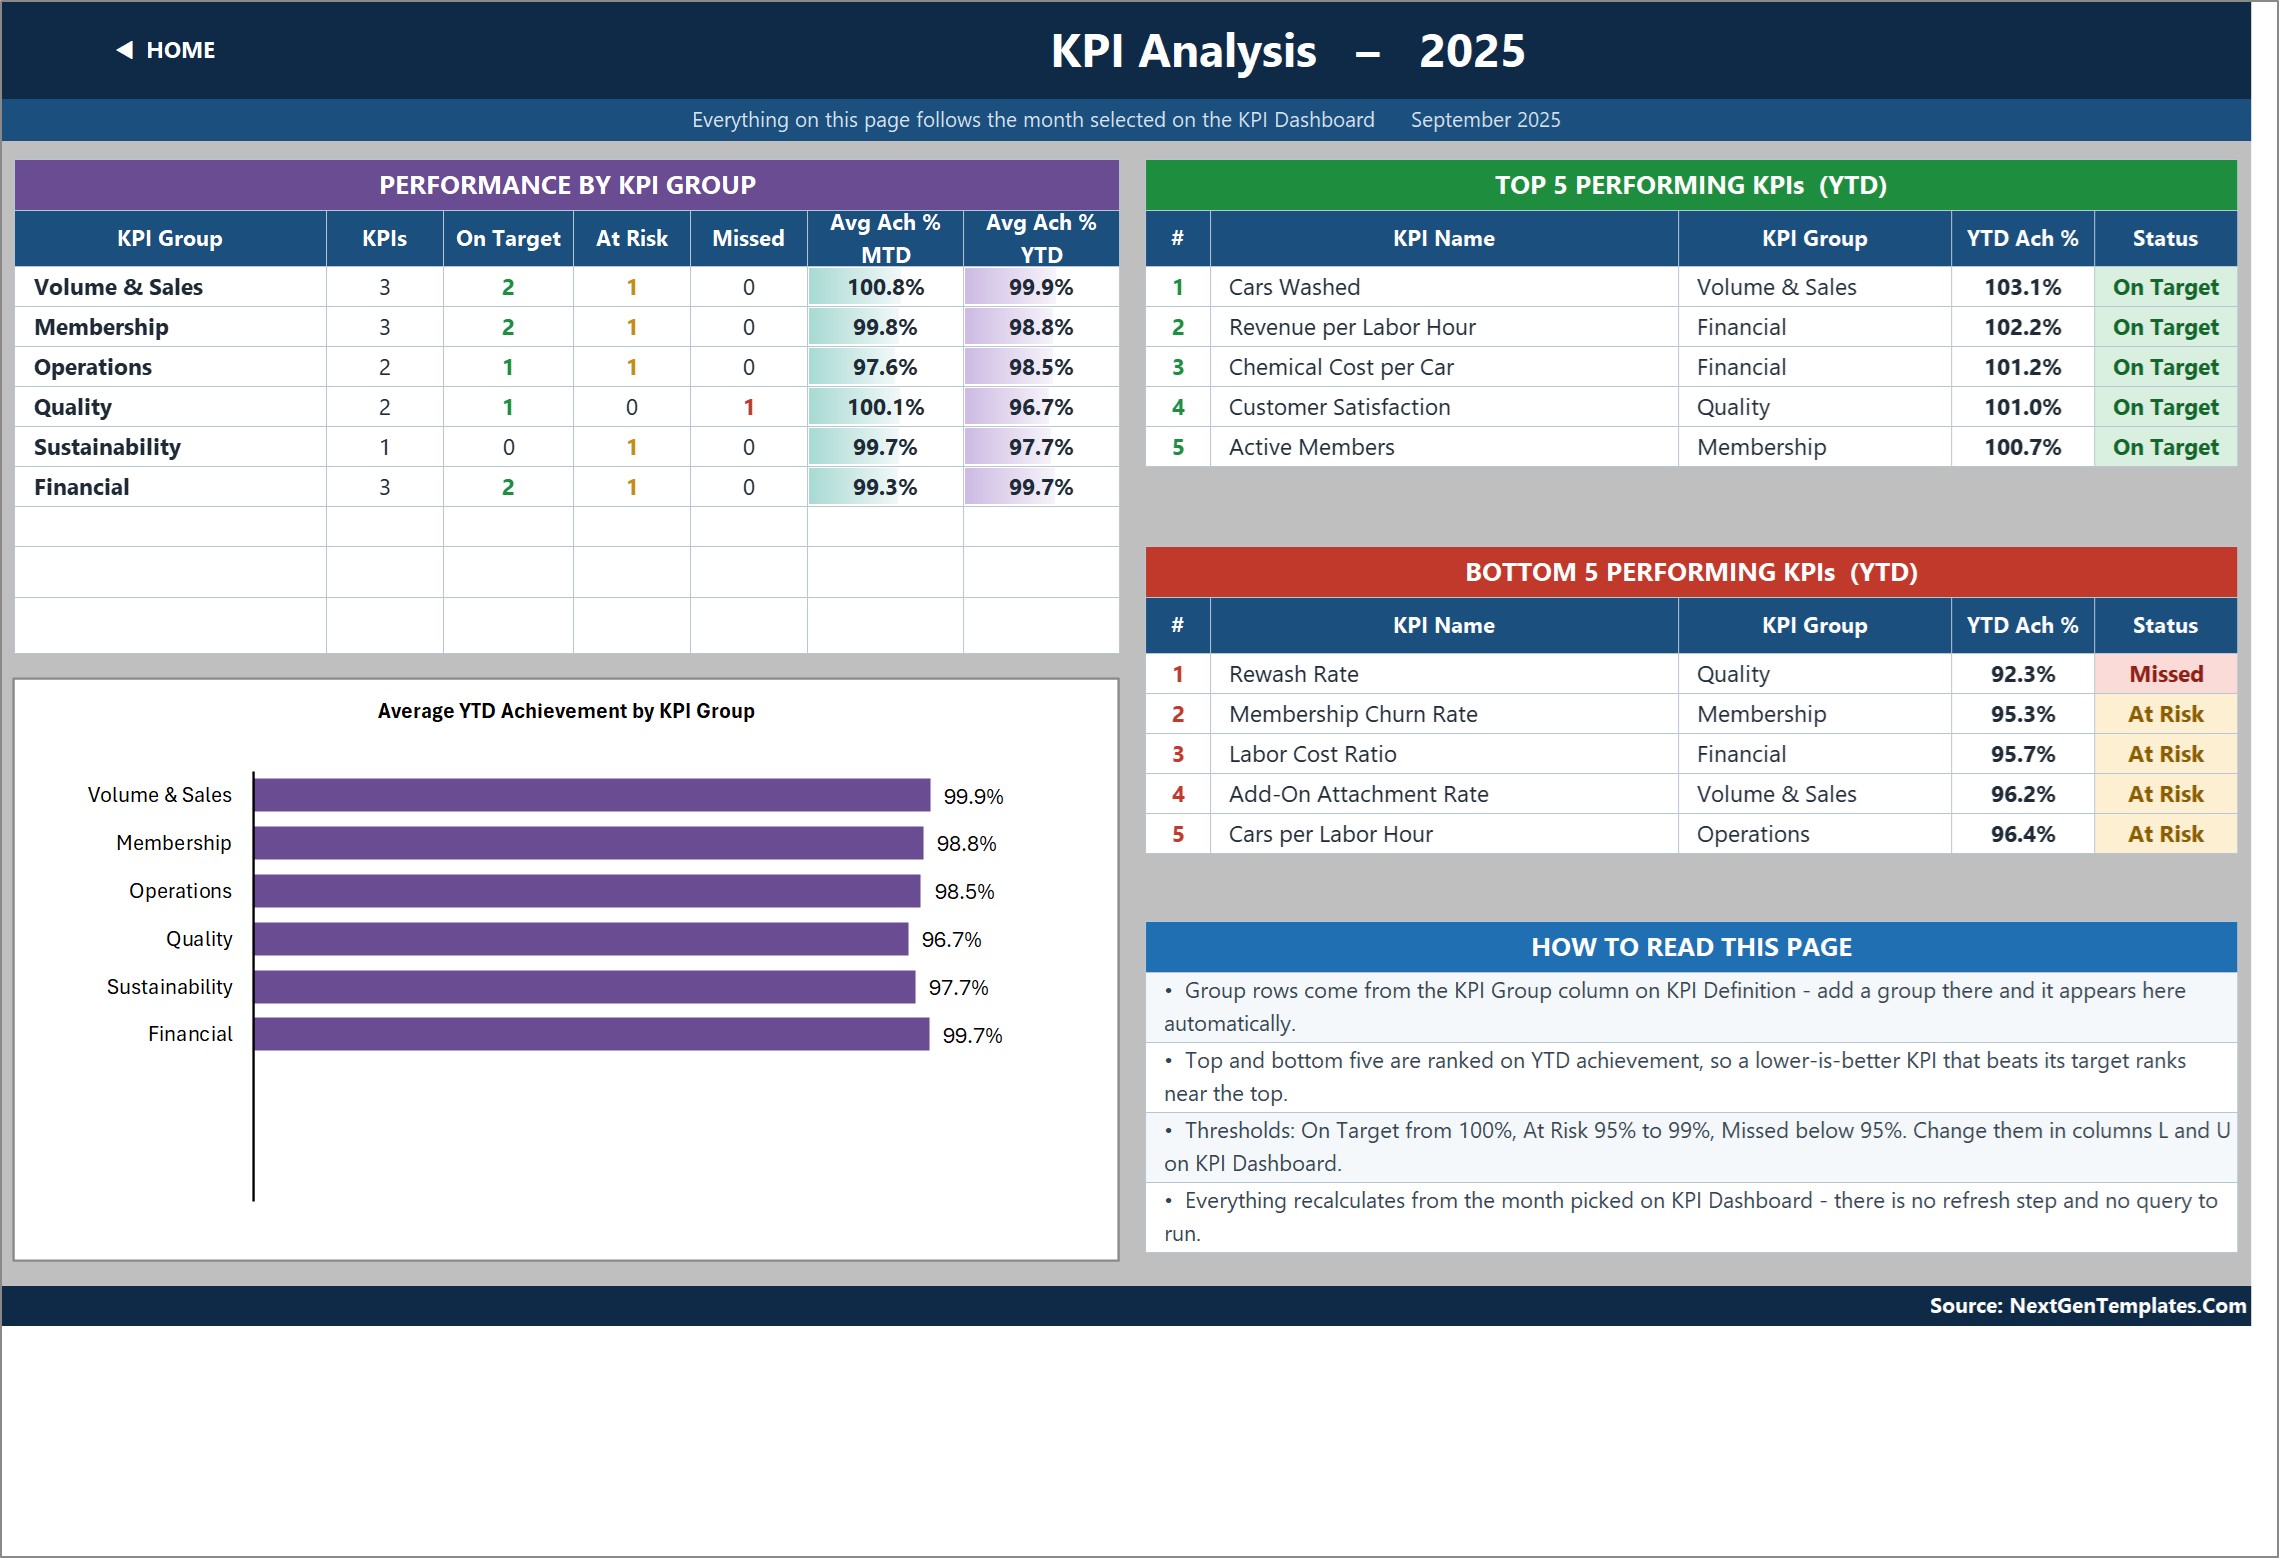
Performance by KPI Group counts KPIs, On Target, At Risk and Missed for Volume & Sales, Membership, Operations, Quality, Sustainability and Financial, with average achievement MTD and YTD. A chart shows Average YTD Achievement by KPI Group, and two tables rank the Top 5 and Bottom 5 KPIs on YTD achievement.
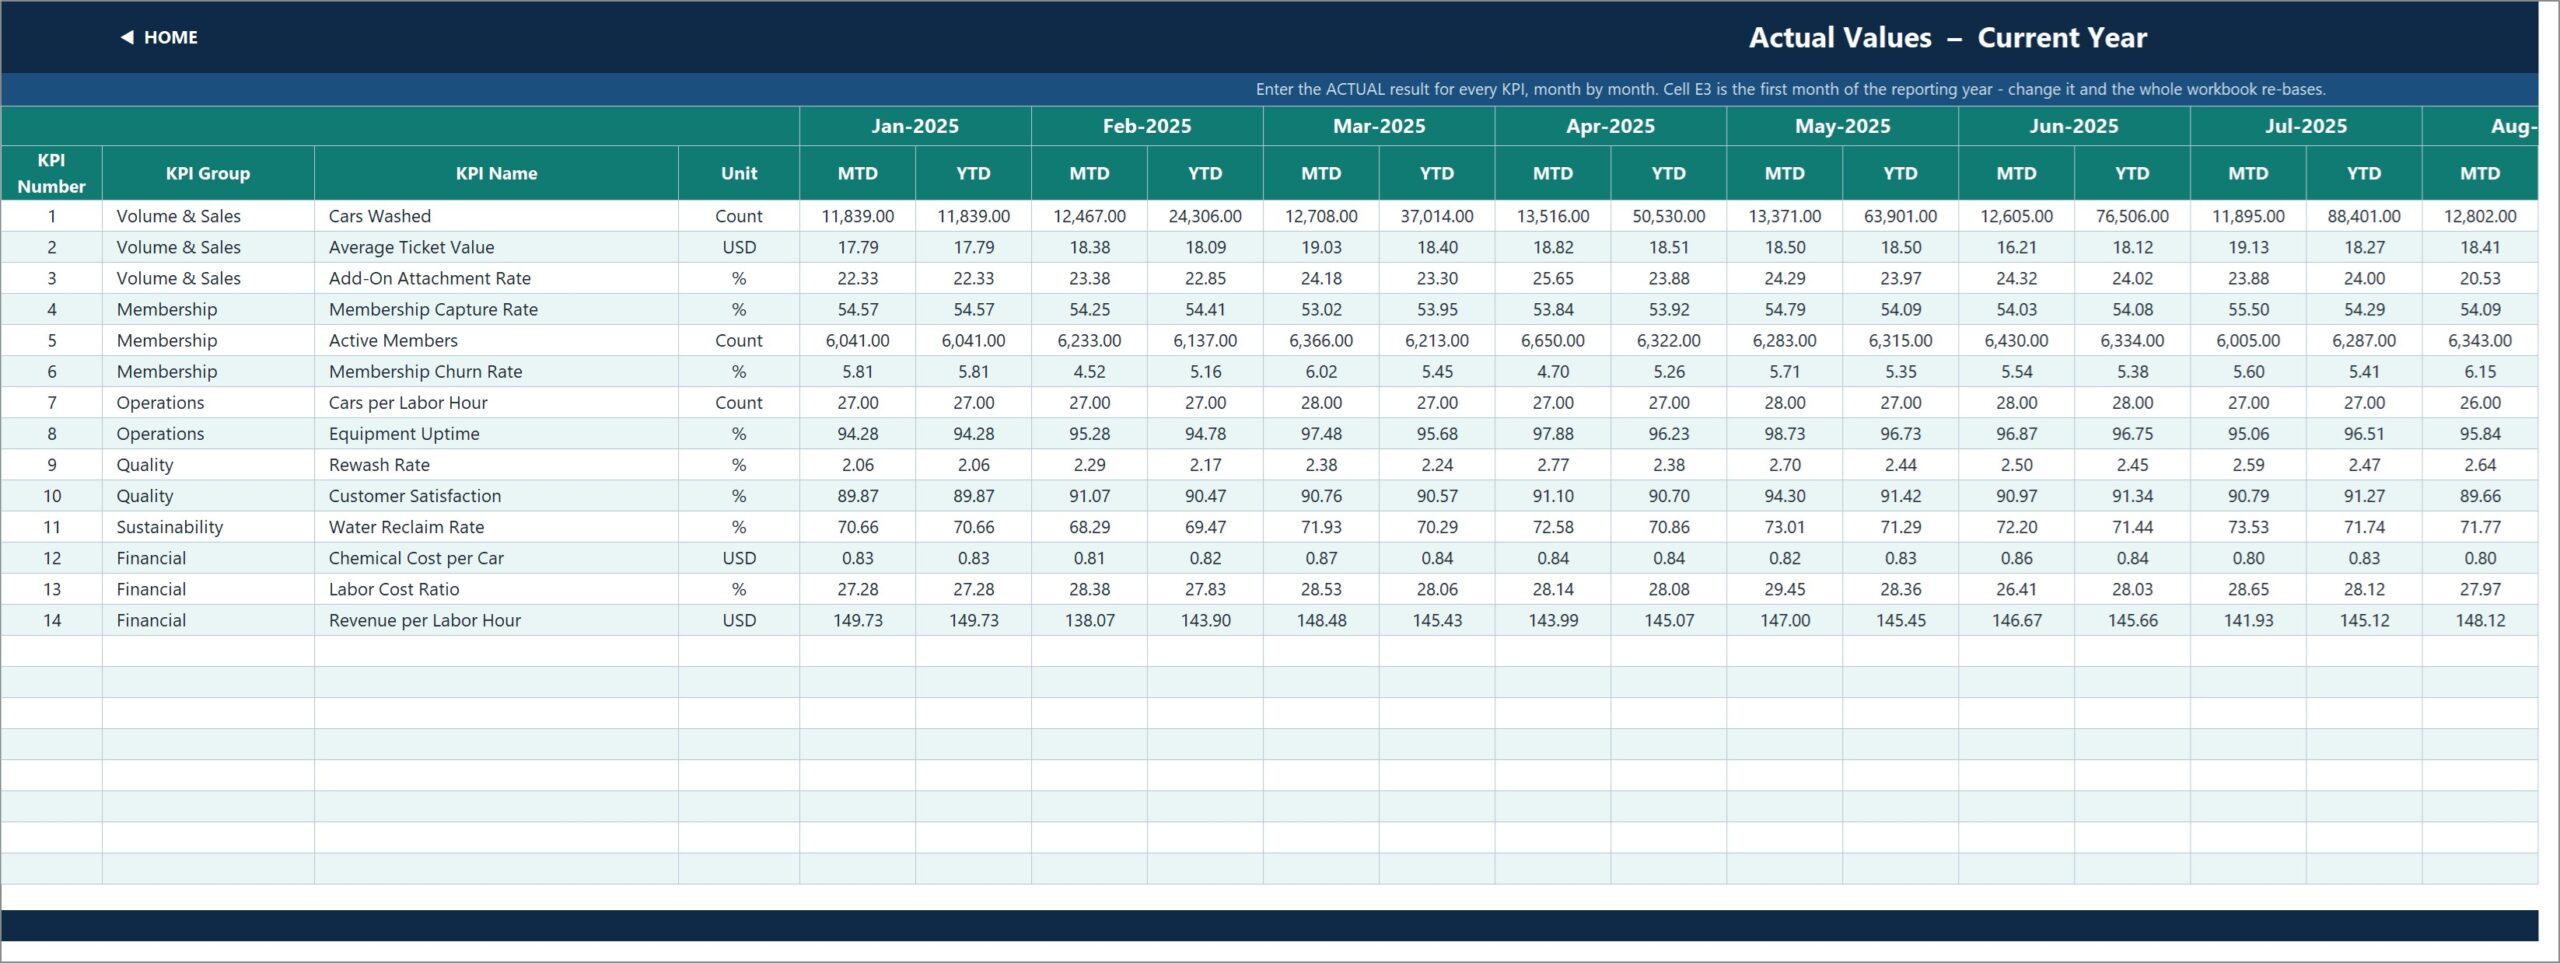
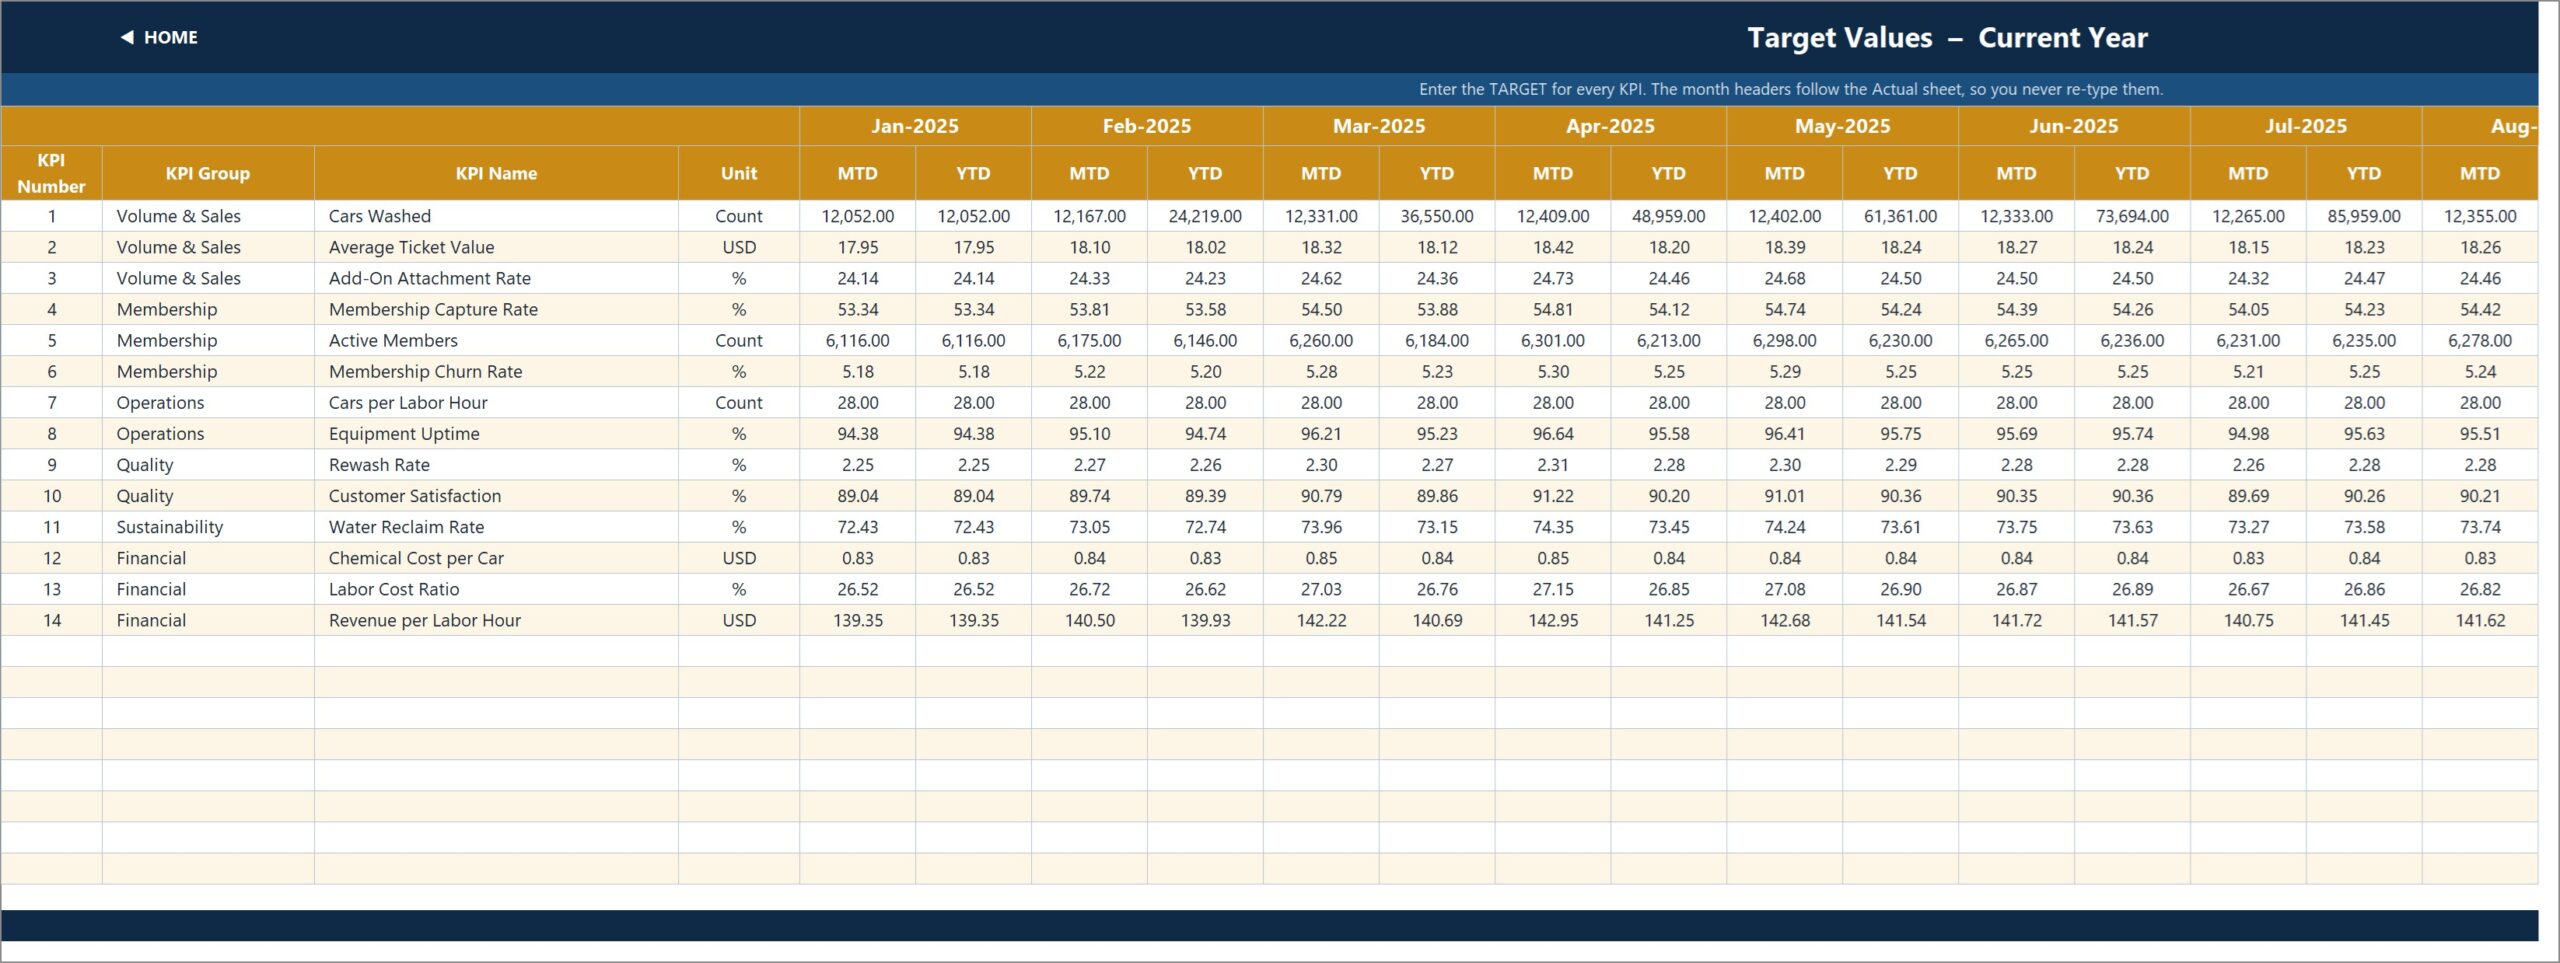
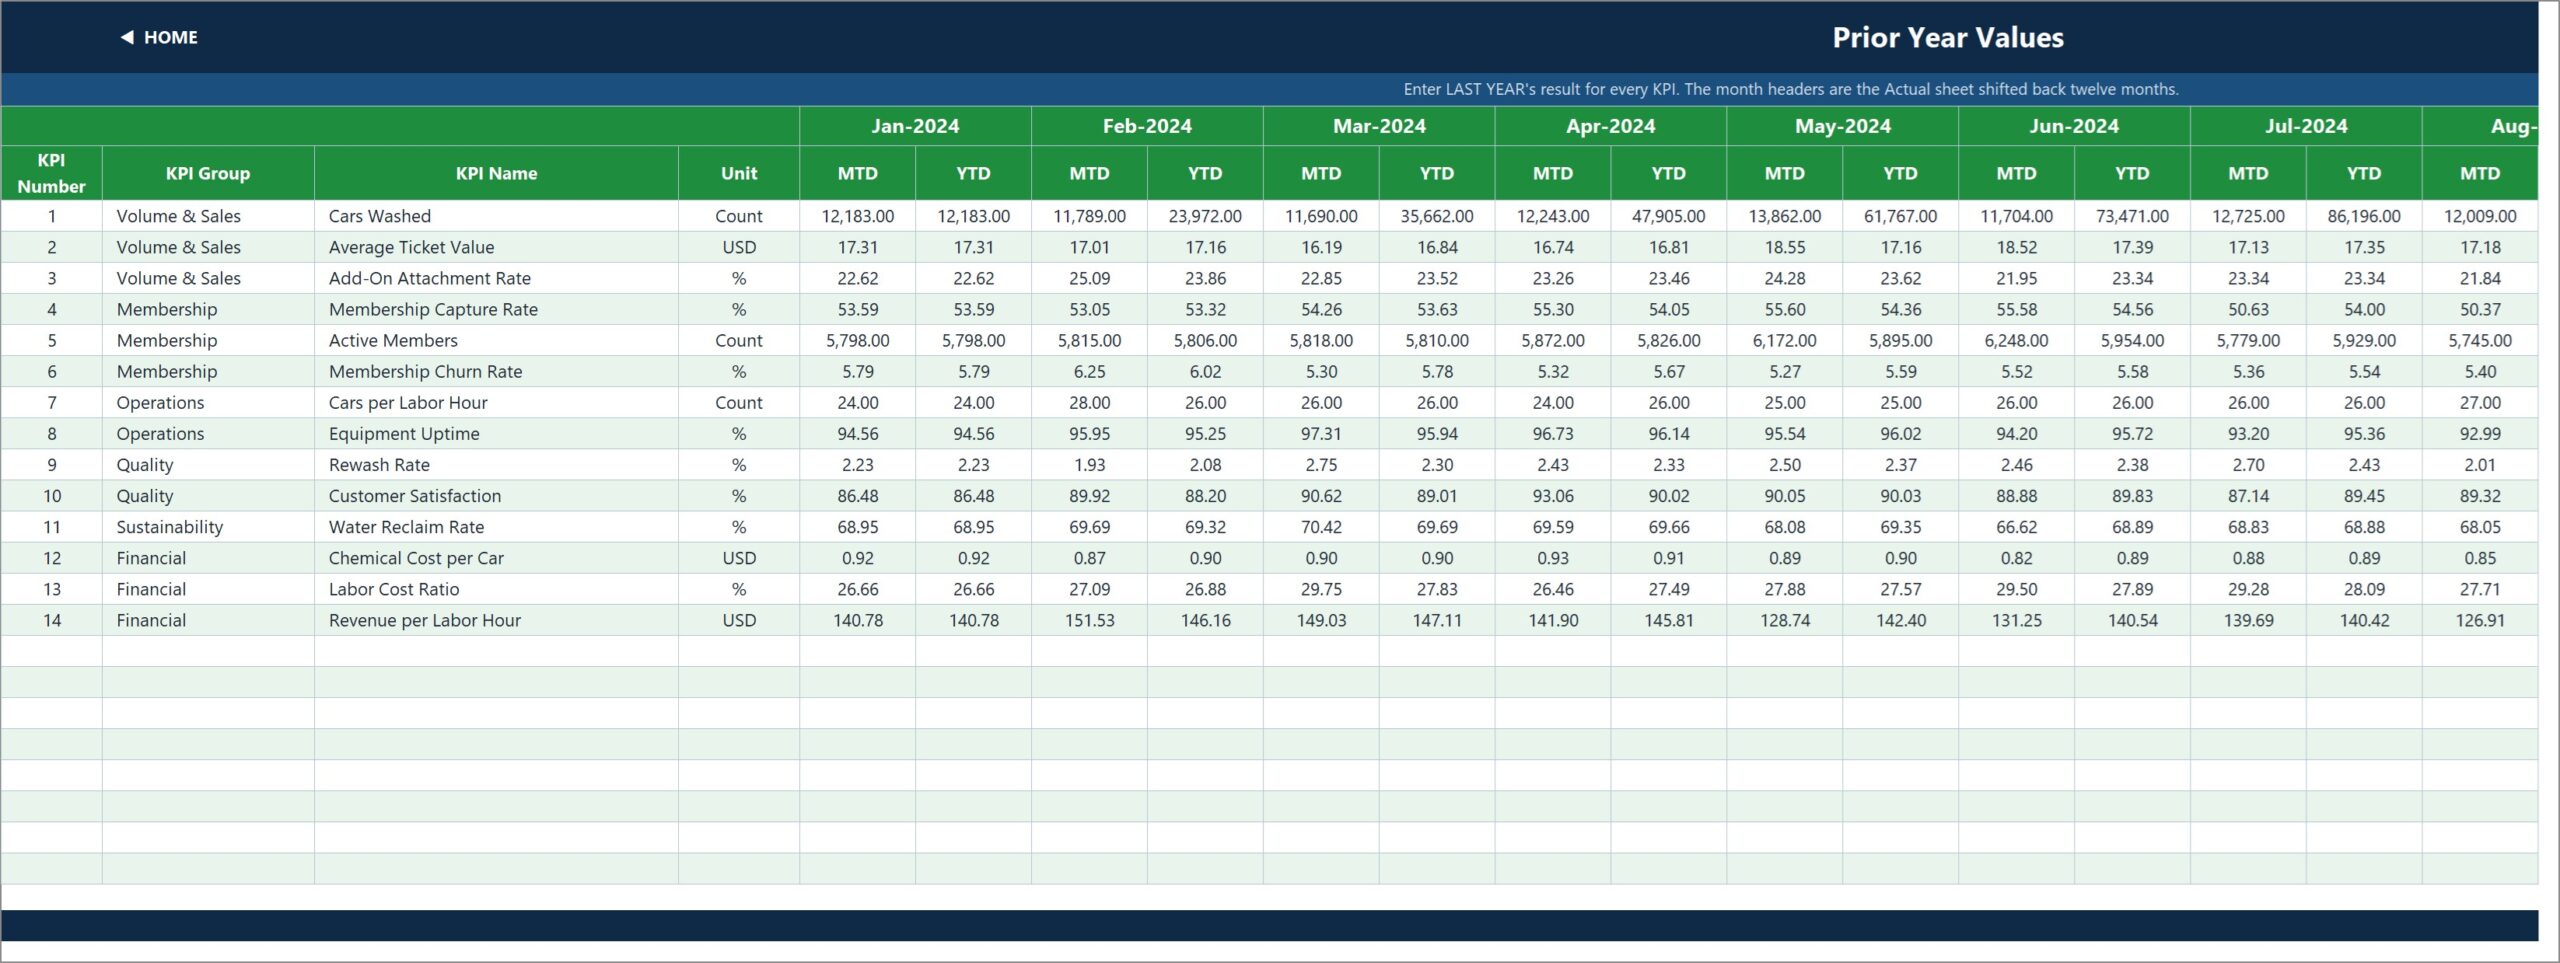
KPI Input – Actual, Target and PY
Three grids hold an MTD and a YTD column for each month. Cell E3 on KPI Input – Actual is the first month of the reporting year; the Target sheet copies those headers and the Prior Year sheet shifts them back twelve months.
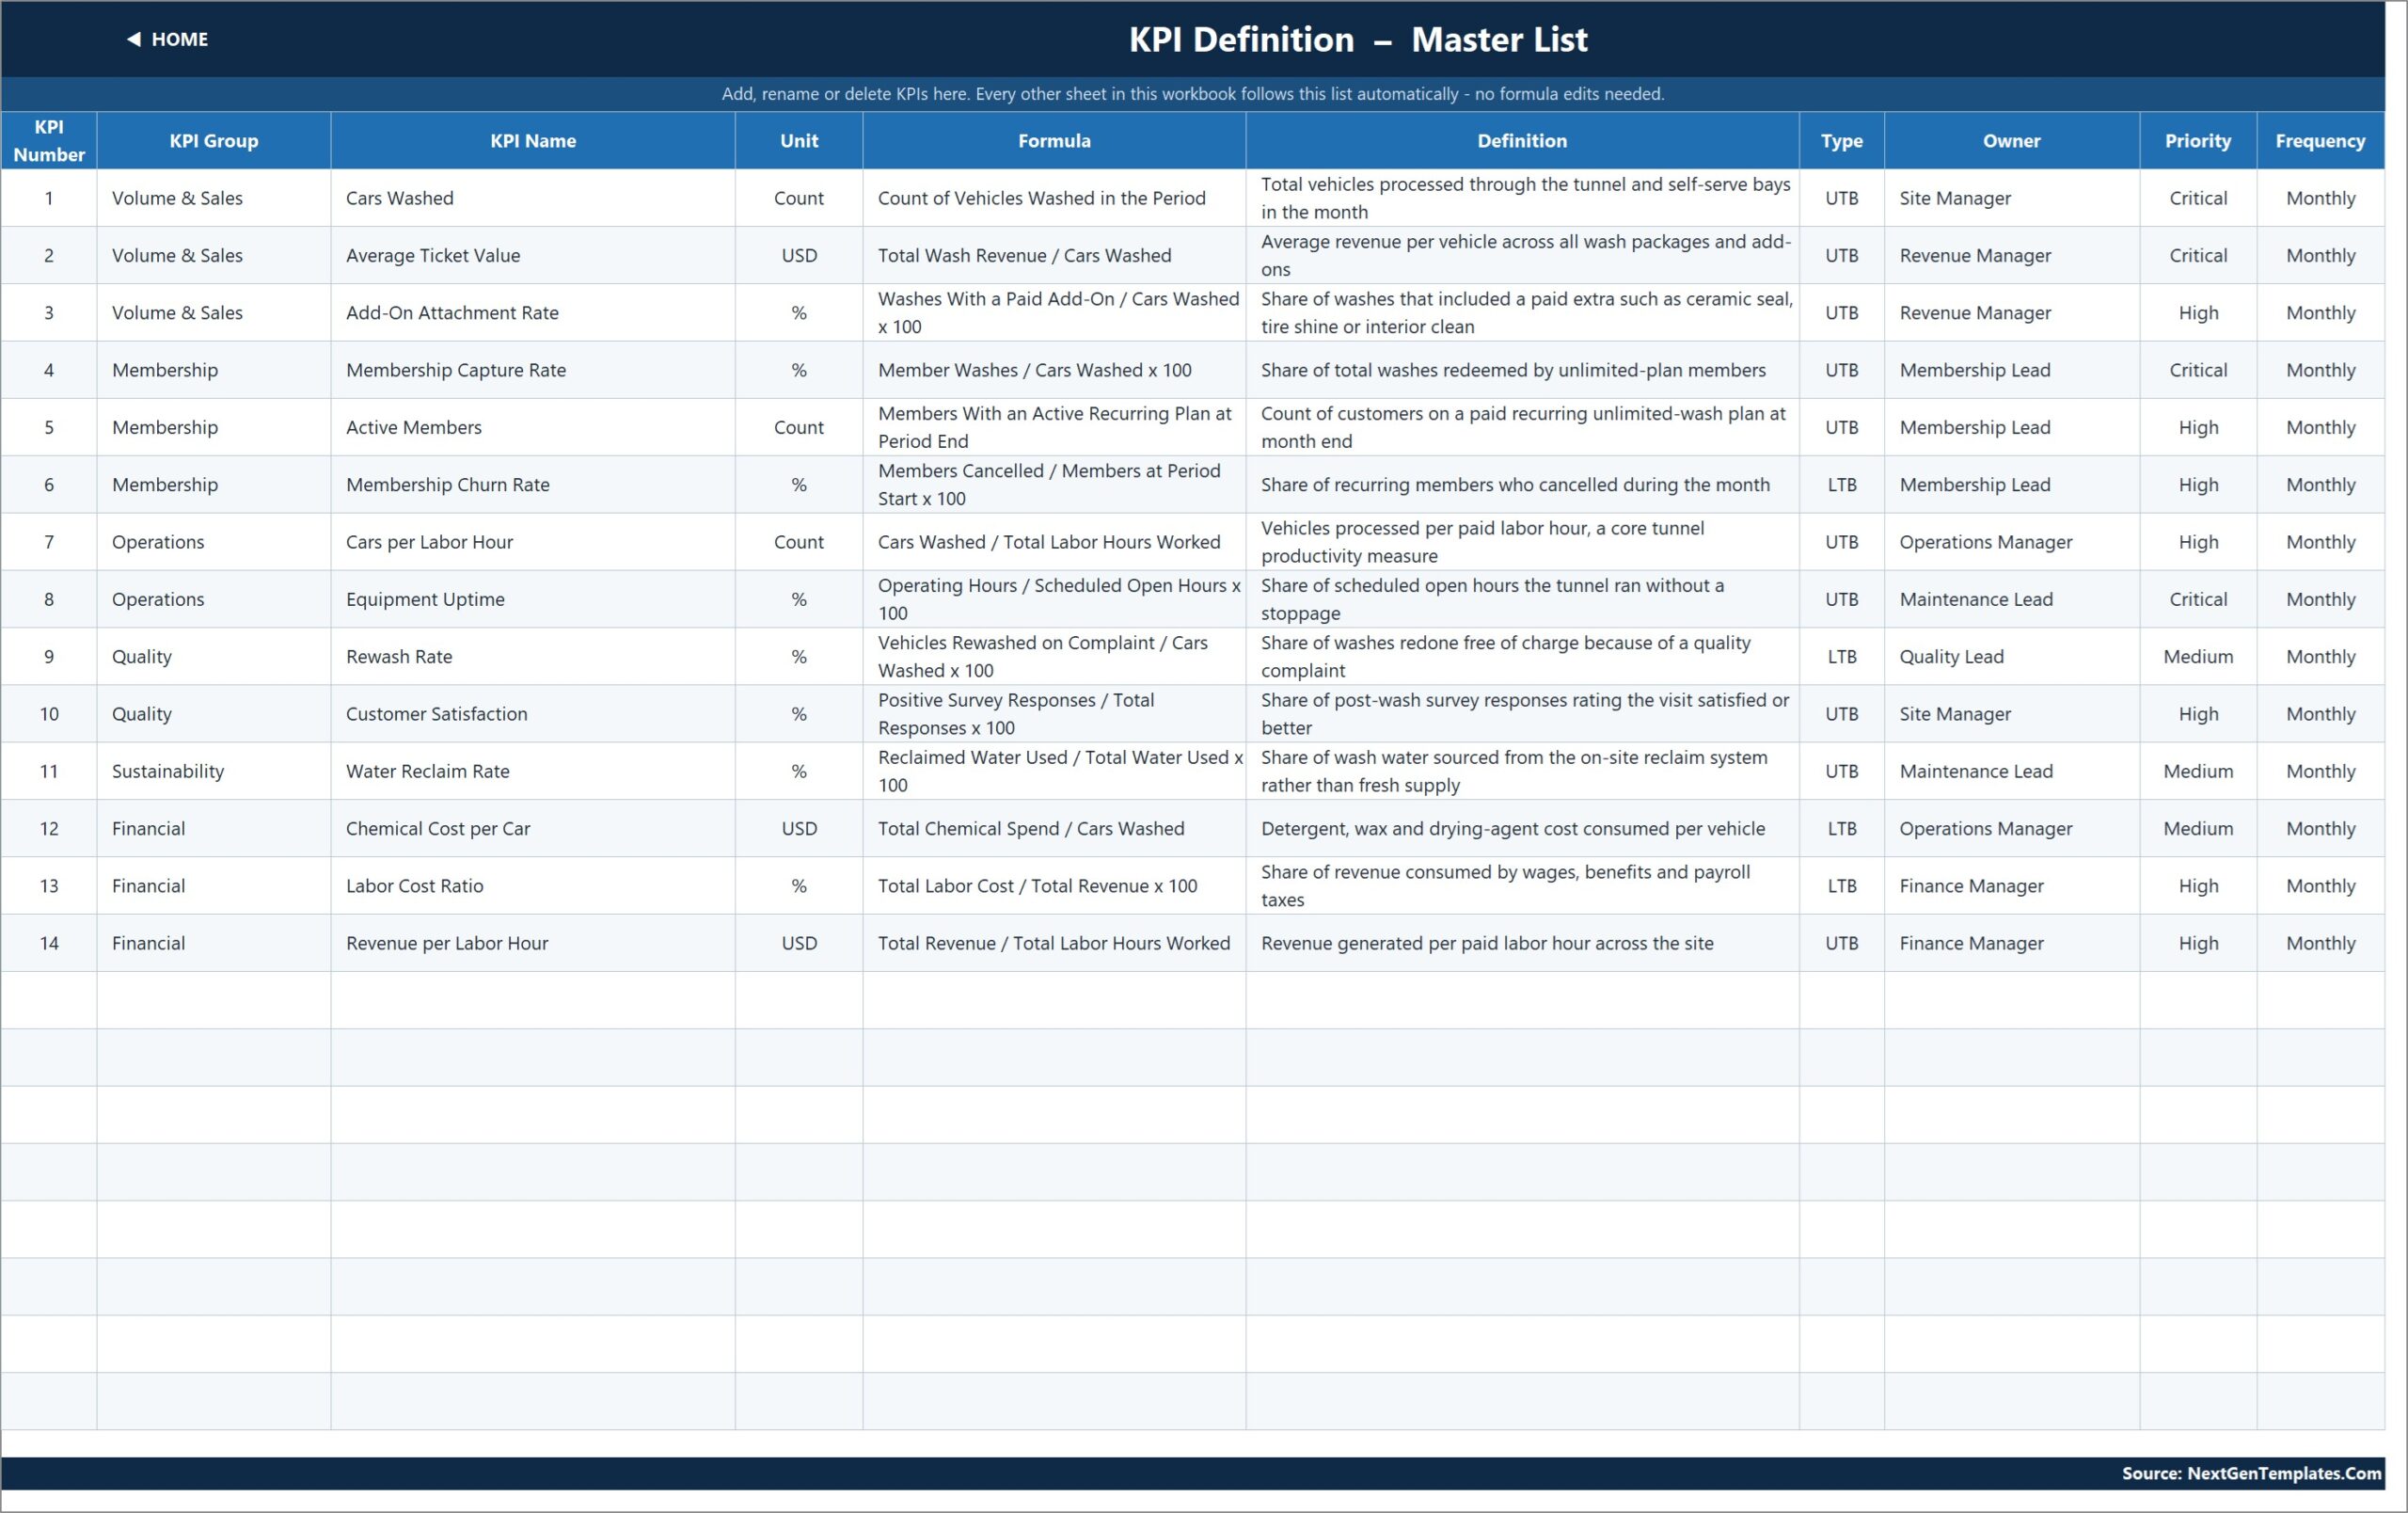
KPI Definition
The master list: number, group, name, unit, formula, definition, UTB/LTB type, owner, priority and frequency. For example, Chemical Cost per Car is Total Chemical Spend / Cars Washed, owned by the Operations Manager.
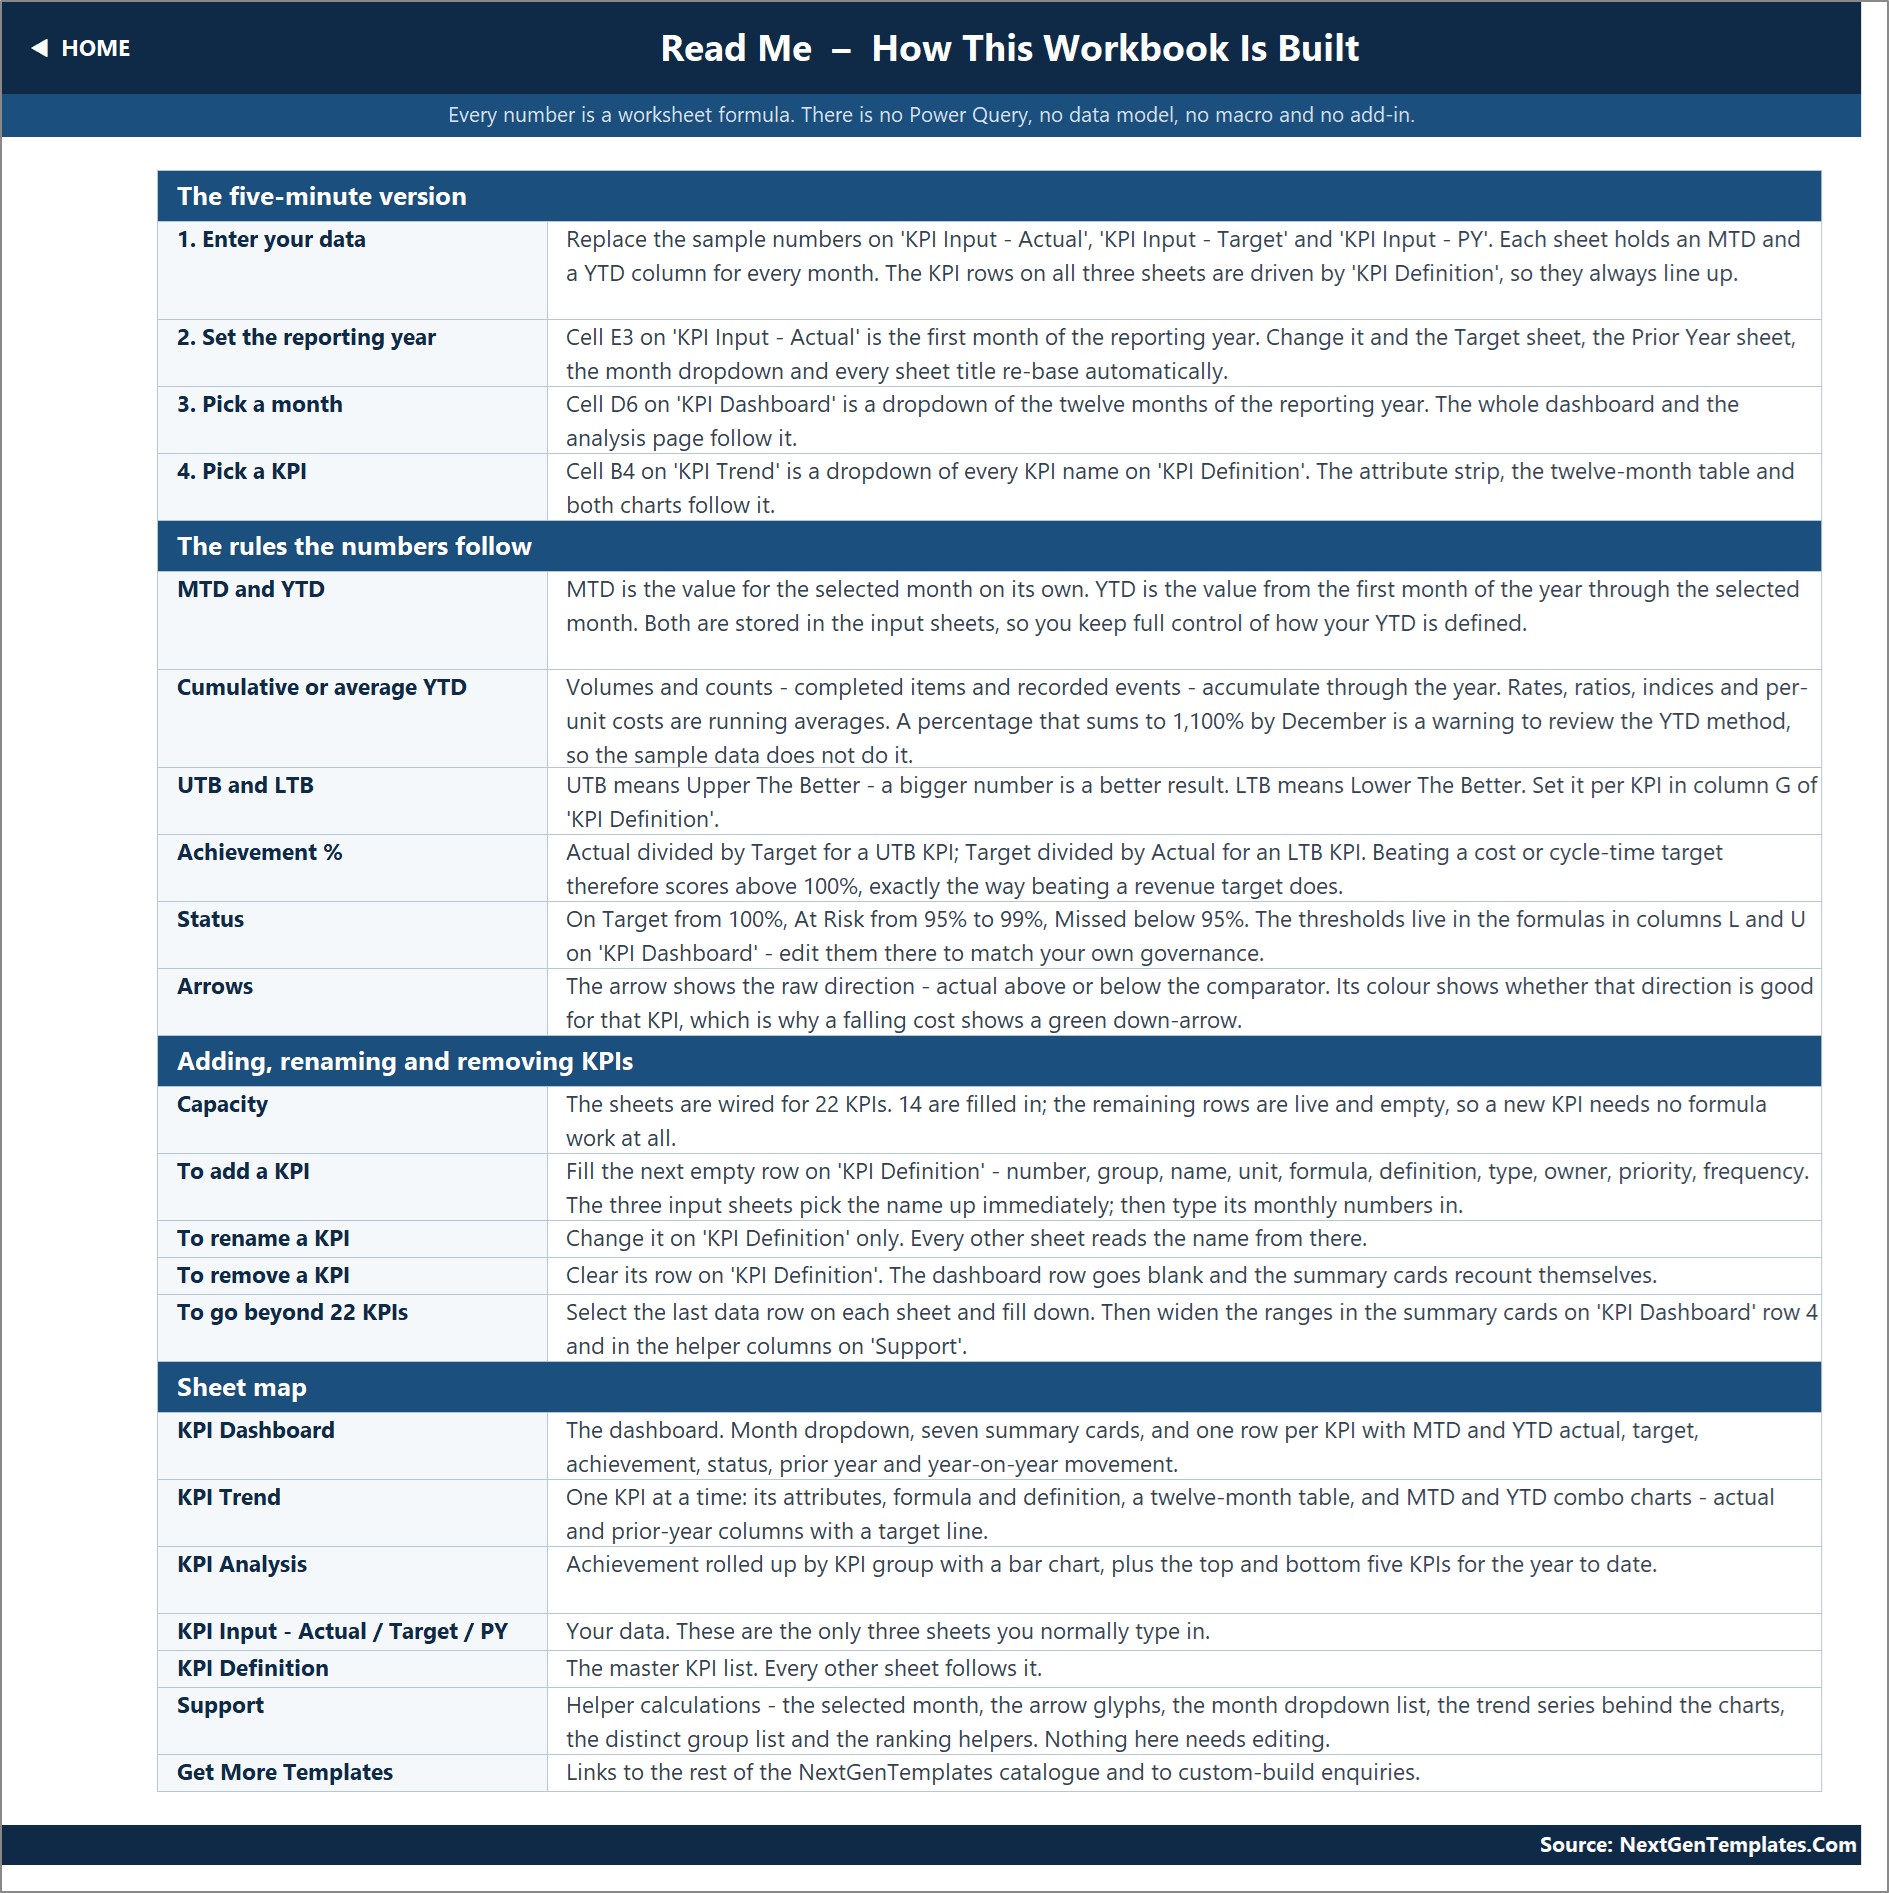
Read Me and Get More Templates
Read Me explains the five-minute setup, the MTD/YTD rules, UTB/LTB, the status thresholds and how to add, rename or remove KPIs. Get More Templates links to the wider NextGenTemplates catalogue.
This Car Wash KPI Template vs. Google Sheets Equivalent vs. Paid Car Wash Software – Feature Comparison
| Feature | This template | Google Sheets equivalent | Paid car wash management software |
|---|---|---|---|
| Cost | ✅ One-time purchase | Free to build, hours of setup | Monthly subscription per site |
| Platform | Microsoft Excel | Browser | Vendor cloud / hardware |
| Setup time | ✅ Under 30 minutes | Days to build | Weeks of onboarding |
| MTD, YTD and prior year per KPI | ✅ Built in | Build it yourself | Varies by plan |
| UTB / LTB direction scoring | ✅ Yes | Build it yourself | Rarely configurable |
| Custom KPIs | ✅ Up to 22, no formula edits | Yes, manual | Fixed report set |
| Live POS / tunnel data | No – monthly manual entry | No | ✅ Yes |
| Works offline | ✅ Yes | Limited | No |
For owners who want a monthly KPI review without paying for another platform, this car wash KPI template sits in the sweet spot.
Who Should Use This Template
Perfect for:
- Owners and site managers of express tunnel, flex-serve and self-serve car washes
- Membership leads who track capture rate, active members and churn every month
- Multi-site operators who want identical car wash KPIs per site (one copy per location)
Not a fit if:
- You need daily or live figures pulled automatically from a POS or tunnel controller
- You need booking, billing or membership management rather than KPI reporting
Real-World Use Cases
Marco owns a single express tunnel. At month end he types cars washed, ticket value, labor hours and survey results into the input sheets. KPI Analysis shows him that, in the sample year, Rewash Rate is the only Missed KPI at 92.3% YTD achievement – so the quality conversation comes first.
Dana runs memberships for a three-site operator. She keeps one workbook per site and opens KPI Trend for Membership Churn Rate before each owners’ meeting, reading the MTD and YTD charts against last year.
Luis is an operations manager. He watches Cars per Labor Hour, Labor Cost Ratio and Revenue per Labor Hour together to decide whether weekend staffing is paying off.
Advantages of This Car Wash KPI Dashboard
- One-time cost. No per-site subscription for monthly KPI reporting.
- Honest scoring. Churn, rewash and cost KPIs are scored the right way round.
- Fully editable. Every KPI name, formula text, owner and target is yours to change.
- Fast reviews. One dropdown, seven cards and a ranked top/bottom five make a monthly review a ten-minute job.
Opportunities for Improvement
- YTD is typed, not calculated. Both the MTD and the YTD column are inputs on all three input sheets. That gives you control (sum for Cars Washed, average for rates), but you must enter both each month and keep them consistent.
- Snapshot number format. The screenshots were captured on a PC with Indian regional settings, so large values appear as 1,14,228.00. The cells use a standard #,##0.00 format, which follows your own Windows regional settings.
- Counts show two decimals. Count KPIs such as Cars Washed display as 13,025.00; change the cell format if you prefer whole numbers.
- No data connection. The template does not connect to a POS, membership billing or tunnel controller, and it does not keep environmental, water-discharge or chemical-safety compliance records.
Best Practices
- Set the reporting year once in cell E3 on KPI Input – Actual before typing any data.
- Decide per KPI whether YTD is a sum or a running average, and note it in the definition.
- Enter targets for the whole year up front so At Risk flags appear early.
- Review the Bottom 5 table first each month; it is ranked on YTD achievement.
- Use the same KPI Definition list at every site so results compare cleanly.
If you are new to the features behind the month picker and lookups, Microsoft’s guides to creating a drop-down list and the VLOOKUP function explain both.
Explore Relevant Templates
- Pressure Washing Services KPI Dashboard in Excel – the same KPI dashboard design for mobile washing businesses.
- Laundromat Dashboard in Excel – an analytical dashboard for another self-service wash business.
- Auto Repair Dashboard in Excel and Car Dealership Dashboard in Excel – more automotive analysis.
- Car Wash Management System Web App – day-to-day operations, where this workbook is the monthly KPI review.
- Car Wash Business KPI Scorecard in Google Sheets – a different scorecard template with its own KPI set.
Frequently Asked Questions
What KPIs are in the Car Wash Business KPI Dashboard in Excel?
It ships with 14 car wash KPIs across Volume & Sales, Membership, Operations, Quality, Sustainability and Financial – including Cars Washed, Average Ticket Value, Membership Churn Rate, Equipment Uptime, Rewash Rate, Chemical Cost per Car and Revenue per Labor Hour.
How long does setup take?
Usually under 30 minutes. Set the first month in cell E3, check the KPI list on KPI Definition, then type or paste twelve months of MTD and YTD actuals, targets and prior-year values over the sample data.
Does the template calculate YTD for me?
No. In this template, YTD is a typed column beside each MTD column. That lets you sum volumes and average rates, but both values must be entered every month.
Can I add my own car wash KPIs?
Yes. The workbook is wired for 22 KPIs and 14 are filled. Add a row on KPI Definition with group, name, unit, formula, definition, type, owner, priority and frequency, and it appears on every sheet.
Does it connect to my POS or membership platform?
No. The template does not connect to a POS, tunnel controller or membership billing system. Enter the monthly figures from your own month-end reports.
How does it compare to paid car wash software?
Car wash software runs payments, memberships and the tunnel. This template is a one-time-purchase KPI review layer that adds targets, prior year and traffic-light status in a workbook you fully own.
About the Author
Built by PK – Microsoft Certified Professional with 15+ years of Excel, Google Sheets and Power BI experience. Founder of NextGenTemplates, reaching 300K+ subscribers across YouTube channels. Every template is hand-built and tested before release.
Conclusion
The Car Wash Business KPI Dashboard in Excel turns month-end numbers into a clear verdict for 14 KPIs: on target, at risk or missed, against both target and last year. It is simple to maintain, honest about direction, and yours to extend.
👉 Click here to Purchase the Car Wash Business KPI Dashboard in Excel
✅ Instant download · One-time payment · No subscription
🎥 Watch our tutorials: Youtube.com/@PK-AnExcelExpert
Last updated: September 2026