The Temp Staffing Dashboard in Excel tracks 5 high-level KPIs and 16 interactive charts across 5 analytical pages, with multi-criteria slicers for instant filtering by region, recruiter, client, industry, and worker type. Setup takes under 10 minutes — replace the sample data on the Data sheet, click Refresh All on the Data tab, and every KPI card and chart updates automatically.
Built for staffing agencies, RPO firms, and in-house recruiting teams who need a clear view of bill revenue, pay cost, and gross margin without paying $200 to $400 per user per month for Bullhorn or Avionté. Joined by 8,400+ teams across 40+ countries already using NextGenTemplates to replace SaaS subscriptions with one-time-purchase Excel, Google Sheets, and Power BI templates.
✅ Instant download · One-time payment of $17.99 · No subscription · No per-user fees · Lifetime access
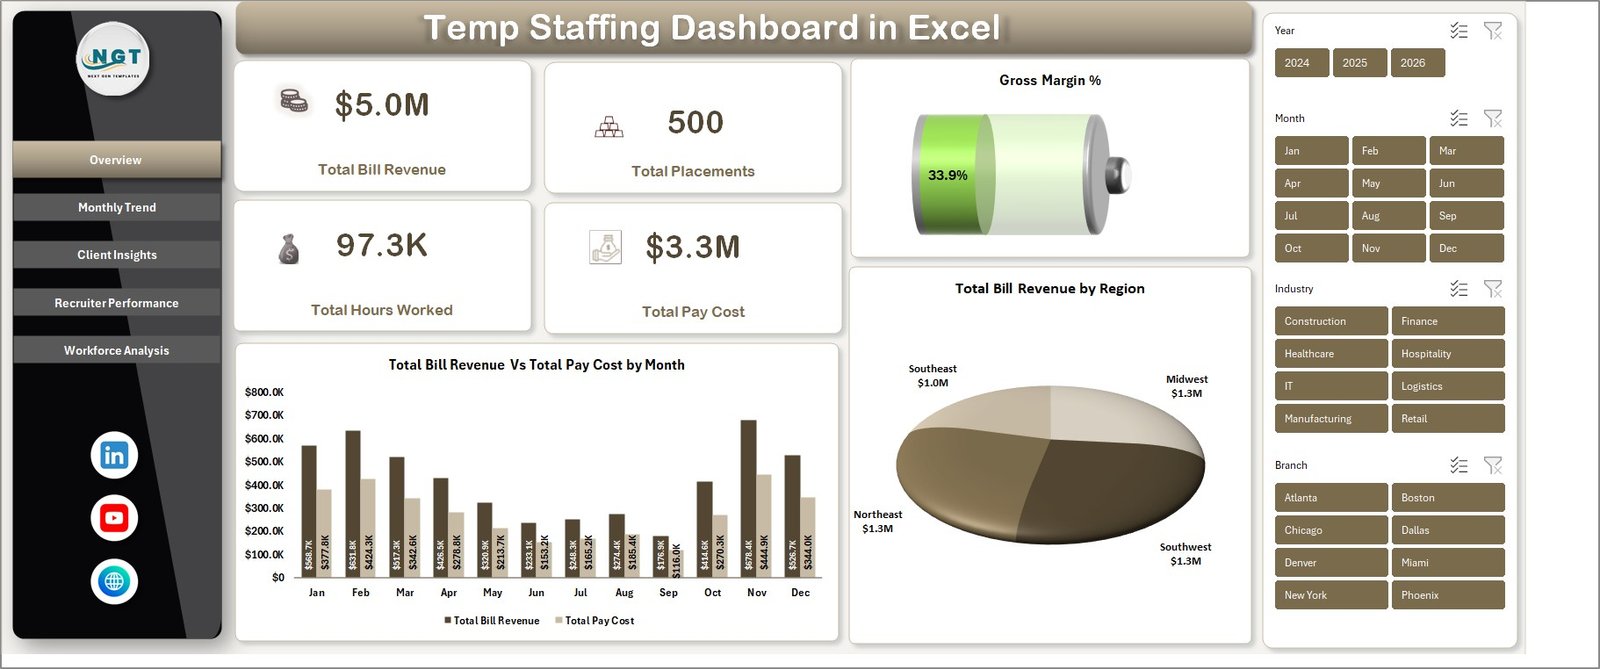
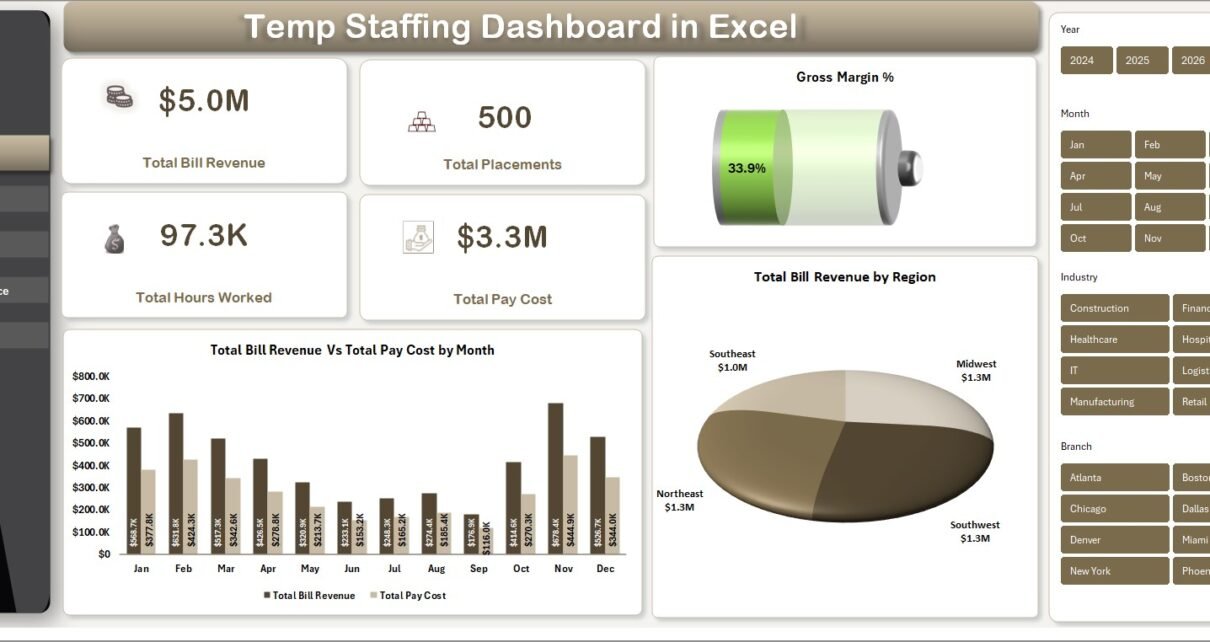
Temp Staffing Dashboard in Excel — Overview Page
Key Features of the Temp Staffing Dashboard in Excel
This template is built around the day-to-day questions a staffing operations lead asks: which recruiters are filling roles fastest, which clients drive the most billable revenue, and where the gross margin is leaking. Every page is wired to live pivot tables on the Support sheet, so the dashboard refreshes in seconds.
📊 5 KPI cards on the Overview page — Total Bill Revenue, Total Placements, Total Hours Worked, Total Pay Cost, and Gross Margin %. Each card pulls from the Data sheet through pivot tables, so updating sample data updates the cards.
📈 16 pre-built charts across 5 pages — covering month-over-month trends, client and industry concentration, recruiter productivity, and workforce composition by job category and skill level.
🎛️ Multi-slicer filtering — slicers for Region, Industry, Recruiter, Client, Worker Type, and Job Category let you isolate segments in one click. The dashboard then redraws against the filtered subset.
🔁 Pivot-driven architecture — all visuals reference pivots on the Support sheet. To add new placements, paste rows into the Data sheet and hit Data → Refresh All. No formulas to edit. Microsoft’s PivotTable documentation covers the underlying mechanics.
💼 Excel-native — no add-ins, no macros — works in Excel 2016, 2019, 2021, Microsoft 365, and Excel for Mac. No login, no subscription, no per-seat licensing.
Dashboard Pages Explanation
1. Overview Page
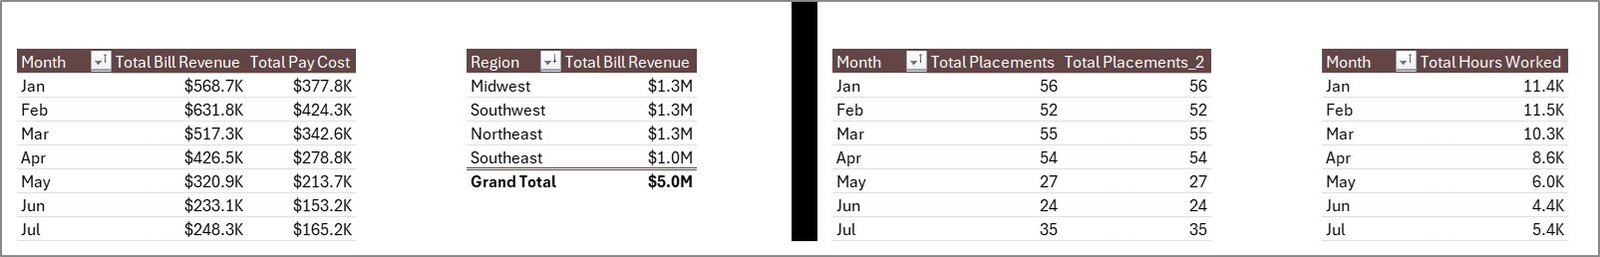
The Overview page is the executive snapshot. Five KPI cards across the top show Total Bill Revenue, Total Placements, Total Hours Worked, Total Pay Cost, and Gross Margin %. Below the cards, two charts give the immediate revenue and geographic picture:
🔹 Total Bill Revenue Vs Total Pay Cost by Month — a side-by-side comparison showing the spread between what you bill clients and what you pay temp workers, month by month. The gap is your gross margin.
🔹 Total Bill Revenue by Region — geographic concentration of revenue, helpful for deciding where to expand or where to redeploy recruiters.
Slicers above the visuals let you filter the entire page by Region, Industry, Recruiter, or Client in one click.
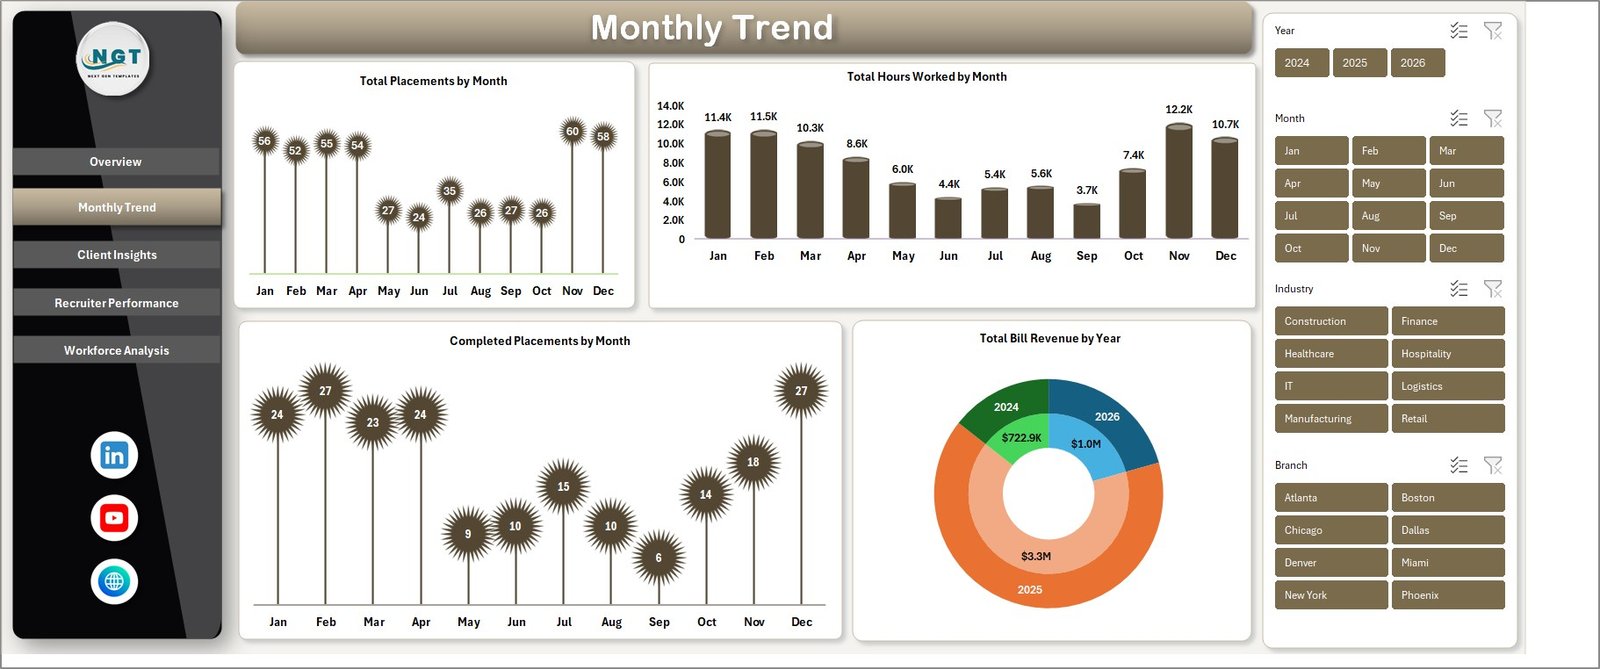
2. Monthly Trend
The Monthly Trend page shows seasonality and growth patterns staffing agencies live by. Charts on this page:
🔹 Total Placements by Month — placement volume over time, surfaces seasonal hiring spikes.
🔹 Total Hours Worked by Month — billable hours trend, the leading indicator for revenue.
🔹 Completed Placements by Month — only the placements that finished their assignment, separating churn from delivery.
🔹 Total Bill Revenue by Year — year-over-year revenue comparison for board reporting.
Monthly Trend
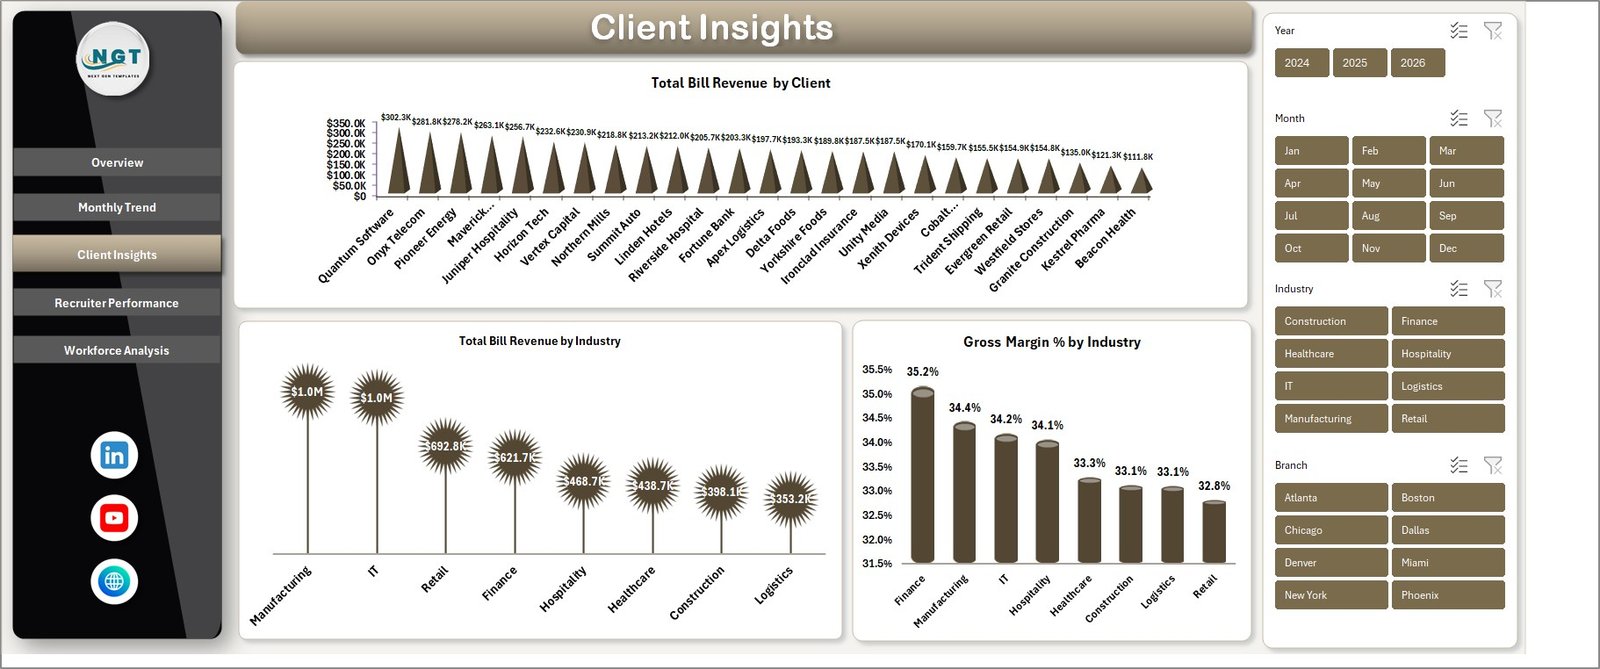
3. Client Insights
The Client Insights page tells you where your money actually comes from. Three charts:
🔹 Total Bill Revenue by Client — concentration risk in one chart. If your top three clients are 70% of revenue, you’ll see it here.
🔹 Total Bill Revenue by Industry — vertical mix across healthcare, IT, manufacturing, logistics, etc.
🔹 Gross Margin % by Industry — where the real profit is. High-volume industries aren’t always the most profitable.
Client Insights
4. Recruiter Performance
This is the page recruiting managers open first. Four charts evaluate every recruiter on the team:
🔹 Total Placements by Recruiter — raw output ranking.
🔹 Avg. Time to Fill by Recruiter — speed metric, days from req-open to placement.
🔹 Completion % by Recruiter — quality metric, how many placements finished the assignment.
🔹 Avg. Performance Rating by Recruiter — client-rated quality of placed candidates.

Recruiter Performance
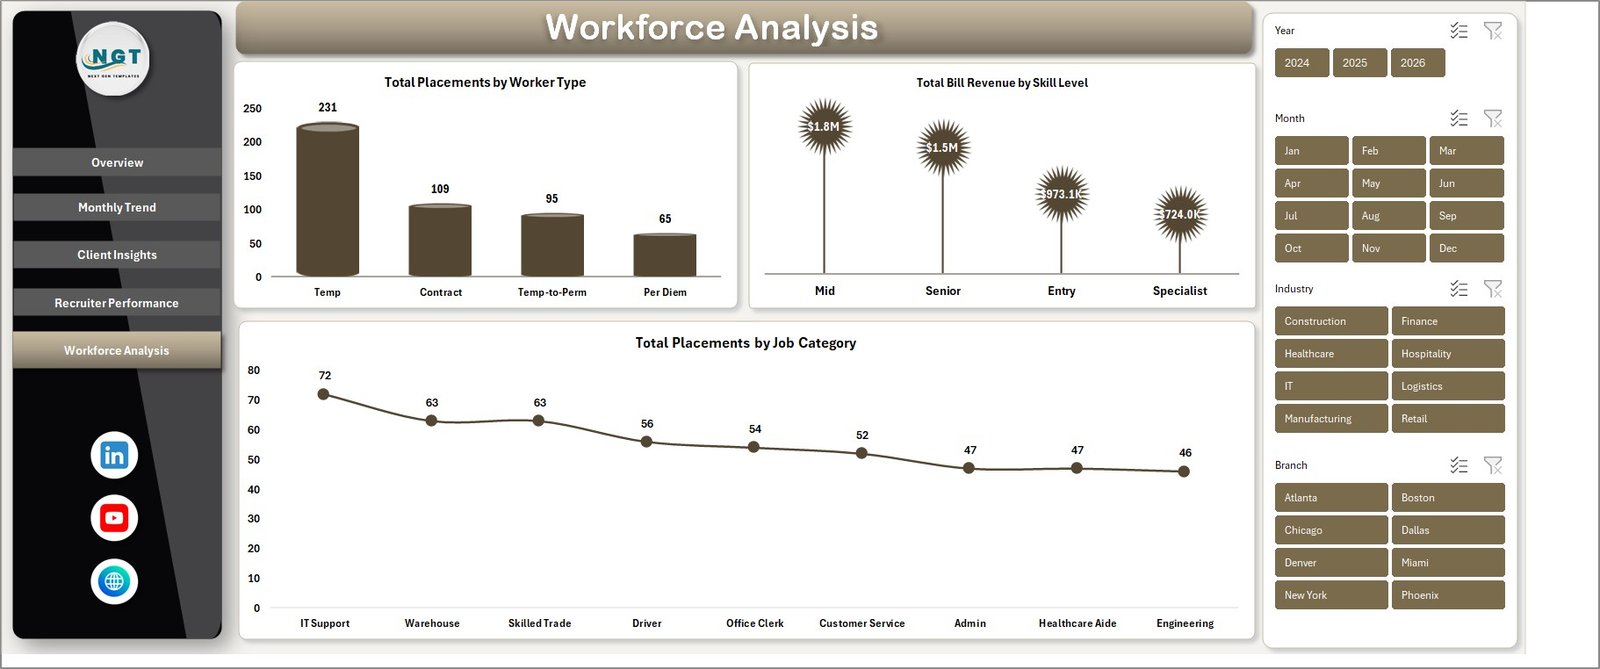
5. Workforce Analysis
The Workforce Analysis page profiles your temp roster — useful for capacity planning and bench management:
🔹 Total Placements by Worker Type — temp, contract-to-hire, direct-hire mix.
🔹 Total Bill Revenue by Skill Level — entry, mid, senior revenue contribution.
🔹 Total Placements by Job Category — admin, IT, healthcare, light industrial, etc.
Workforce Analysis
6. Data Sheet
This is where you replace the sample data with your own placement records. The columns are pre-formatted — keep the same headers and the dashboard will recognise the new rows when you refresh.
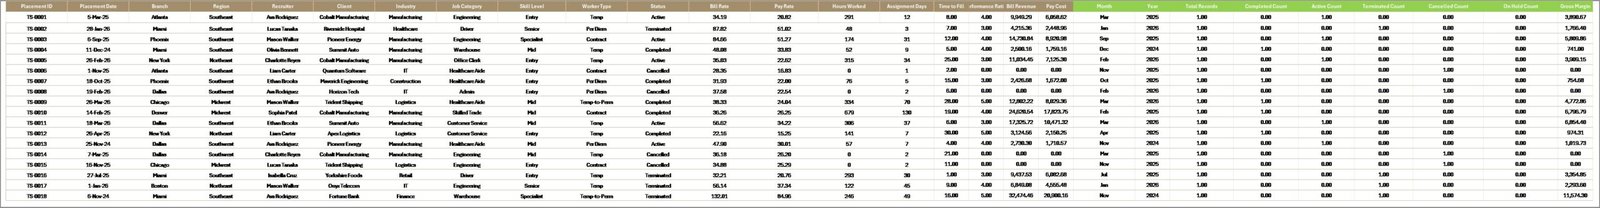
Data Sheet tab
7. Support Sheet
The Support sheet holds all the pivot tables that drive the dashboard. After updating the Data sheet, go to the Data tab on the Excel ribbon and click Refresh All — every pivot recalculates and every chart redraws. Once you understand the flow you can hide this sheet to keep the workbook clean.
Support sheet tab
Temp Staffing Dashboard in Excel vs. Google Sheets vs. Bullhorn — Feature Comparison
| Feature | Temp Staffing Dashboard in Excel | Google Sheets equivalent | Bullhorn / Avionté / TempWorks |
|---|---|---|---|
| Cost | $17.99 one-time | $9 to $20 one-time | $200 to $400 per user / month |
| Platform | Microsoft Excel (offline) | Google Sheets (browser) | Cloud SaaS |
| Setup time | Under 10 minutes | Under 10 minutes | 2 to 6 weeks implementation |
| Real-time team collaboration | Via OneDrive / SharePoint | ✅ Native | ✅ Native |
| Mobile access | Excel mobile app | ✅ Native browser | ✅ Native app |
| Recruiter performance tracking | ✅ 4 dedicated charts | ✅ 4 dedicated charts | ✅ Built-in module |
| Customisable fields and layout | ✅ Full control | ✅ Full control | Limited to vendor schema |
| Year-1 cost at 5 users | $17.99 | $9 to $20 | $12,000 to $24,000 |
| Vendor lock-in | None — your file | Google account required | High — proprietary database |
For staffing teams that need clean recruiter and margin reporting without paying enterprise SaaS prices or waiting six weeks for an implementation, the Temp Staffing Dashboard in Excel sits in the sweet spot.
Who Should Use This Template
✅ Perfect for:
- Independent staffing agencies with 5–50 internal recruiters tracking 100–2,000 active temp placements per year
- RPO and contingent workforce teams who need a quick reporting layer on top of their ATS data exports
- Operations managers building monthly board decks who want a CSV-to-dashboard pipeline that takes 10 minutes
- Healthcare, IT, and light-industrial staffing firms tracking margin pressure across multiple verticals
❌ Not a fit if:
- You need a full ATS with candidate sourcing, resume parsing, and email automation — buy Bullhorn or Avionté
- Your firm requires SOC 2, HIPAA, or audit-grade access controls — Excel files won’t satisfy compliance
- You run 10,000+ placements a month — the pivot model handles up to ~50,000 rows comfortably, beyond that performance degrades
- You want real-time API integration with VMS portals — that’s enterprise SaaS territory
Real-World Use Cases
Marcus runs a 22-recruiter healthcare staffing firm in Atlanta. Every Monday at 9 AM he opens the Temp Staffing Dashboard, refreshes against last week’s placement export from his ATS, and within five minutes has the recruiter scoreboard, top-five client revenue table, and gross margin % by industry ready for the operations stand-up. His firm bills $14M annually and used to pay $32,000/year for a Bullhorn analytics add-on before switching to this template plus a free Power BI viewer.
Priya is the operations lead at a 9-person IT contracting agency in Toronto. She uses the Recruiter Performance page to identify which recruiters consistently place candidates with above-4.0 client ratings, and uses that data to weight commission payouts. The Avg. Time to Fill chart helped her negotiate a faster SLA with two enterprise clients last quarter.
Daniel manages contingent labor for a manufacturing client with three plants. He filters the Workforce Analysis page by job category and skill level to forecast next month’s temp headcount needs, then uses the Total Bill Revenue Vs Total Pay Cost chart to defend the program’s ROI to his CFO every quarter. His total tooling cost: $17.99.
Advantages of the Temp Staffing Dashboard in Excel
🔹 One-time cost vs. recurring SaaS — at $17.99 versus $200+ per user per month for staffing platforms, payback is immediate.
🔹 No vendor lock-in — the file lives on your machine or your OneDrive. You own your data and your reporting logic.
🔹 Refresh-driven architecture — paste new placements into the Data sheet, click Refresh All, done. No formulas to maintain.
🔹 Recruiter-level visibility — four dedicated charts on the Recruiter Performance page mean compensation conversations are backed by data, not gut feel.
🔹 Margin-focused, not just volume-focused — most free staffing trackers count placements; this one shows Gross Margin % by Industry so you can defend pricing decisions.
Opportunities for Improvement
Honesty matters here. A few things this dashboard does not do:
🔸 It is not an ATS. Candidate sourcing, resume parsing, and email automation are out of scope.
🔸 It does not auto-import from ATS APIs. You’ll export a CSV from your system and paste rows into the Data sheet.
🔸 Data volume has a practical ceiling. Beyond ~50,000 placement rows the workbook starts to feel sluggish. For higher volumes, consider the Power BI version.
🔸 Real-time multi-user editing requires OneDrive or SharePoint. Native Excel desktop is single-user. Google Sheets handles concurrent editing more gracefully — see the Google Sheets staffing dashboard if real-time collaboration is critical.
Best Practices
To get the most out of this template, a few practical tips drawn from how staffing teams actually use it:
🔹 Standardise your ATS export schema first. The dashboard’s pivot tables expect specific column headers — keep them stable and your weekly refresh becomes a 30-second task.
🔹 Refresh All on a schedule, not ad-hoc. Run the refresh every Monday morning so the team always sees the same numbers in stand-ups.
🔹 Use slicers for client conversations. When a key account asks how many placements were filled last quarter, filter live in the meeting — it builds trust faster than emailing a static PDF.
🔹 Hide the Support sheet once you’re comfortable with the structure. It keeps the workbook clean for non-Excel users.
🔹 Save monthly snapshots as a PDF export. Year-over-year trend storytelling needs historical artifacts.
Explore Relevant Templates
Other staffing and recruitment templates from the same library you may want to pair with this dashboard:
🔗 Staffing Agency Dashboard in Excel — broader agency-wide view focused on placements and pipeline.
🔗 Recruitment Agencies KPI Dashboard in Excel — KPI-card-heavy executive scorecard.
🔗 Executive Search and Staffing Dashboard in Excel — tuned for retained executive search workflows.
🔗 Recruitment Agencies Dashboard in Excel — placement-funnel-focused alternative.
🔗 Onboarding Effectiveness KPI Dashboard in Excel — once they’re placed, track how well they ramp.
Also available as: Staffing Agency Dashboard in Google Sheets — same KPI logic in a real-time-collaboration-friendly format. Browse the full Excel Dashboard Templates library on NextGenTemplates.
Frequently Asked Questions
What KPIs does the Temp Staffing Dashboard in Excel track?
The Temp Staffing Dashboard in Excel tracks 5 high-level KPIs — Total Bill Revenue, Total Placements, Total Hours Worked, Total Pay Cost, and Gross Margin % — across 16 supporting charts on 5 analytical pages covering monthly trends, client insights, recruiter performance, and workforce composition.
How is the Temp Staffing Dashboard different from Bullhorn or Avionté?
Bullhorn and Avionté are full ATS and front-office platforms costing $200 to $400 per user per month. The Temp Staffing Dashboard in Excel is a $17.99 one-time reporting layer — no candidate sourcing, no email automation, but it gives you the same recruiter and margin reporting in 10 minutes.
How long does it take to set up the Temp Staffing Dashboard?
Under 10 minutes. Open the file in Excel, paste your placement records into the Data sheet using the same column structure as the sample, then click Data → Refresh All on the ribbon. Every KPI card and chart updates automatically against your data.
Does the Temp Staffing Dashboard work on Mac and in Microsoft 365?
Yes. The Temp Staffing Dashboard in Excel uses native Excel pivot tables and charts — no macros, no add-ins, no ActiveX. It runs on Excel 2016, 2019, 2021, Microsoft 365, and Excel for Mac. It also opens in Excel for the web with the same refresh workflow.
Can I customise the slicers, charts, and KPIs?
Yes — the Temp Staffing Dashboard in Excel is fully editable. You can rename slicers, add new chart fields from the pivot tables on the Support sheet, change the colour theme, or hide pages you don’t need. There’s no protected sheet or locked formulas.
How many placement records can the dashboard handle?
The Temp Staffing Dashboard in Excel handles up to roughly 50,000 placement rows comfortably with sub-second refresh times. Beyond that, performance starts to degrade and you’ll want to migrate the same KPI logic into the Power BI equivalent for better scaling.
What’s included in the download?
One Microsoft Excel (.xlsx) file with all 7 sheets pre-built — Overview, Monthly Trend, Client Insights, Recruiter Performance, Workforce Analysis, Data, and Support. Sample data is included so the dashboard renders immediately on first open. No subscription, no per-user fees, lifetime access.
About the Author
Built by PK — Microsoft Certified Professional with 15+ years of Excel, Google Sheets, and Power BI experience. Founder of NextGenTemplates, reaching 300K+ subscribers across YouTube channels (@PK-AnExcelExpert, @NextGenTemplates, @NeoTechNavigators). Every template is hand-built, tested with real staffing data, and refined based on customer feedback before release.
Conclusion
The Temp Staffing Dashboard in Excel gives staffing operations leaders, RPO managers, and agency owners a fast, owned, refresh-driven view of the metrics that actually drive the business — bill revenue, recruiter productivity, gross margin by industry, and workforce composition. At $17.99 one-time versus $12,000+ per year for SaaS staffing analytics, the math is straightforward.
👉 Click here to Purchase the Temp Staffing Dashboard in Excel
✅ Instant download · One-time payment · No subscription · No per-user fees
For step-by-step Excel dashboard tutorials, visit YouTube.com/@PK-AnExcelExpert.