Staffing Agency Dashboard in Excel is a comprehensive, pivot-table-powered analytics template designed for staffing and recruitment agencies that need to monitor placements, revenue, recruiter performance, client relationships, and industry-level insights — all from a single Excel workbook. With 5 interactive dashboard pages, 5 high-level KPI cards, dynamic charts, and slicer-based filtering, this template gives agency owners and recruitment managers everything they need to make faster, smarter, data-driven decisions.
Whether you’re tracking gross profit margins across recruiters, analyzing placement pipelines by candidate source, or comparing revenue by industry, this staffing dashboard consolidates your most critical metrics into a clean, professional interface. If you’re looking for a ready-to-use Excel solution purpose-built for the staffing industry, this template delivers immediate value from the moment you open it.
Key Features of Staffing Agency Dashboard in Excel
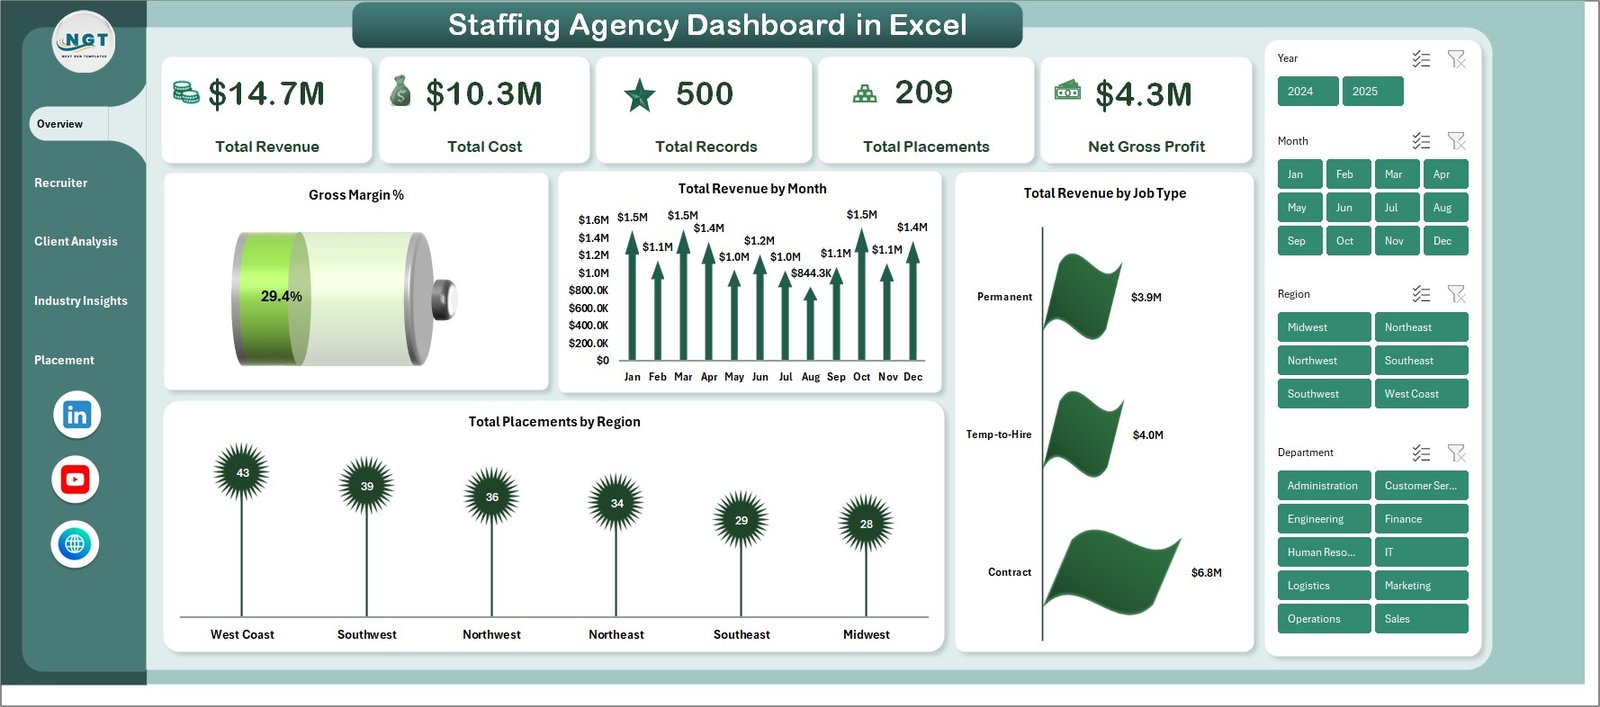
The Staffing Agency Dashboard in Excel includes 5 dedicated analysis pages that cover every critical dimension of staffing agency operations. The template tracks 5 KPI cards on the Overview page — Total Revenue, Total Cost, Total Records, Total Placements, and Net Gross Profit. Multiple dynamic charts visualize Gross Margin%, Total Revenue by Month, Total Revenue by Job Type, and Total Placements by Region.
The Recruiter Performance page breaks down individual recruiter metrics including Net Gross Profit by Recruiter, Average Satisfaction by Recruiter, and Average Time To Fill by Recruiter. The Client Analysis page compares Total Records vs Total Placements by Client Company, visualizes Total Revenue by Industry, and tracks Average Satisfaction by Client Company. Built-in slicers on the Overview page allow you to filter the entire dashboard by region, job type, industry, recruiter, and other dimensions in real time.
- 5 Interactive Dashboard Pages: Overview, Recruiter Performance, Client Analysis, Industry Insights, Placement Pipeline
- 5 KPI Cards tracking Total Revenue, Total Cost, Total Records, Total Placements, Net Gross Profit
- Recruiter-level analysis: Net Gross Profit, Avg. Satisfaction, Avg. Time To Fill
- Client-level insights: Records vs Placements, Revenue by Industry, Satisfaction by Client
- Industry breakdown: Gross Profit by Industry, Records by Industry, Placements by Department
- Pipeline tracking: Records by Status, Placements by Source, Monthly Trends, Revenue by Source
- Pivot-table powered Support Sheet with one-click Refresh All
- Dynamic slicers for instant dashboard filtering
Dashboard Pages Explained
1. Overview Page
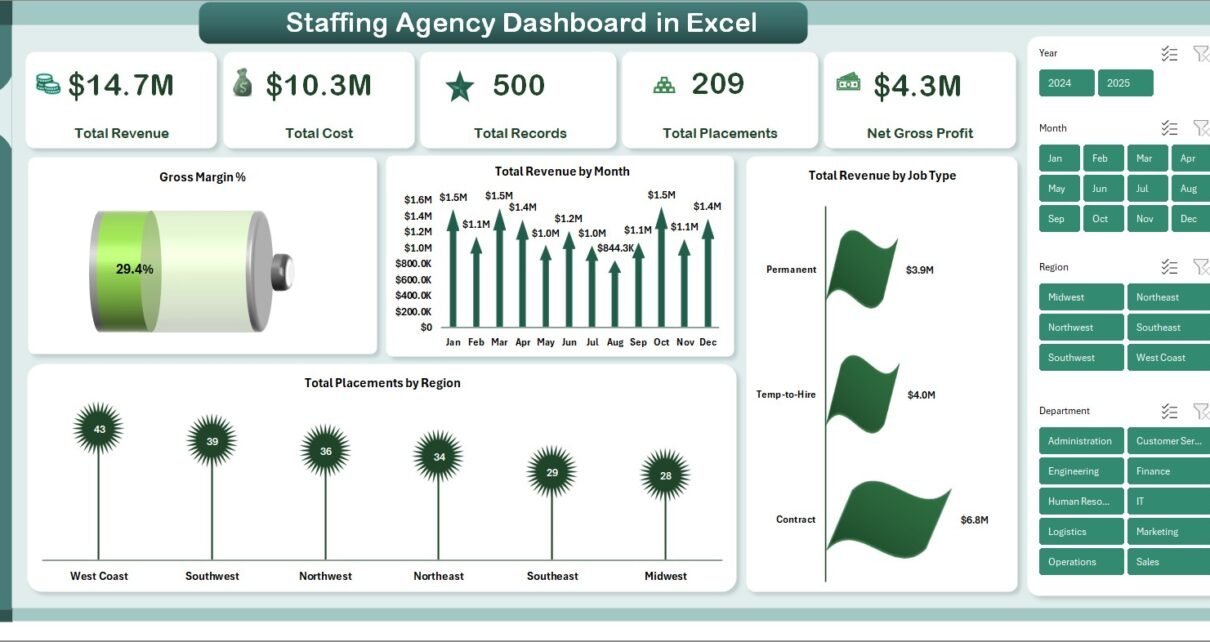
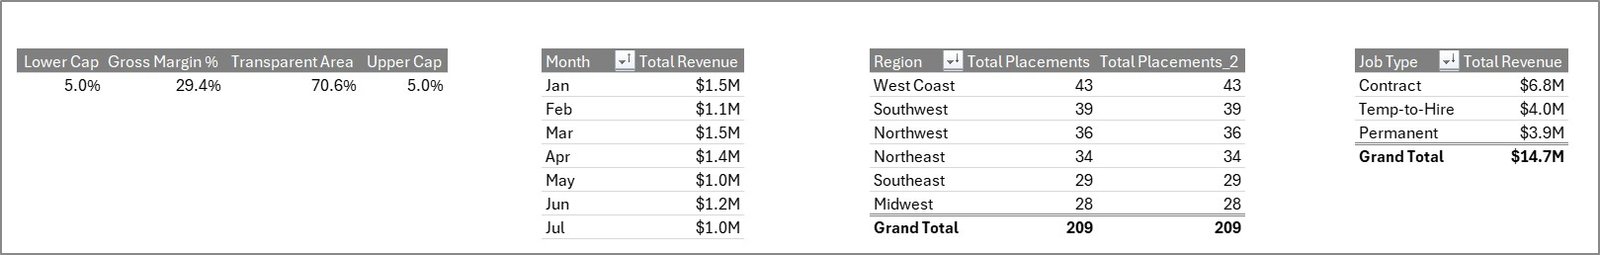
The Overview page serves as the command center of the Staffing Agency Dashboard in Excel. At the top, you’ll find 5 KPI cards displaying Total Revenue, Total Cost, Total Records, Total Placements, and Net Gross Profit. Below, dynamic charts visualize Gross Margin%, Total Revenue by Month, Total Revenue by Job Type, and Total Placements by Region. Multiple slicers are positioned to let you filter the entire dashboard by any combination of dimensions instantly.
Staffing Agency Dashboard in Excel
2. Recruiter Performance
The Recruiter Performance page provides a detailed breakdown of individual recruiter metrics. Charts display Net Gross Profit by Recruiter, Average Satisfaction by Recruiter, and Average Time To Fill by Recruiter. This page helps agency managers quickly identify top performers, spot coaching opportunities, and allocate resources more effectively across the recruitment team.
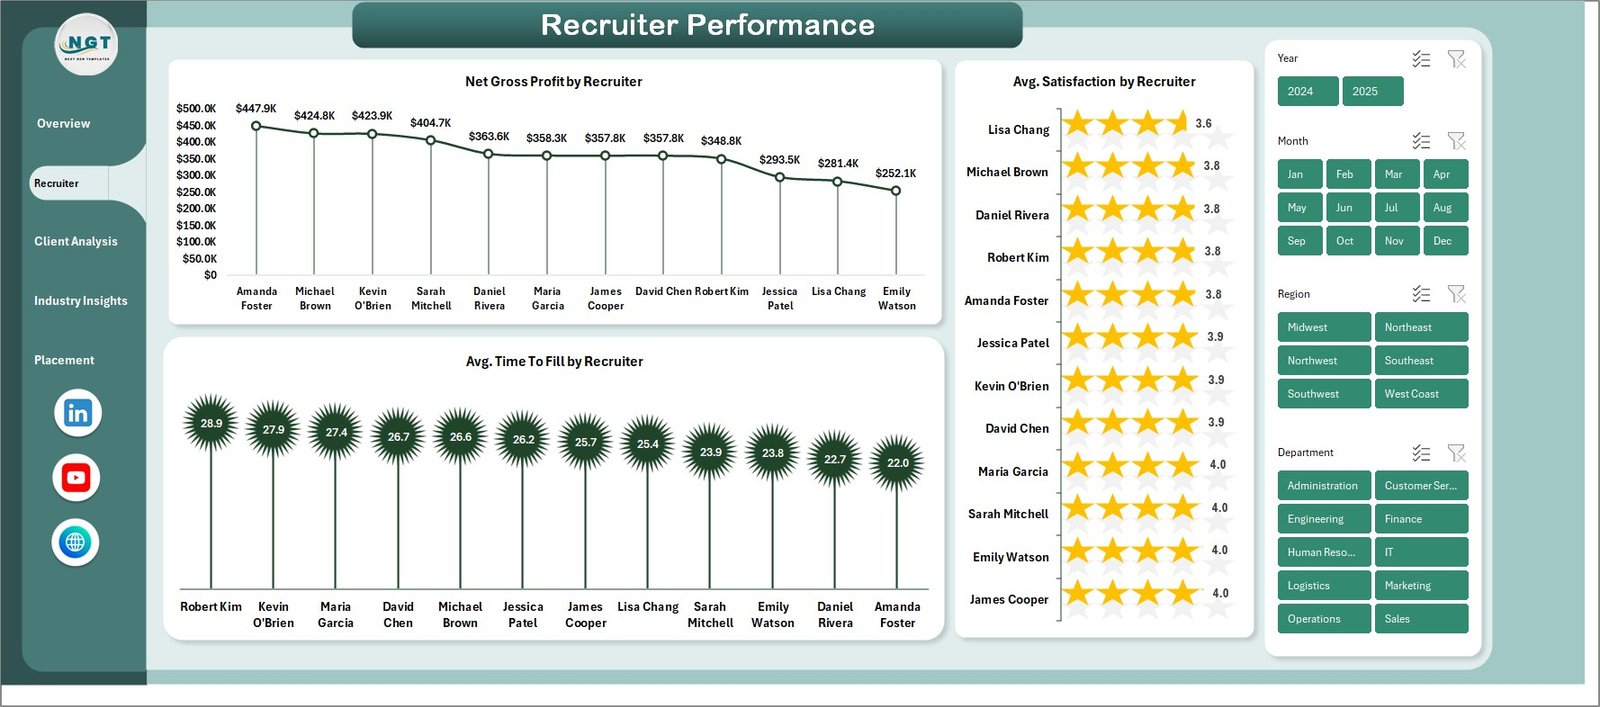
Recruiter Performance
3. Client Analysis
The Client Analysis page helps you understand your client relationships at a deeper level. It compares Total Records vs Total Placements by Client Company to reveal conversion efficiency, visualizes Total Revenue by Industry to show which sectors drive the most business, and tracks Average Satisfaction by Client Company to help prioritize high-value relationships and address potential churn risks.
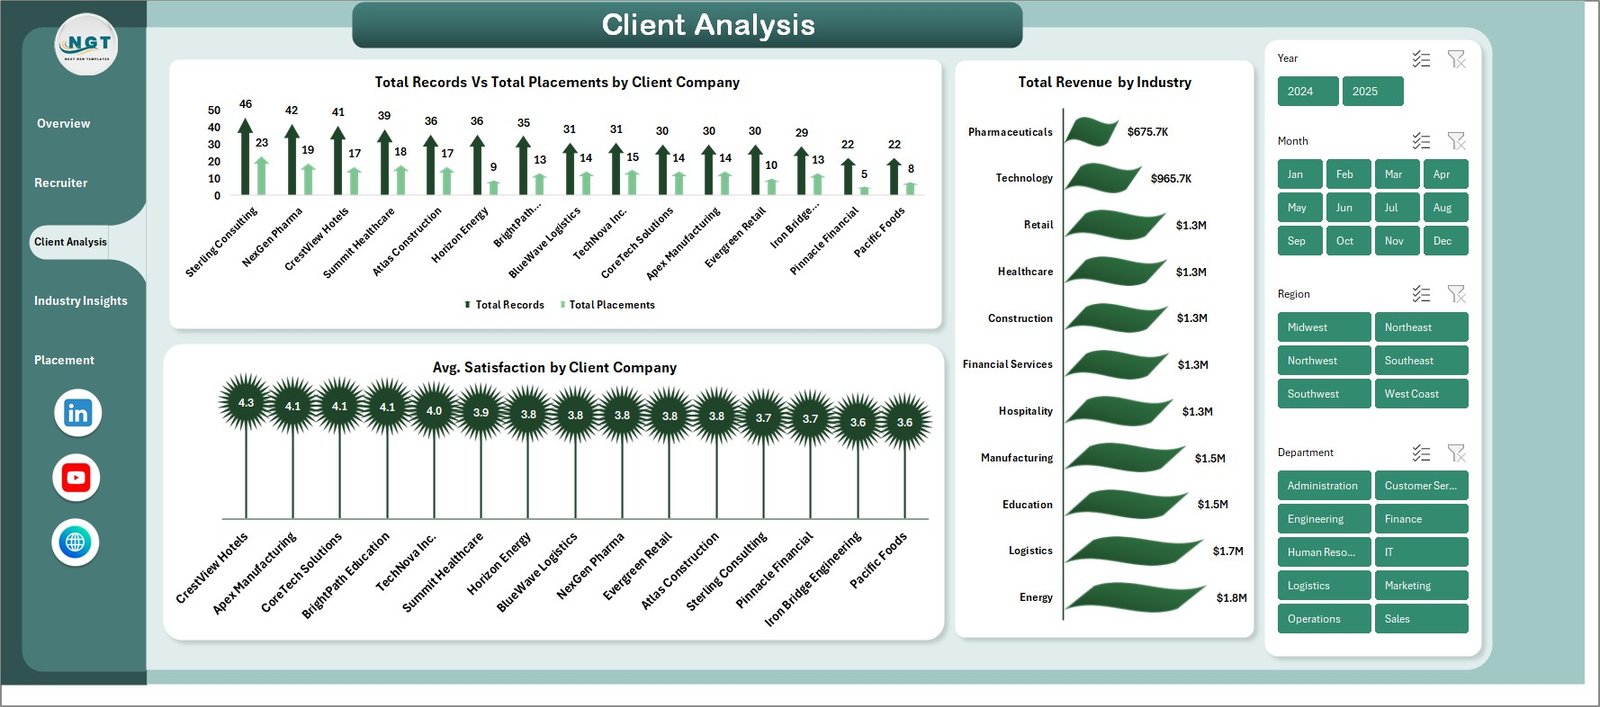
Client Analysis
4. Industry Insights
The Industry Insights page analyzes your staffing data from a market perspective. Charts display Net Gross Profit by Industry, Total Records by Industry, Total Placements by Department, and Total Revenue vs Total Cost by Department. This strategic view helps agency leaders decide which industries to expand into and which departments generate the highest margins.
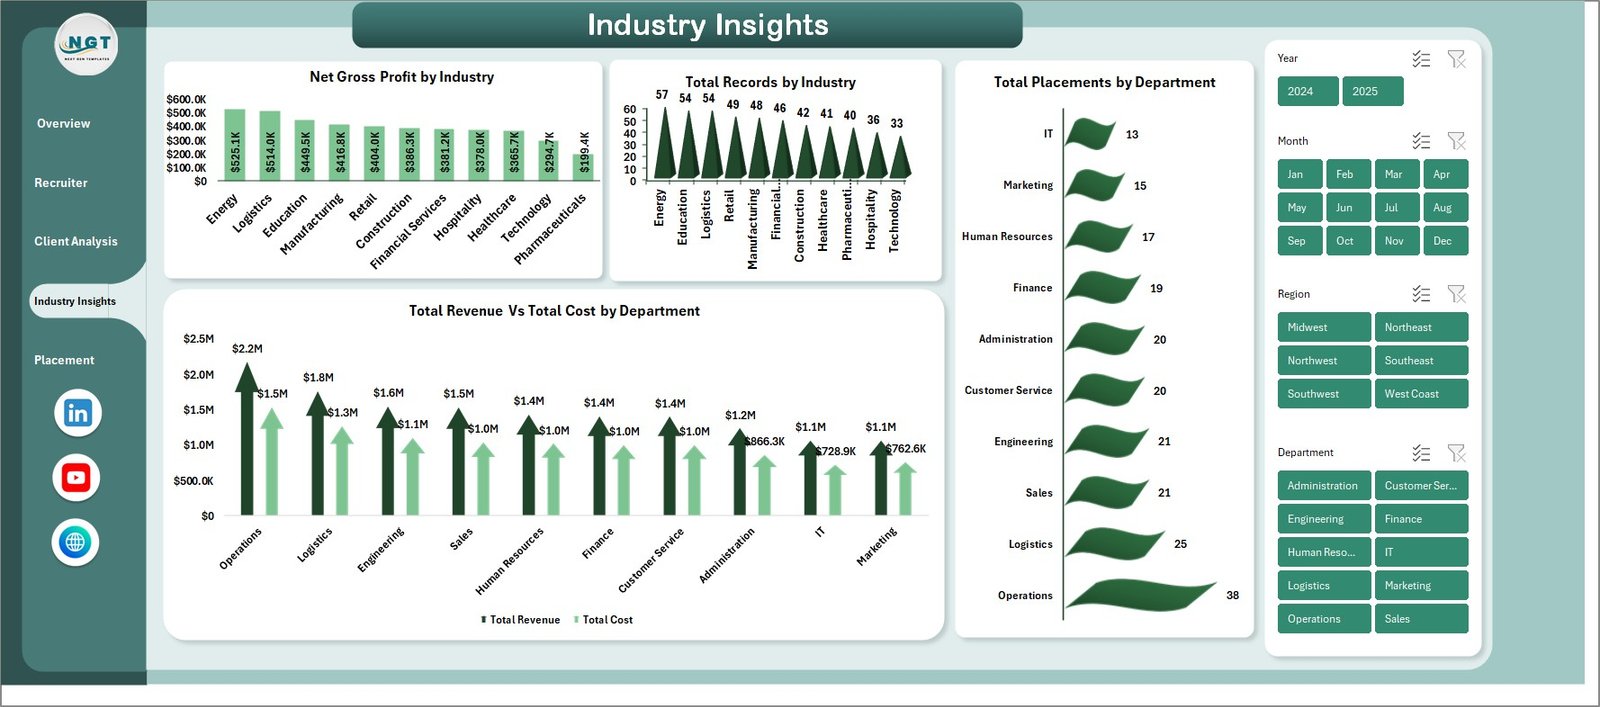
Industry Insights
5. Placement Pipeline
The Placement Pipeline page tracks your recruitment funnel from sourcing through placement. It visualizes Total Records by Status, Total Placements by Candidate Source, Total Placements by Month, and Total Revenue by Candidate Source. Use this page to optimize your sourcing strategy, identify which channels deliver the most placements, and track pipeline velocity over time.

Placement Pipeline
6. Data Sheet
The Data Sheet is where you enter your staffing records. All columns are pre-formatted, and the dashboard pulls data directly from this sheet. Simply replace the sample data with your own records — maintaining the same column format — and all 5 dashboard pages will update automatically when you refresh.
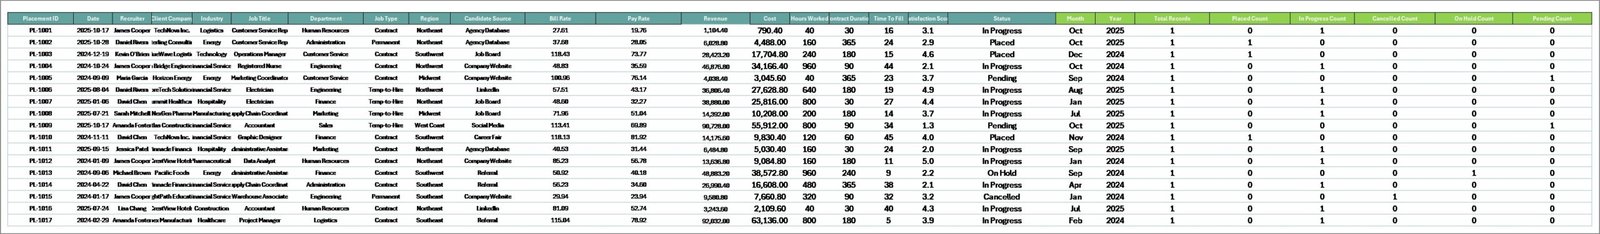
Data Sheet Tab
7. Support Sheet
The Support Sheet contains all the pivot tables that power the entire dashboard. After updating your data in the Data Sheet, navigate to the Data tab in the Excel Ribbon and click Refresh All. Every pivot table and chart across all 5 dashboard pages will update instantly. You can keep this sheet hidden for a cleaner user experience.
Support Sheet Tab
Advantages of Staffing Agency Dashboard in Excel
This dashboard offers several key advantages for staffing professionals. It eliminates the need for expensive BI tools by delivering powerful analytics entirely within Microsoft Excel. The pivot-table architecture means zero manual formula maintenance — just refresh and go. The 5-page structure organizes your data logically, so you never have to scroll through a single cluttered dashboard trying to find what you need.
The slicer-based filtering system lets you drill into specific regions, job types, industries, or recruiters without modifying any data. And because the template ships with sample data, you can explore every feature before entering your own records. Compared to the Executive Search and Staffing Dashboard in Excel, this template focuses specifically on agency-wide pipeline management, making it ideal for operations-focused teams.
Opportunities for Improvement
While the dashboard covers most staffing analytics needs, there are a few areas where users might want to extend it. Adding a dedicated financial forecasting page with projected revenue based on pipeline status could help with budget planning. A time-series comparison feature showing year-over-year performance trends would benefit agencies with historical data. Users with very large datasets (10,000+ records) may want to consider the Staffing Dashboard in Power BI for better performance at scale.
Best Practices for Using This Dashboard
To get the most value from the Staffing Agency Dashboard in Excel, follow these best practices. First, maintain consistent data entry in the Data Sheet — use standardized recruiter names, client names, and industry categories to ensure accurate pivot table grouping. Second, refresh all pivot tables after every data update by clicking Data → Refresh All in the Excel Ribbon. Third, use slicers strategically — filter by a single recruiter to build performance reviews, or filter by industry to prepare client pitch decks.
Schedule a weekly or monthly cadence for data entry and review to build a habit of data-driven decision-making. If you manage multiple branches or regions, add a Region column to your data to enable geographic filtering. Finally, keep the Support Sheet hidden to give end users a cleaner experience when navigating between dashboard pages.
Explore Relevant Templates
If you found this staffing dashboard valuable, explore these related templates for a complete recruitment analytics toolkit:
- Staffing Agency Dashboard in HTML — Browser-based staffing analytics with interactive filters, data export, and zero installation required
- Executive Search and Staffing Dashboard in Excel — A complementary perspective on executive search metrics and placement analytics
- Recruitment Agencies KPI Dashboard in Excel — Focused KPI scorecard for recruitment agencies with targeted metric tracking
- Recruitment Agencies Dashboard in Power BI — Full-featured recruitment analytics with Power BI’s advanced visualization capabilities
- Recruitment Agencies Dashboard in Excel — Comprehensive recruitment analytics with detailed placement tracking and candidate sourcing metrics
Frequently Asked Questions
What is the best Excel template for tracking staffing agency KPIs?
The Staffing Agency Dashboard in Excel is one of the best Excel templates for tracking staffing agency KPIs. It tracks 5 core metrics — Total Revenue, Total Cost, Total Records, Total Placements, and Net Gross Profit — along with Gross Margin%, recruiter satisfaction scores, time-to-fill metrics, and placement pipeline data across 5 dedicated dashboard pages.
How do I update the data in this staffing dashboard?
Go to the Data Sheet tab, replace the sample data with your own staffing records in the same column format, then navigate to the Data tab in Excel’s Ribbon and click Refresh All. All pivot tables and charts across all 5 dashboard pages will update automatically.
Can I use this dashboard for multiple recruiters and offices?
Yes. The dashboard supports multiple recruiters, clients, industries, regions, and departments. The built-in slicers on the Overview page let you filter by any of these dimensions. The Recruiter Performance page specifically breaks down metrics by individual recruiter for side-by-side comparison.
What Excel version do I need for this template?
This template works best with Microsoft Excel 2016 or later. It uses pivot tables and slicers which are standard Excel features — no VBA, macros, or add-ins required. It is not compatible with Google Sheets due to the pivot table and slicer functionality.
How is this different from the Recruitment Agencies Dashboard in Excel?
The Staffing Agency Dashboard in Excel focuses on agency-wide operations including recruiter performance, client analysis, industry insights, and placement pipeline tracking with 5 dedicated pages. The Recruitment Agencies Dashboard offers a different analytical structure. Both templates complement each other for comprehensive staffing and recruitment analytics.
Is there a Power BI version of this staffing dashboard?
While there isn’t an exact Power BI replica of this specific template, the Executive Search and Staffing Dashboard in Power BI and Recruitment Agencies Dashboard in Power BI offer staffing analytics with Power BI’s advanced visualization capabilities.
Conclusion
The Staffing Agency Dashboard in Excel is a must-have tool for any staffing or recruitment agency that wants to move beyond spreadsheet chaos and into structured, visual analytics. With 5 interactive pages covering everything from high-level KPIs to granular recruiter and client metrics, this template saves hours of manual reporting while giving you the insights needed to grow your business strategically.
Click here to Purchase Staffing Agency Dashboard in Excel
For more Excel dashboard tutorials, templates, and guides, visit our YouTube channel:
👉 Youtube.com/@PK-AnExcelExpert
Also explore the full collection of HR & Payroll Templates and Excel Dashboard Templates at NextGenTemplates.com for more ready-to-use solutions.