Postal services connect businesses, governments, and citizens every single day. However, managing thousands of deliveries, parcels, customer complaints, and operational targets requires strong performance tracking. Without a structured system, managers struggle to monitor delivery timelines, revenue growth, service quality, and operational efficiency.
So, how can postal departments track performance clearly and make better decisions?
The answer is simple.
You need a Postal Services KPI Dashboard in Excel.
In this article, we explore everything about the Postal Services KPI Dashboard in Excel. Moreover, we explain how it works, why postal organizations need it, what KPIs to track, and how to use it effectively. In addition, you will learn the advantages, best practices, and frequently asked questions about this ready-to-use Excel template.
Let us explore step by step.
Click to Purchases Postal Services KPI Dashboard in Excel
What Is a Postal Services KPI Dashboard in Excel?
A Postal Services KPI Dashboard in Excel is a structured performance tracking tool built inside Microsoft Excel. It allows postal departments to monitor key performance indicators (KPIs) monthly and yearly in one centralized dashboard.
Instead of reviewing multiple sheets and reports, managers select a month from a drop-down list and instantly see:
MTD (Month-to-Date) performance
YTD (Year-to-Date) performance
Target vs Actual comparison
Previous Year comparison
Performance indicators using up/down arrows
As a result, leaders make faster decisions. Moreover, teams identify gaps quickly and improve operational efficiency.
Why Do Postal Services Need a KPI Dashboard?
Postal organizations handle large volumes daily. They manage:
Parcel deliveries
Registered mail
Speed post services
Customer complaints
Revenue targets
Operational costs
Service level agreements
However, without structured monitoring, problems grow unnoticed. Therefore, organizations need a dashboard that provides:
Clear visibility
Real-time performance tracking
Monthly and yearly comparisons
Data-driven decision support
Furthermore, Excel remains accessible and easy to use. Most postal departments already use Excel, so they can adopt this dashboard immediately.
What Are the 7 Worksheets Inside the Postal Services KPI Dashboard?
This ready-to-use Postal Services KPI Dashboard in Excel includes 7 structured worksheets. Each sheet plays a specific role in performance tracking.
Let us explore each one clearly.
1️⃣ What Is the Home Sheet?
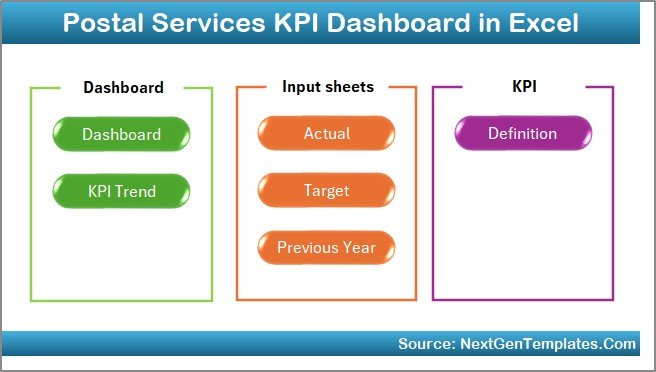
The Home Sheet acts as the navigation center.
It includes:
6 navigation buttons
Quick access to all sheets
Clean and user-friendly layout
Therefore, users do not waste time searching for sheets. Instead, they click and jump directly to the required section.
2️⃣ What Is the Dashboard Sheet Tab?
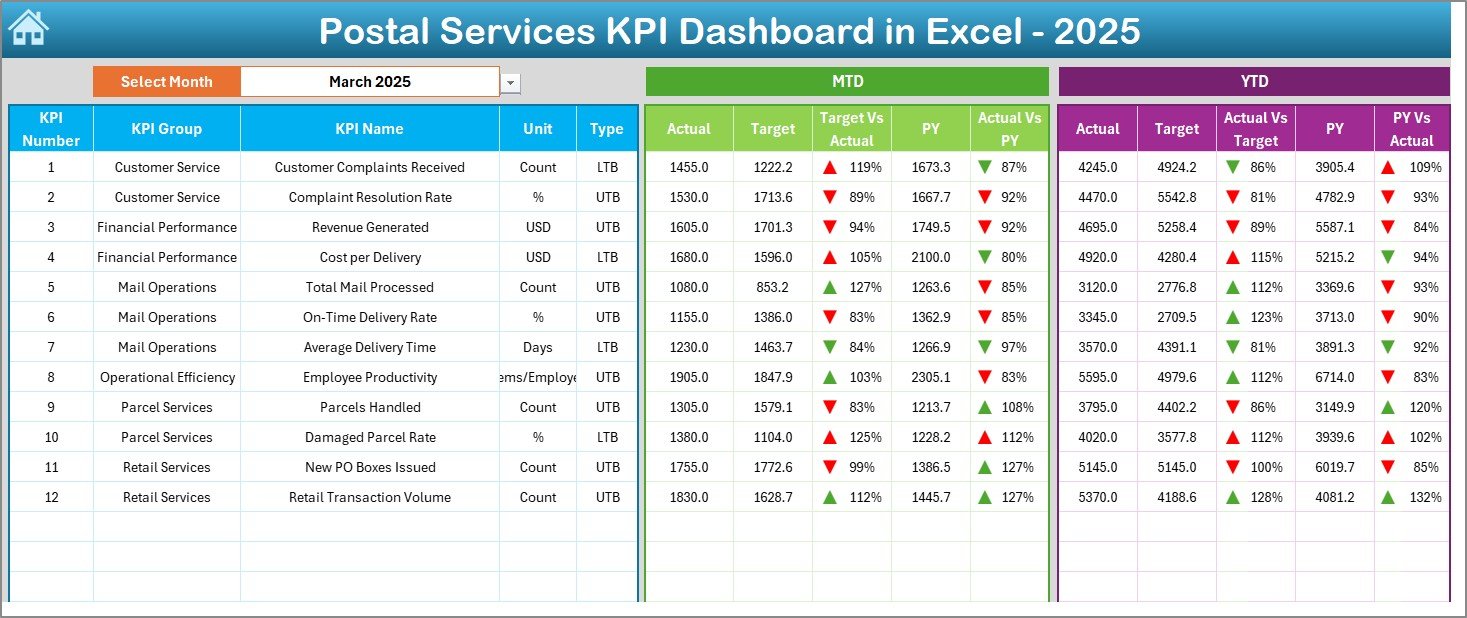
The Dashboard Sheet is the main performance screen.
Here, you can:
Select the month from cell D3
View MTD Actual, Target, and Previous Year values
View YTD Actual, Target, and Previous Year values
See Target vs Actual variance
See Previous Year vs Actual comparison
Identify performance using conditional formatting arrows
Because the dashboard updates automatically when you change the month, you get instant insights.
What Does MTD Show?
MTD (Month-to-Date) shows current month performance. For example:
Parcels delivered this month
Revenue generated this month
Complaints resolved this month
What Does YTD Show?
YTD (Year-to-Date) shows cumulative performance from the start of the year.
Click to Purchases Postal Services KPI Dashboard in Excel
Therefore, managers track long-term progress easily.
3️⃣ What Is the KPI Trend Sheet Tab?
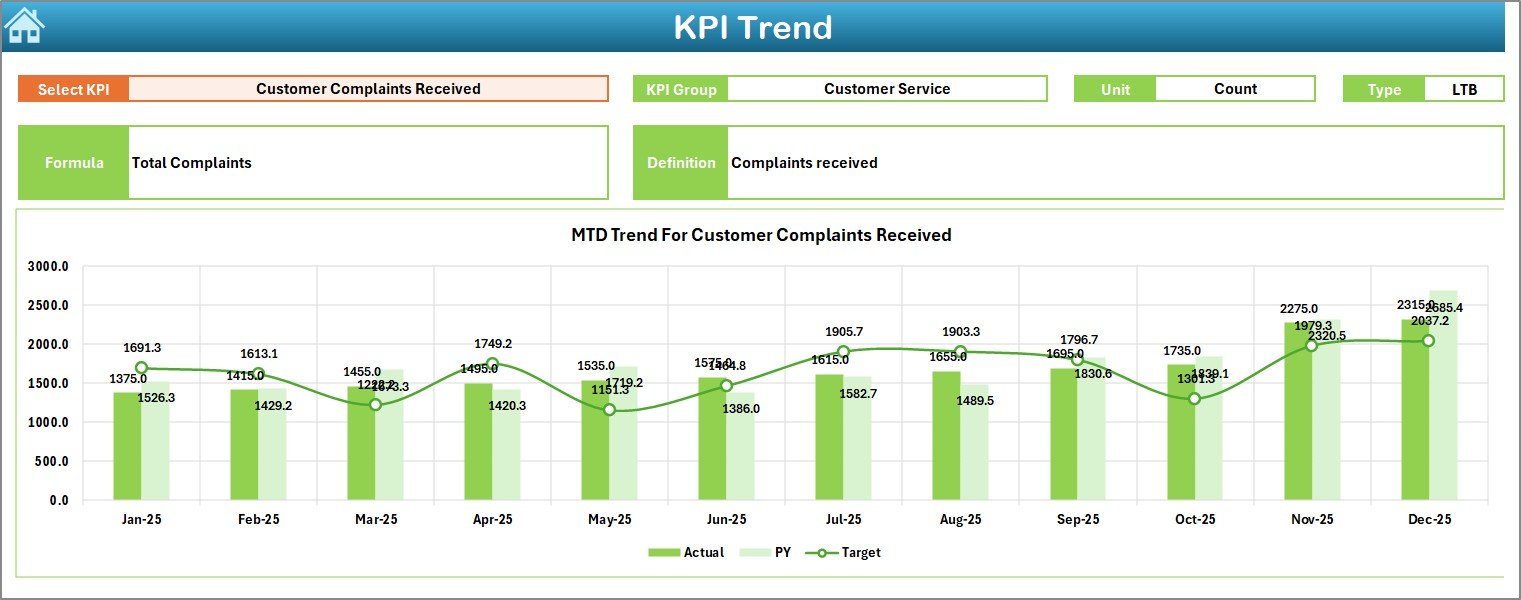
The KPI Trend Sheet provides detailed KPI analysis.
Here, you select a KPI from cell C3. Then, the sheet displays:
KPI Group
KPI Unit
KPI Type (Lower the Better / Upper the Better)
KPI Formula
KPI Definition
In addition, it shows:
MTD trend chart (Actual vs Target vs Previous Year)
YTD trend chart (Actual vs Target vs Previous Year)
Therefore, managers do not just see numbers. Instead, they understand patterns and trends.
For example:
Delivery success rate trend
Customer satisfaction trend
Revenue growth trend
As a result, teams identify improvement areas quickly.
4️⃣ What Is the Actual Numbers Input Sheet?
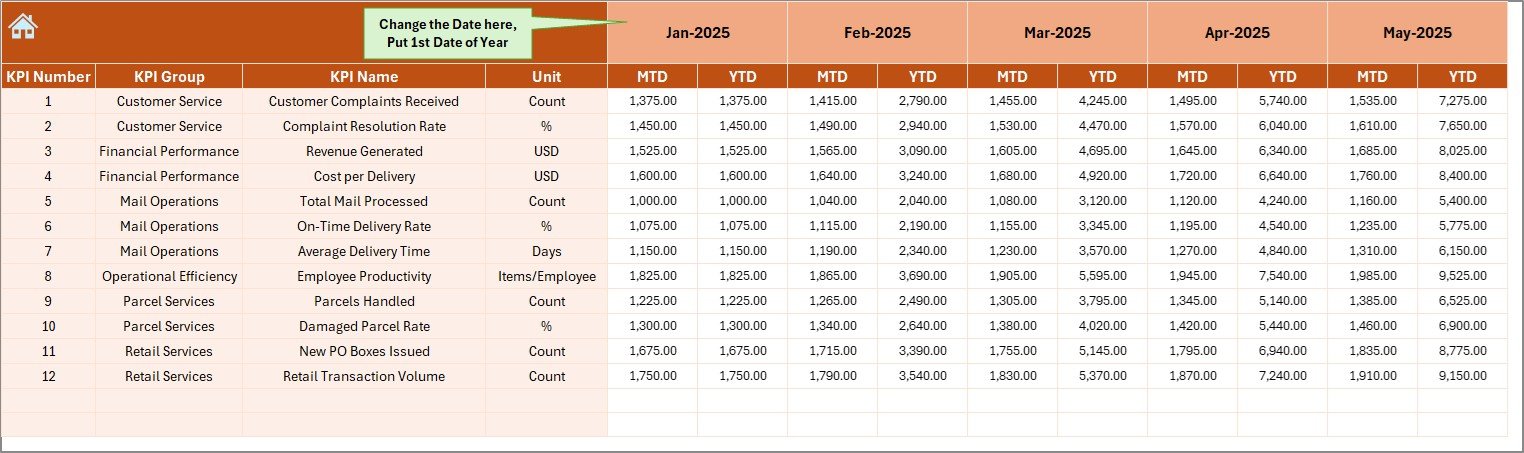
The Actual Numbers Input Sheet stores current year data.
You enter:
MTD values
YTD values
Monthly numbers
You can change the first month from cell E1. After that, the dashboard adjusts automatically.
Therefore, data entry remains simple and structured.
5️⃣ What Is the Target Sheet Tab?
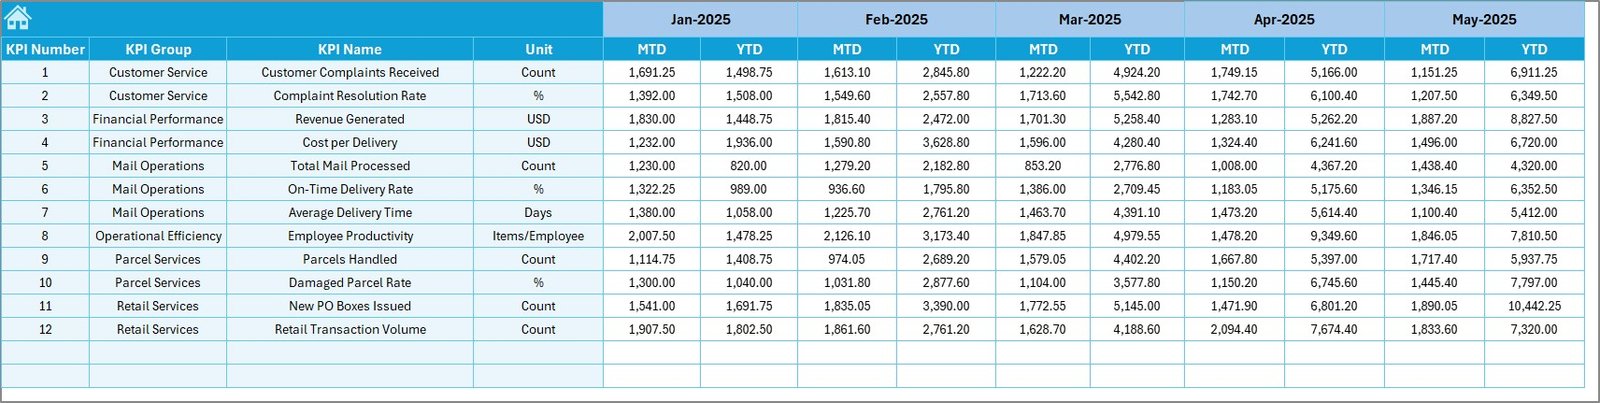
The Target Sheet stores planned values.
Here, you enter:
Monthly MTD targets
Yearly YTD targets
Because targets define performance expectations, this sheet plays a crucial role. Managers compare actual performance against planned goals instantly.
6️⃣ What Is the Previous Year Number Sheet?
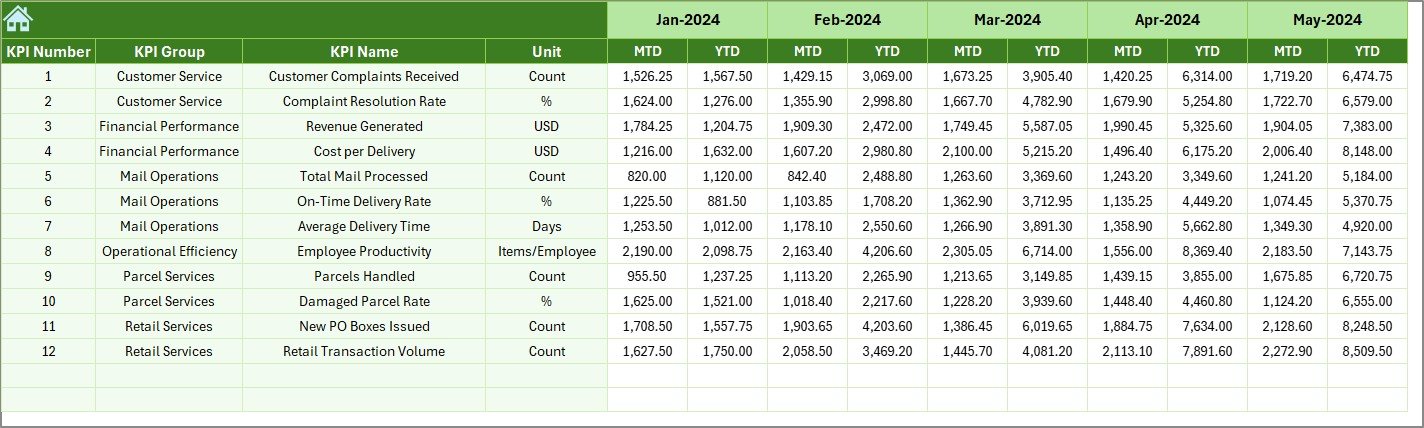
This sheet stores historical data.
You enter previous year numbers similar to the current year format.
As a result:
Managers compare year-over-year growth
Teams measure improvement
Leaders evaluate long-term performance
Click to Purchases Postal Services KPI Dashboard in Excel
7️⃣ What Is the KPI Definition Sheet?
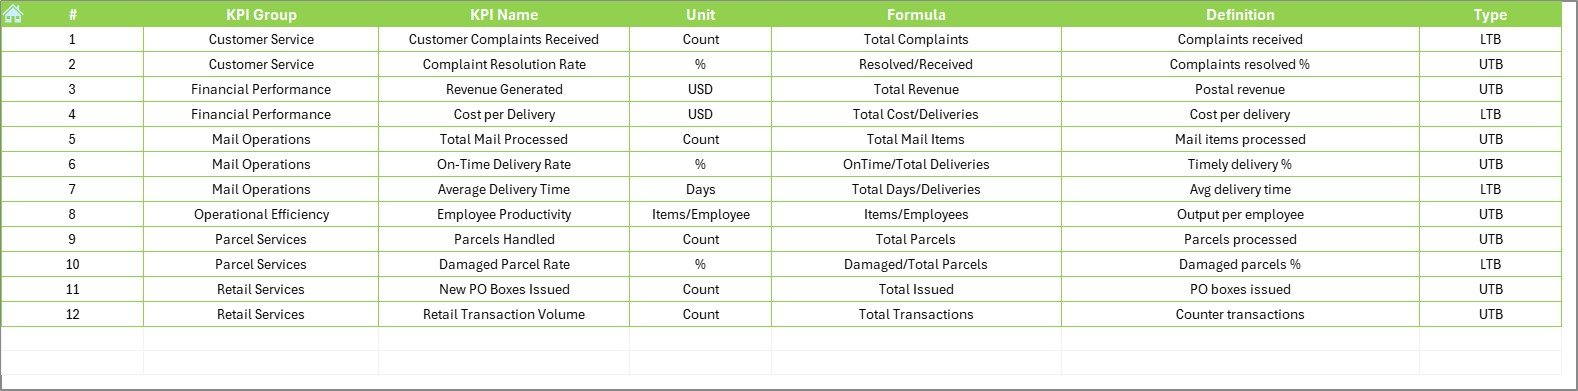
The KPI Definition Sheet maintains KPI documentation.
You enter:
KPI Name
KPI Group
KPI Unit
KPI Formula
KPI Definition
This sheet ensures consistency. Moreover, it prevents confusion. Every team member understands how the KPI works.
What KPIs Should You Track in Postal Services?
Now let us discuss some important KPIs for postal operations.
Operational KPIs
Delivery Success Rate (%)
On-Time Delivery Rate (%)
Average Delivery Time (Days)
Lost Parcel Rate (%)
Return Mail Percentage (%)
Financial KPIs
Monthly Revenue
Revenue per Parcel
Operational Cost per Parcel
Net Profit Margin
Customer KPIs
Complaint Resolution Time
Customer Satisfaction Score
Complaint Volume
Productivity KPIs
Parcels per Employee
Sorting Accuracy Rate
Processing Time per Parcel
Tracking these KPIs helps organizations maintain service quality and financial health.
How Does the Dashboard Improve Postal Performance?
Because the dashboard centralizes data, teams gain clarity.
Moreover:
Managers identify delays quickly
Leaders track revenue trends
Supervisors monitor staff productivity
Decision-makers compare targets with actual results
Instead of reacting late, teams act early.
Advantages of Postal Services KPI Dashboard in Excel
Let us explore the key advantages.
1️⃣ Centralized Performance Monitoring
The dashboard stores all KPIs in one place. Therefore, managers avoid scattered reports.
2️⃣ Easy Month Selection
You select a month from a drop-down. Immediately, the dashboard updates. As a result, analysis becomes faster.
3️⃣ Clear Target vs Actual Comparison
Conditional arrows show performance status. Therefore, managers identify underperforming KPIs instantly.
4️⃣ Year-Over-Year Comparison
Previous year data allows growth analysis. Consequently, leaders measure improvement accurately.
5️⃣ Structured Data Input
Separate sheets for Actual, Target, and Previous Year maintain clean data organization.
6️⃣ Simple and User-Friendly Design
Because Excel remains familiar, teams adopt the system easily.
7️⃣ Better Decision-Making
When leaders see clear numbers and trends, they make informed decisions quickly.
Best Practices for the Postal Services KPI Dashboard in Excel
To maximize dashboard benefits, follow these best practices.
✅ Update Data Monthly
Always update Actual and Target sheets on time. Therefore, the dashboard reflects accurate performance.
✅ Define KPIs Clearly
Maintain clear definitions in the KPI Definition sheet. As a result, teams avoid misunderstandings.
✅ Review Trends Regularly
Do not focus only on monthly numbers. Instead, review YTD trends to identify long-term patterns.
✅ Align KPIs with Strategic Goals
Ensure each KPI supports business objectives. For example, if customer satisfaction improves, complaint resolution time should decrease.
✅ Train Your Team
Provide training on how to use the dashboard. Therefore, everyone understands how to interpret data.
✅ Monitor Both Financial and Operational KPIs
Balance service quality and financial performance. Consequently, you maintain sustainable growth.
How Can Postal Leaders Use This Dashboard Strategically?
Click to Purchases Postal Services KPI Dashboard in Excel
Postal leaders can use this dashboard to:
Improve service delivery
Reduce operational delays
Increase revenue
Enhance customer satisfaction
Optimize staffing levels
Moreover, they can use trend charts to forecast performance and plan resources effectively.
How Does This Dashboard Support Data-Driven Culture?
When teams rely on measurable KPIs, they stop guessing. Instead, they make decisions based on numbers.
Furthermore:
Meetings become data-focused
Performance reviews become objective
Improvement plans become measurable
Therefore, organizations build a performance-driven culture.
Conclusion: Why Should You Use a Postal Services KPI Dashboard in Excel?
Postal services operate in a competitive and demanding environment. Therefore, they need clarity, speed, and accuracy in performance tracking.
The Postal Services KPI Dashboard in Excel offers:
Structured monitoring
Monthly and yearly comparisons
Clear performance indicators
Trend analysis
Easy data input
Strategic insights
Moreover, because the template remains ready to use, organizations implement it quickly.
If you want better control over postal operations, improved delivery performance, and stronger financial tracking, this dashboard provides the perfect solution.
Frequently Asked Questions (FAQs)
1️⃣ What is a Postal Services KPI Dashboard in Excel?
It is an Excel-based performance tracking tool that monitors postal KPIs like delivery rate, revenue, complaints, and operational efficiency.
2️⃣ Can small postal branches use this dashboard?
Yes. Small and large branches can use it because Excel supports scalable data entry.
3️⃣ Do I need advanced Excel skills?
No. Basic Excel knowledge allows you to update data and use the dashboard effectively.
4️⃣ How often should I update the dashboard?
You should update it monthly. However, you can update it more frequently if needed.
5️⃣ What type of KPIs can I track?
You can track operational, financial, customer, and productivity KPIs.
6️⃣ Can I customize the KPIs?
Yes. You can modify the KPI Definition sheet and adjust formulas as per your postal organization’s needs.
7️⃣ Why should I compare previous year data?
Because year-over-year comparison shows growth trends and performance improvements clearly.
Visit our YouTube channel to learn step-by-step video tutorials