Property Management Dashboard in Excel is a powerful, pivot-powered analytics template designed for property managers, landlords, real estate investors, and facilities management teams who need to track rent revenue, occupancy rates, maintenance costs, tenant satisfaction, and lease performance from one centralized Excel dashboard. This template includes 5 interactive dashboard pages, a structured data sheet, and a support sheet with pivot tables that drive the entire dashboard dynamically.
Whether you manage a small portfolio of residential properties or oversee hundreds of commercial units, this Property Management Dashboard in Excel provides the clarity and control you need to maximize rental income, minimize maintenance costs, and improve tenant satisfaction. The dashboard tracks 4 key performance indicators — Total Rent, Total Rent Collected, Total Maintenance Cost, and Total Records — alongside Occupancy Rate %, rent collected by location, maintenance cost by priority, lease status tracking, and tenant satisfaction analysis across 5 dedicated analysis pages.
Click here to Purchase Property Management Dashboard in Excel
Key Features of Property Management Dashboard in Excel
The Property Management Dashboard in Excel is packed with features that make it one of the most comprehensive property management analytics solutions available in Excel format. Here is what makes this template stand out from the rest.
- 5 Interactive Dashboard Pages — Overview, Financial, Property, Maintenance, and Lease pages deliver 360-degree visibility into every dimension of your property management operations.
- 4 Dynamic KPI Cards — Total Rent, Total Rent Collected, Total Maintenance Cost, and Total Records displayed on the Overview page for instant executive-level insight.
- Occupancy Rate % Tracking — Monitor your portfolio’s occupancy rate directly on the Overview page to stay on top of vacancy trends.
- Financial Analysis — Analyze rent collected by property manager, compare total rent vs total rent collected by building, and track records by payment status.
- Property Insights — Track records by property type, occupied vs vacant by location, monthly occupancy status, and average satisfaction by building.
- Maintenance Budget Control — Monitor maintenance cost by type, priority, status, and property manager for optimized operational budgets.
- Lease Performance Analysis — Track lease status distribution, average satisfaction by tenant type, and rent collected by month.
- Interactive Slicers — Filter data instantly by location, building, property type, tenant type, payment status, and more across all dashboard pages.
- Pivot-Powered Auto-Refresh — All charts and KPIs update automatically when you click Refresh All after entering new data.
- No Coding Required — Replace the sample data with your own and the entire dashboard updates instantly.
Dashboard Pages Explanation
1. Overview Page
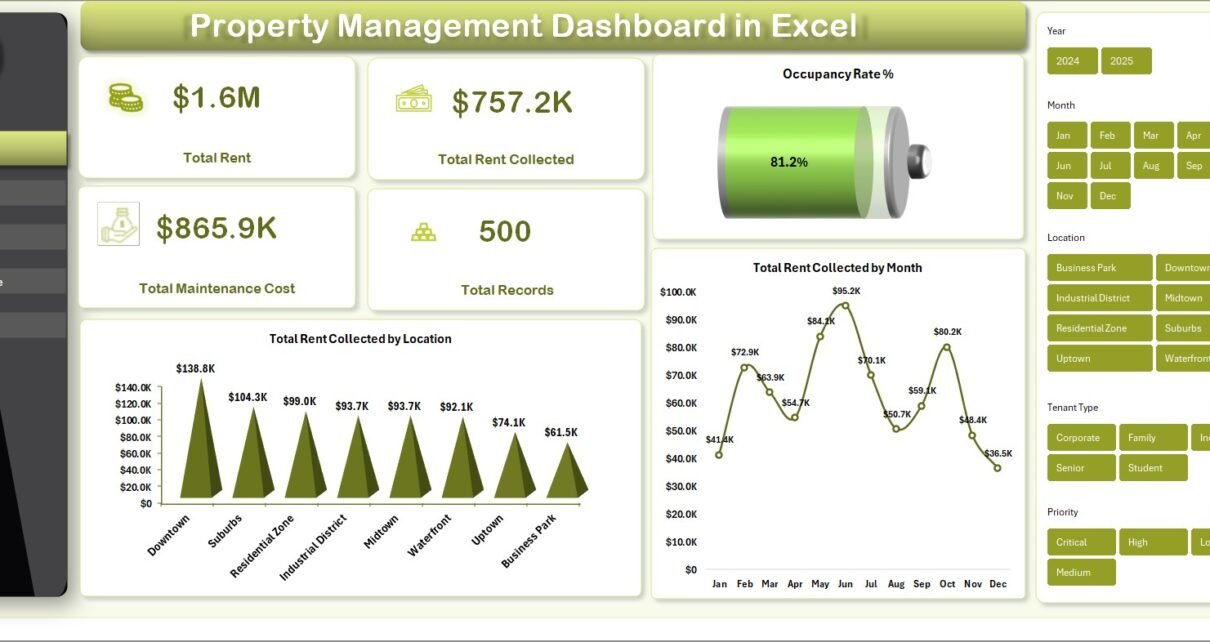
The Overview page serves as your command center for property management analytics. At the top, dynamic KPI cards display Total Rent, Total Rent Collected, Total Maintenance Cost, and Total Records. These cards provide an immediate high-level snapshot of your entire property portfolio performance.
Below the KPI cards, interactive charts deliver deeper analysis. Occupancy Rate % gives you an instant view of portfolio utilization. Total Rent Collected by Month reveals seasonal rental income patterns throughout the year, helping you forecast cash flow. Total Rent Collected by Location shows which geographic areas generate the most rental revenue. Multiple slicers are available to filter the entire dashboard instantly by various dimensions for focused analysis.
Property Management Dashboard in Excel
2. Financial Page
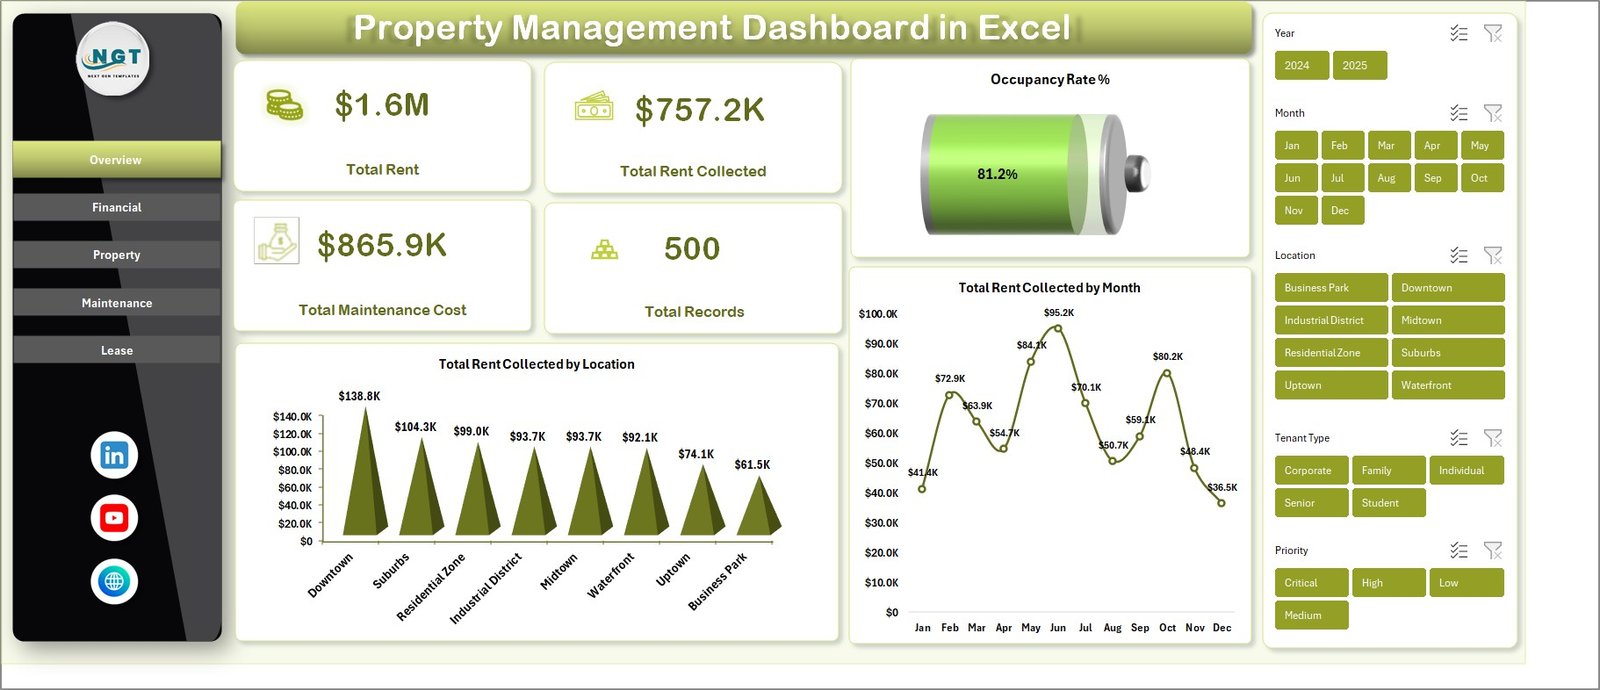
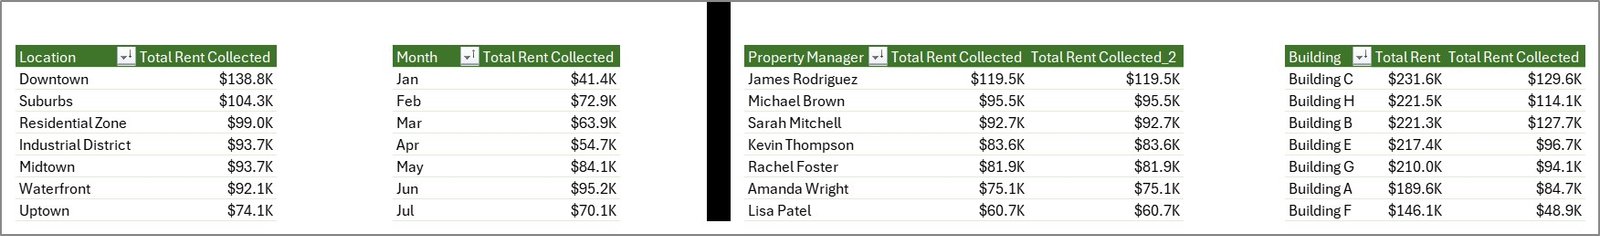
The Financial page focuses entirely on the money side of your property management operations. Total Rent Collected by Property Manager helps you evaluate which managers are most effective at collecting rent on time. Total Rent vs Total Rent Collected by Building reveals the collection efficiency gap across your properties, helping you identify buildings with payment issues.
Total Rent by Tenant Type breaks down your rental income by tenant categories such as residential, commercial, or corporate tenants. Total Records by Payment Status shows the distribution of paid, pending, and overdue payments across your portfolio. This page is essential for property management firms and landlords who need complete financial transparency.
Financial Page
3. Property Page
The Property page dives into property-level analytics to help you understand portfolio composition and performance. Total Records by Property Type shows the distribution of your properties across categories like apartments, offices, retail spaces, and more. Total Occupied vs Total Vacant by Location reveals which areas have the highest vacancy rates, enabling you to prioritize leasing efforts.
Total Monthly Occupancy Status tracks occupancy changes over time to help you spot trends. Avg. Satisfaction by Building evaluates tenant happiness across your portfolio, helping you identify buildings that need improvements. This page is invaluable for investors who want to optimize their property mix and improve tenant retention.
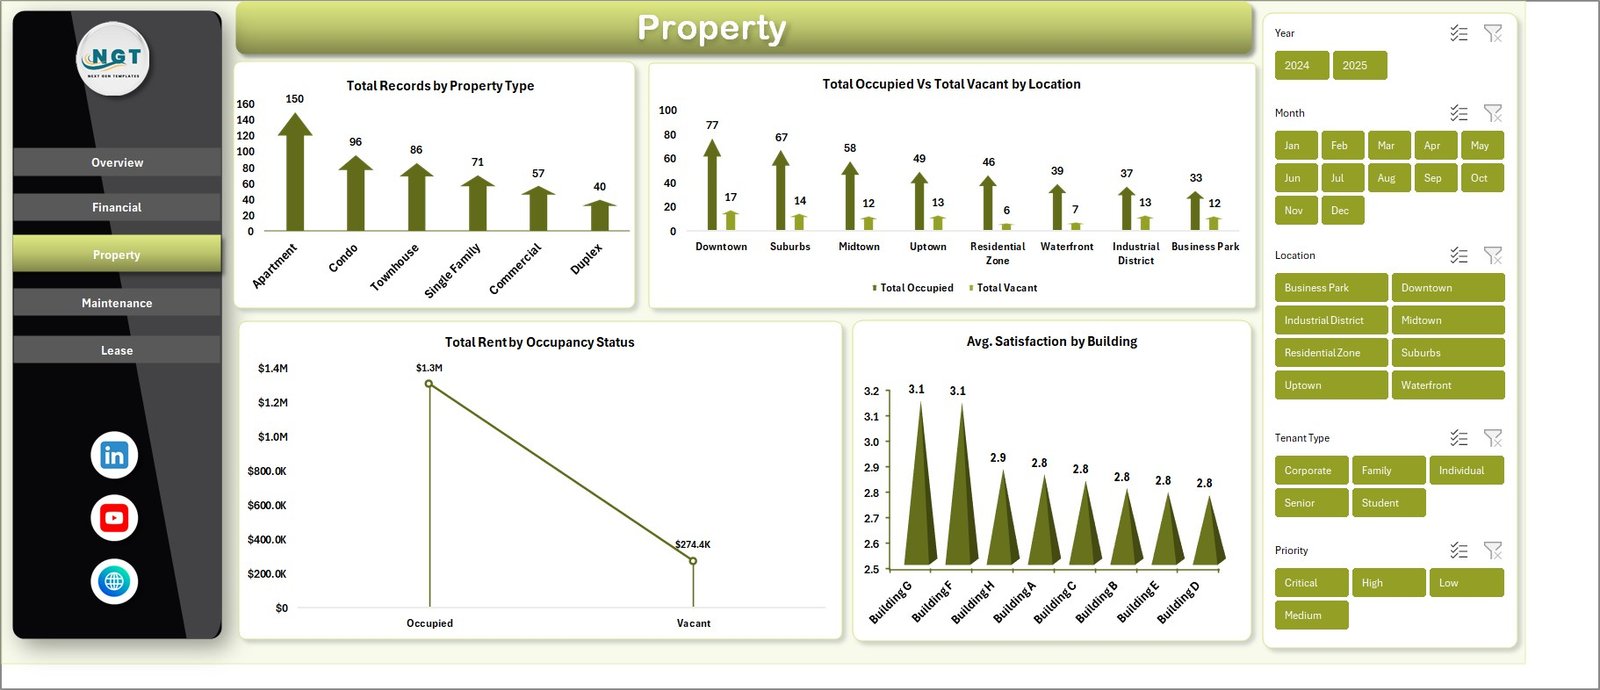
Property Page
Click here to Purchase Property Management Dashboard in Excel
4. Maintenance Page
The Maintenance page provides complete visibility into your property maintenance operations and costs. Total Maintenance Cost by Maintenance Type breaks down expenses by categories like plumbing, electrical, HVAC, and general repairs so you can see where your budget is going. Total Maintenance Cost by Priority shows how much you are spending on emergency vs routine vs preventive maintenance.
Total Records by Maintenance Status tracks open, in-progress, and completed maintenance requests across your portfolio. Total Maintenance Cost by Property Manager reveals which managers are overseeing the most expensive maintenance operations. This analysis helps facilities teams optimize maintenance budgets, plan preventive maintenance schedules, and control operational costs.
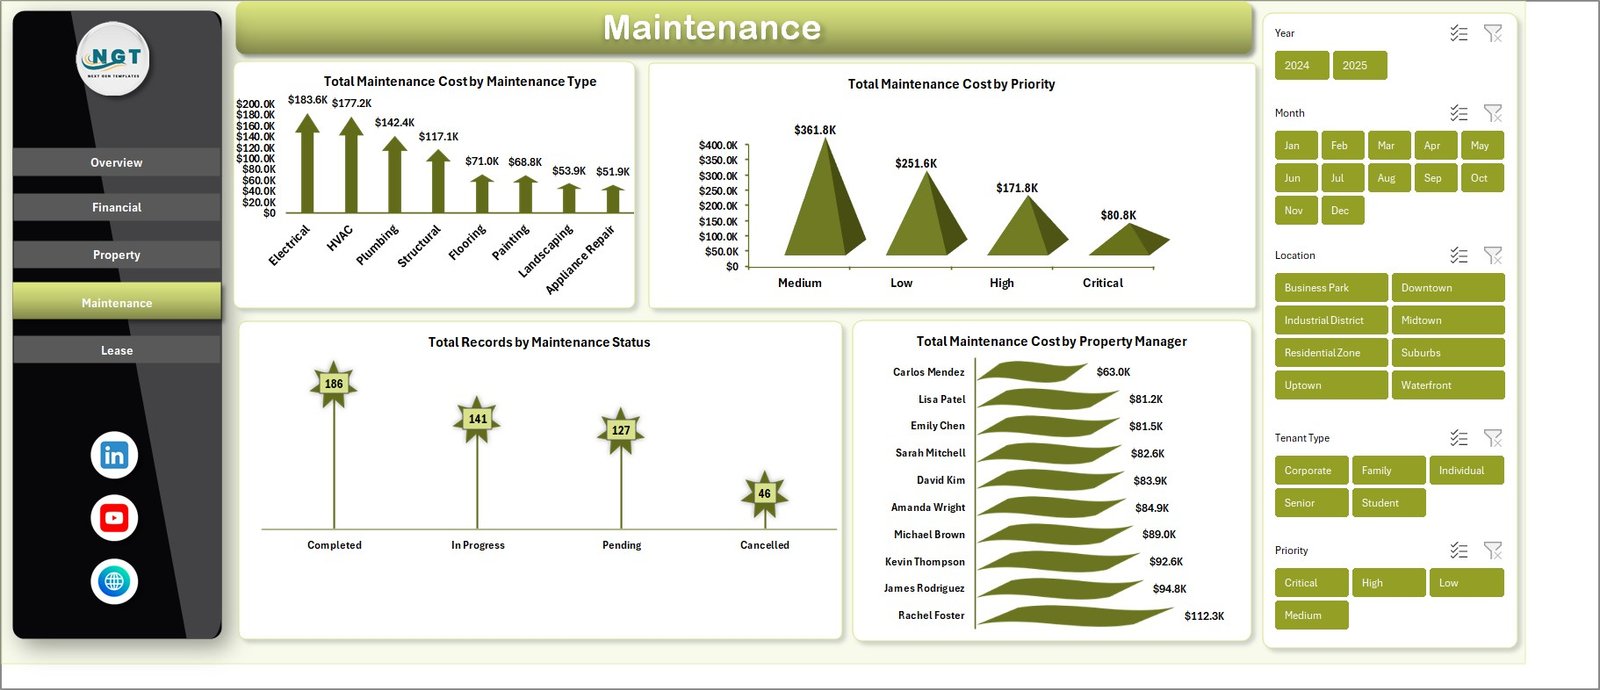
Maintenance Page
5. Lease Page
The Lease page monitors the leasing performance of your property portfolio. Total Records by Lease Status shows the distribution of active, expired, and pending leases so you can plan renewals proactively. Avg. Satisfaction by Tenant Type helps you understand which tenant categories are happiest, guiding your tenant retention strategies.
Total Rent Collected by Month on this page provides a focused view of rental income trends from the leasing perspective. Together, these charts give you the data needed to reduce vacancy periods, improve tenant relationships, and maximize lease renewal rates. If you are interested in rental investment analytics, also check out the Real Estate Agent Dashboard in Excel.
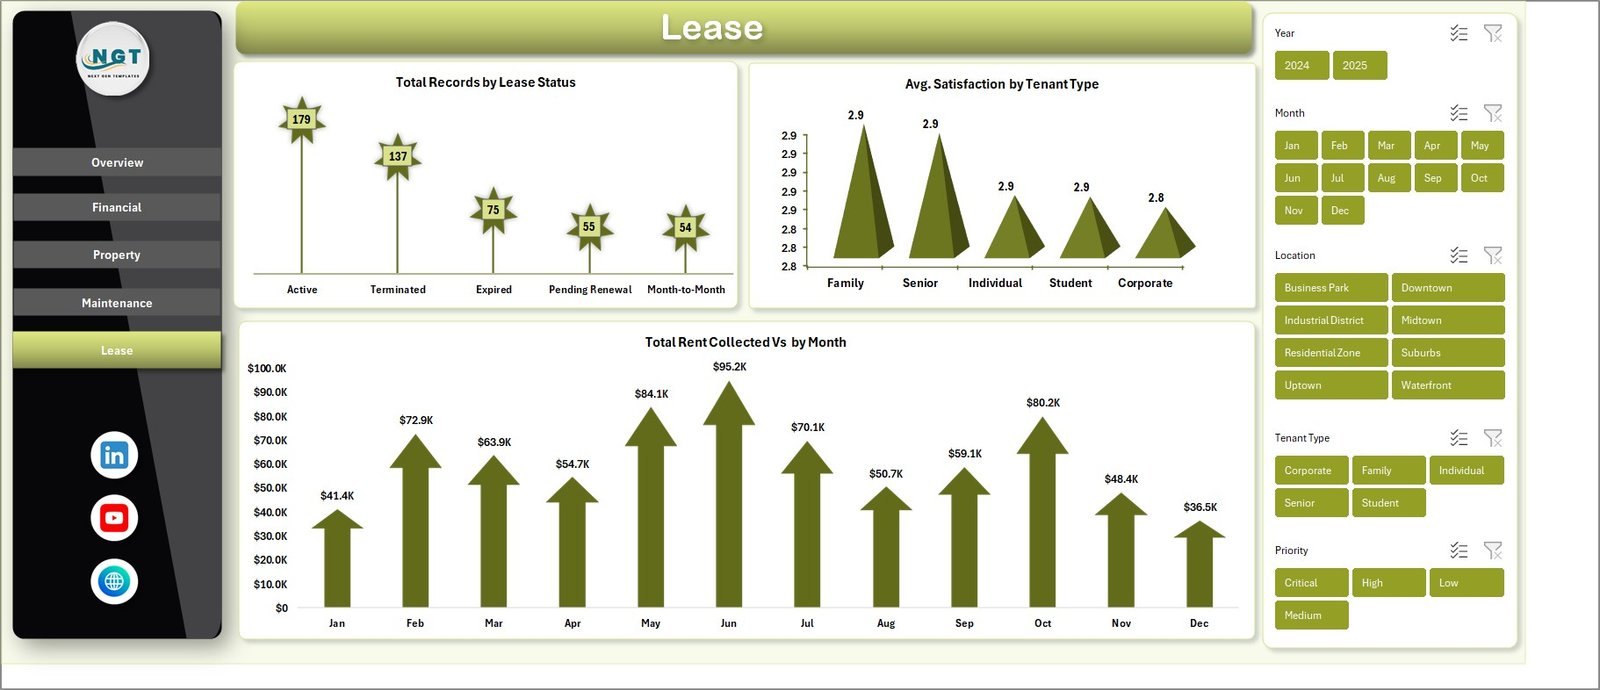
Lease Page
6. Data Sheet Tab
This is the Data Sheet where you enter your property management records. Add your data in the same format provided — including property details, rent amounts, maintenance records, tenant information, and more. The dashboard reads from this sheet and updates all analytics automatically after a refresh. Keep the column structure consistent for smooth data processing.
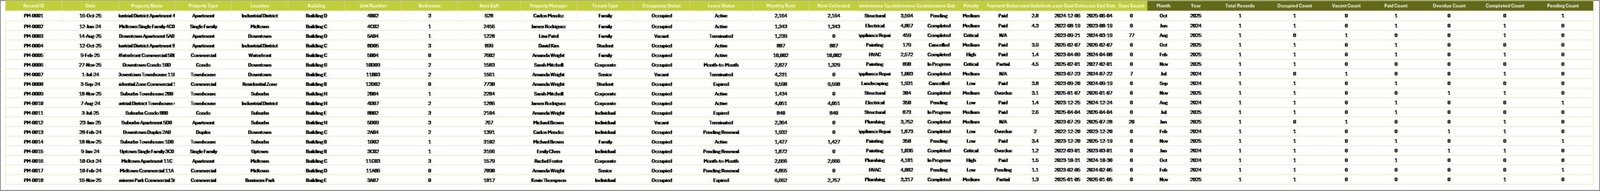
Data Sheet Tab
7. Support Sheet
The Support sheet contains multiple pivot tables that power the entire dashboard dynamically. You can go to the Data tab in the Excel Ribbon and click on Refresh All after updating the data in the Data Sheet. All the pivots will be refreshed and all the charts will be refreshed. You can keep this sheet hidden for a clean user experience.
Support Sheet Tab
Advantages of Property Management Dashboard in Excel
The Property Management Dashboard in Excel offers several compelling advantages for real estate professionals. First, it consolidates all your property data into a single, unified interface eliminating the need to switch between multiple spreadsheets or reporting tools. Second, the pivot-powered architecture means you never have to manually update charts or recalculate KPIs; a simple Refresh All does everything for you.
Third, the multi-page design provides both high-level overviews and granular drill-down capabilities, making it suitable for individual landlords as well as large property management firms. Fourth, the interactive slicers give you the flexibility to analyze data from any angle without creating separate reports. Finally, because it runs in Microsoft Excel, there is no additional software cost or learning curve for teams already familiar with spreadsheets. For advanced analytics, consider the Rental Property Investment Dashboard in Power BI.
Opportunities for Improvement
While the Property Management Dashboard in Excel is highly functional, there are areas where users might want to extend it further. Adding a tenant payment history tracking page could provide deeper financial insights at the tenant level. Including a maintenance request aging analysis would help identify bottlenecks in maintenance workflows. Users managing very large portfolios (10,000+ records) may experience slower pivot refresh times; in such cases, consider the Property Management Dashboard in HTML for browser-based performance. Adding a vacancy cost calculator that estimates lost revenue from unoccupied units would also enhance the decision-making capabilities.
Best Practices
To get the most out of your Property Management Dashboard in Excel, follow these best practices. Keep your data clean and consistent by using standardized names for locations, buildings, and property types to ensure accurate filtering and grouping. Update your data regularly (weekly or monthly) and always click Refresh All after making changes. Use the slicers strategically to create focused views for team meetings, investor presentations, or board reports.
Consider hiding the Support sheet to keep the workbook clean for stakeholders who only need to see the dashboard pages. For the best experience, use Microsoft Excel desktop version (2016 or later) as some slicer and pivot features may not work fully in Excel Online. Also check out the Best Excel Dashboard Templates collection for more ready-to-use solutions.
Explore Relevant Templates
Property Management Dashboard in HTML – The browser-based version with interactive charts and no software installation required.
Rental Property Investment Dashboard in Excel – Track rental income, NOI, occupancy, and ROI across your investment properties.
Real Estate Agent Dashboard in Excel – Agent performance tracking with commissions, sales trends, and market analysis.
Rental Property Investment Dashboard in Power BI – Advanced Power BI analytics for rental property investment management.
Rental Property Investment Dashboard in Google Sheets – Cloud-based rental analytics with interactive pages in Google Sheets.
Browse our complete collection of Excel Dashboard Templates.
Frequently Asked Questions
What KPIs does the Property Management Dashboard in Excel track?
The Property Management Dashboard in Excel tracks 4 key performance indicators on the Overview page: Total Rent, Total Rent Collected, Total Maintenance Cost, and Total Records. It also tracks Occupancy Rate %, rent by location, rent by tenant type, maintenance cost by type and priority, lease status distribution, and average tenant satisfaction scores across 5 interactive dashboard pages.
Do I need advanced Excel skills to use this property management template?
No. Simply open the file in Microsoft Excel, replace the sample data in the Data Sheet with your own property records, and click Refresh All in the Data tab. All charts, KPI cards, and pivot tables update automatically without any manual formula work.
What is the best Excel dashboard for property management?
The Property Management Dashboard in Excel from NextGenTemplates is one of the best options available. It includes 5 interactive dashboard pages covering overview, financial analysis, property insights, maintenance tracking, and lease analysis with 4 KPI cards, interactive slicers, and pivot-powered auto-refresh.
Can I track maintenance costs and tenant satisfaction in this dashboard?
Yes. The Maintenance page tracks Total Maintenance Cost by Maintenance Type, Priority, Status, and Property Manager. The Property page and Lease page track Avg. Satisfaction by Building and by Tenant Type respectively, giving you complete visibility into maintenance budgets and tenant experience.
How do I update the dashboard with my own property data?
Go to the Data Sheet tab, replace the sample records with your own property management data using the same column format. Then navigate to the Data tab in Excel and click Refresh All. All 5 dashboard pages, including charts, KPIs, and slicers, will update automatically.
Is this dashboard available in other platforms?
Yes. We also offer the Property Management Dashboard in HTML for browser-based analytics. For rental property investment tracking, explore our dashboards in Excel, Power BI, Google Sheets, and HTML.
Conclusion
The Property Management Dashboard in Excel is a must-have tool for any property management professional who wants to make data-driven decisions, track financial performance, monitor maintenance operations, and maximize tenant satisfaction. With 5 interactive dashboard pages, 4 dynamic KPI cards, interactive slicers, and pivot-powered auto-updates, this template transforms your raw property data into actionable visual insights in minutes.
Click here to Purchase Property Management Dashboard in Excel
For more Excel tips and resources, visit Microsoft Learn. Subscribe to our YouTube channel for step-by-step video tutorials on how to use this and other dashboard templates.
👉 Youtube.com/@PK-AnExcelExpert