Energy Consumption Analysis Dashboard in Power BI is a professionally designed, interactive Power BI dashboard template that empowers energy managers, facility operators, sustainability officers, and operations teams to monitor energy consumption, costs, carbon emissions, and operational efficiency from one centralized analytics hub. This ready-to-use template includes 5 interactive dashboard pages — Overview, Source Analysis, Facility Insights, Efficiency Trends, and Operations Review — with dynamic charts, KPI cards, slicers, and filters that transform raw energy data into actionable business intelligence.
Whether you manage commercial buildings, industrial plants, manufacturing facilities, or multi-site operations, tracking energy consumption across departments, regions, and equipment types can be overwhelming without the right tool. This Power BI dashboard template consolidates all your energy metrics into one professional analytics experience that updates instantly when you apply filters or refresh data. If you prefer working in Excel, explore the Energy Consumption Analysis Dashboard in Excel. For a browser-based solution, check out the Energy Consumption Analysis Dashboard in HTML.
Key Features of Energy Consumption Analysis Dashboard in Power BI
The Energy Consumption Analysis Dashboard in Power BI is packed with powerful features designed to give you complete visibility into your organization’s energy footprint. This template includes 5 interactive dashboard pages with over 15 charts and 5 high-level KPI cards. Each page focuses on a different dimension of energy analytics — from source-level breakdowns and facility comparisons to efficiency trends and operational reviews.
The dashboard tracks 5 key performance indicators: Total Consumption, Total Cost, Total Carbon Emission, Total Records, and Avg Efficiency Rating. Interactive slicers on every page allow you to filter the entire dashboard by energy source, region, department, facility, equipment type, status, and time period with a single click. The professional design makes it presentation-ready for stakeholders, executives, and board meetings.
Click to buy Energy Consumption Analysis Dashboard in Power BI
Dashboard Pages Explained
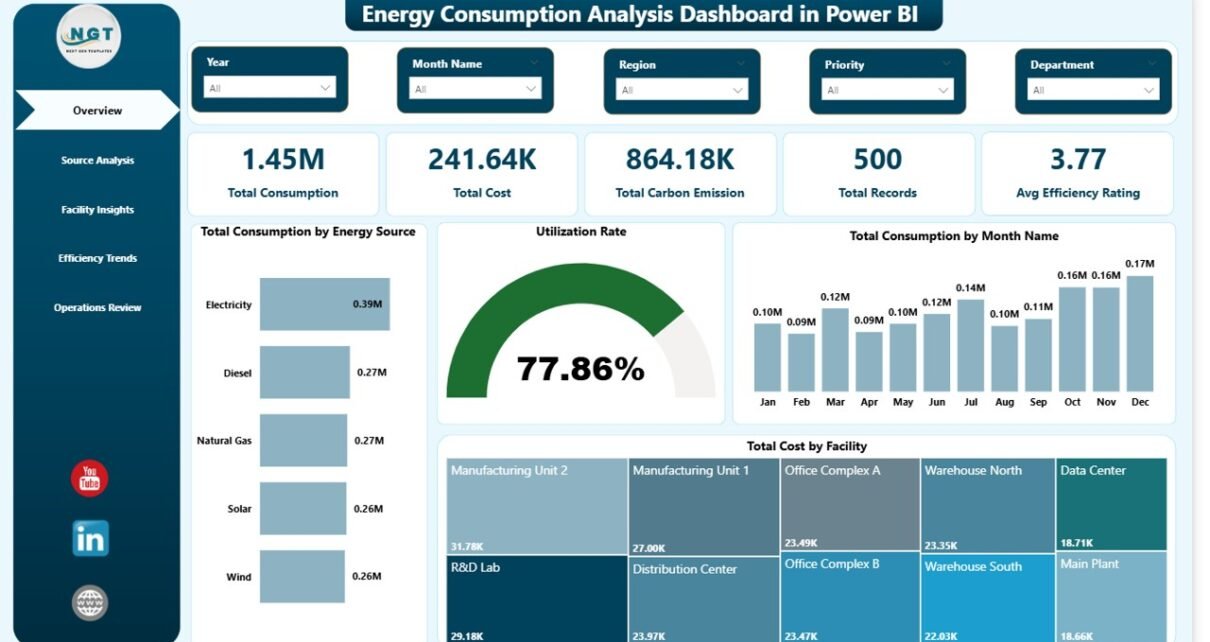
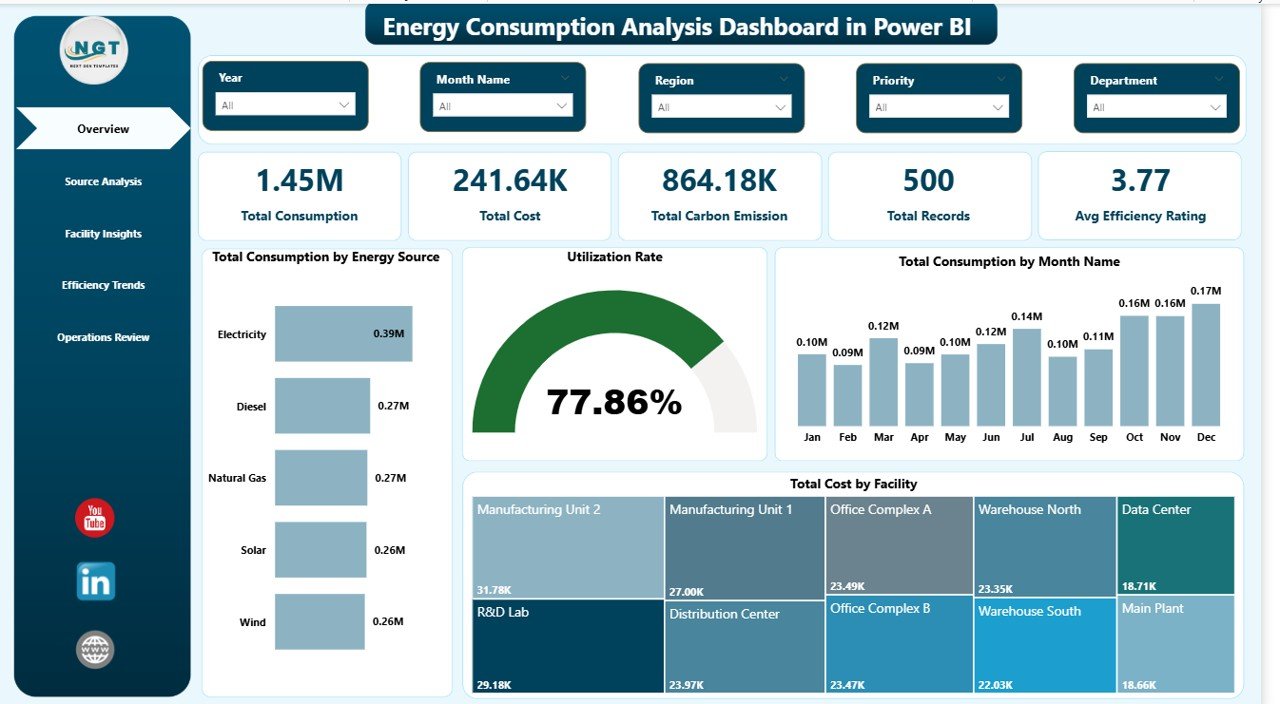
1 — Overview Page
The Overview page serves as the main command center for your energy monitoring. At the top, 5 KPI cards display Total Consumption, Total Cost, Total Carbon Emission, Total Records, and Avg Efficiency Rating for instant visibility into your organization’s energy health. Below the cards, interactive charts visualize Total Consumption by Energy Source showing distribution across different fuel types, Utilization Rate providing a quick efficiency snapshot, Total Consumption by Month Name tracking usage patterns over time, and Total Cost by Facility comparing spending across locations. Multiple slicers enable quick filtering across all visuals for focused analysis.
Energy Consumption Analysis Dashboard in Power BI
Click to buy Energy Consumption Analysis Dashboard in Power BI
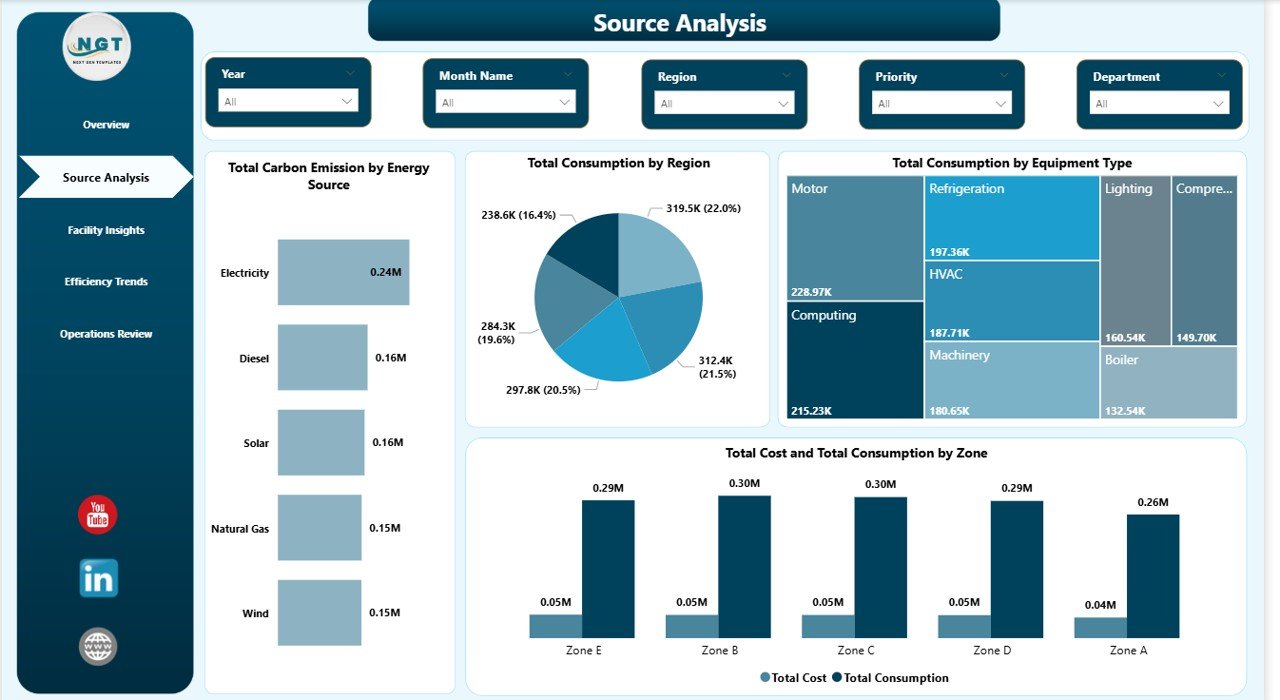
2 — Source Analysis
The Source Analysis page provides deep energy source performance analysis. It features charts for Total Carbon Emission by Energy Source tracking environmental impact per fuel type, Total Consumption by Region showing geographic distribution patterns, Total Consumption by Equipment Type identifying which equipment categories consume the most energy, and Total Cost and Total Consumption by Zone revealing cost-to-consumption relationships across operational zones. This page helps energy managers identify which sources and regions drive the highest consumption and emissions.
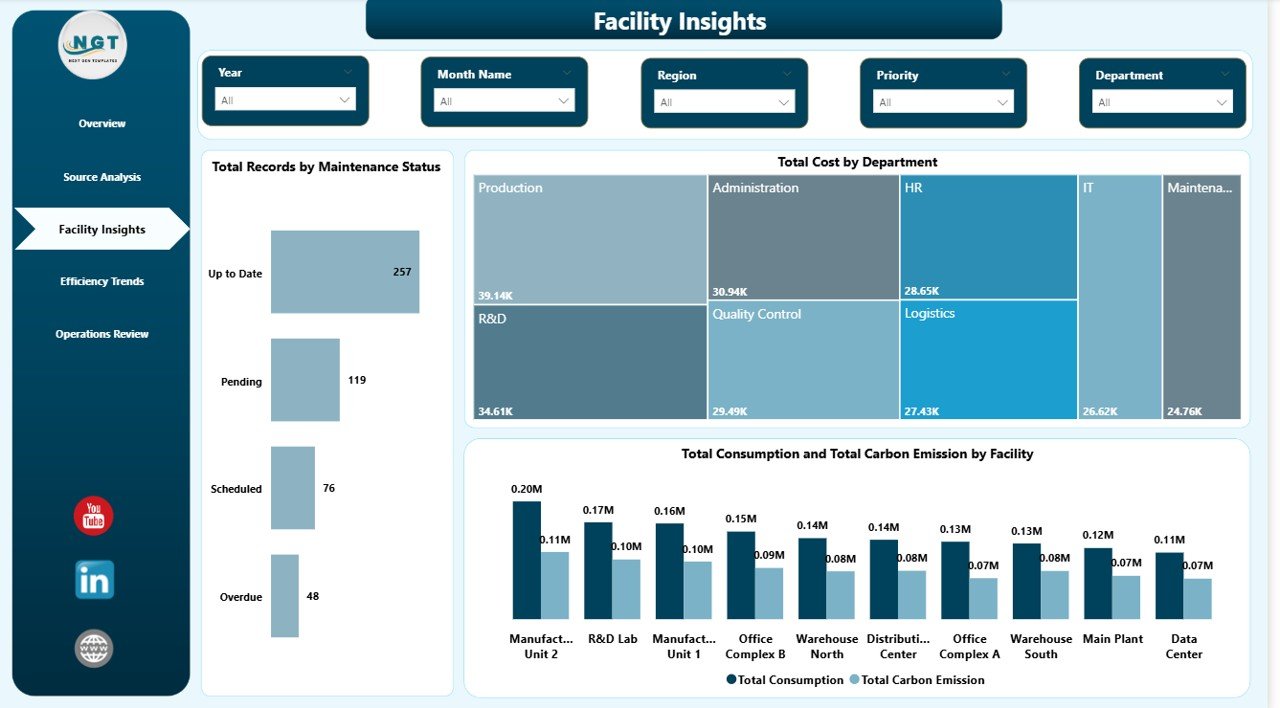
3 — Facility Insights
The Facility Insights page delivers facility-level operational performance analysis. Charts include Total Records by Maintenance Status monitoring equipment health across your facilities, Total Cost by Department revealing departmental spending patterns, and Total Consumption and Total Carbon Emission by Facility comparing energy usage against environmental impact for each location. This page is essential for facility operators who need to benchmark performance across multiple sites.
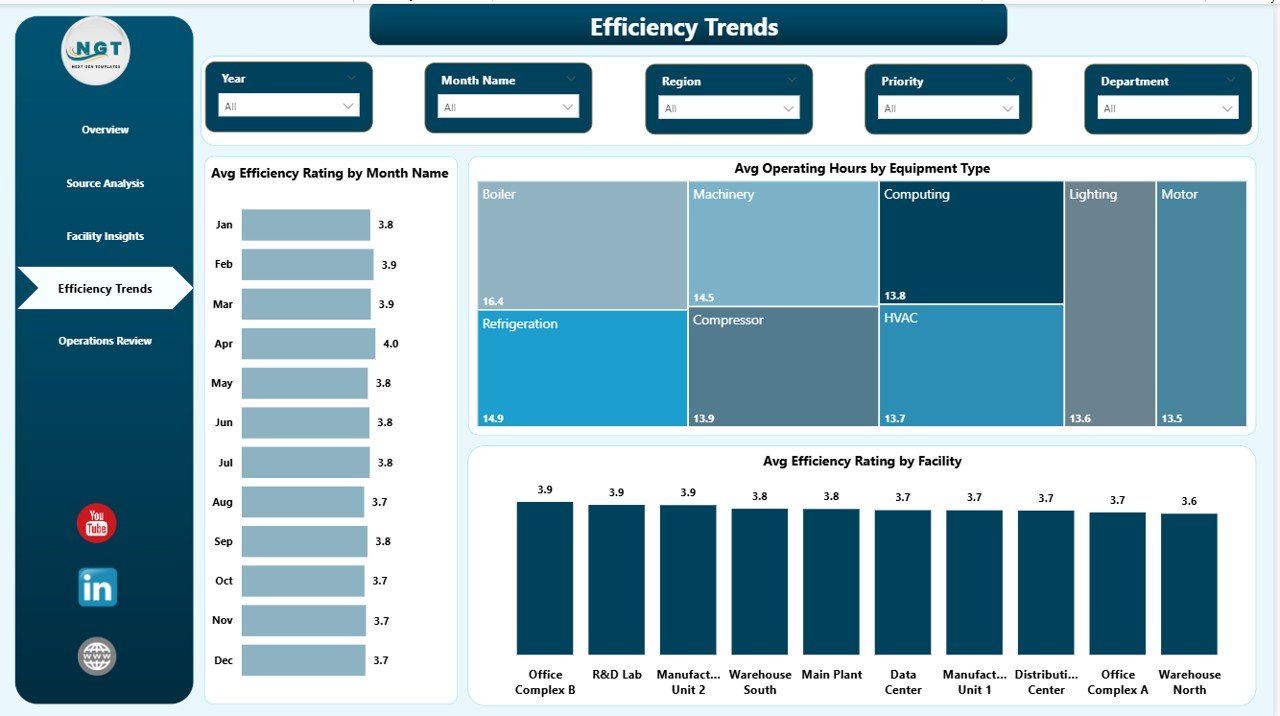
4 — Efficiency Trends
The Efficiency Trends page tracks efficiency performance over time. It showcases Avg Efficiency Rating by Month Name monitoring how efficiency evolves month by month, Avg Operating Hours by Equipment Type comparing runtime across equipment categories to identify overworked or underutilized assets, and Avg Efficiency Rating by Facility ranking your facilities by efficiency performance. This page is invaluable for operations directors focused on continuous improvement and cost optimization.
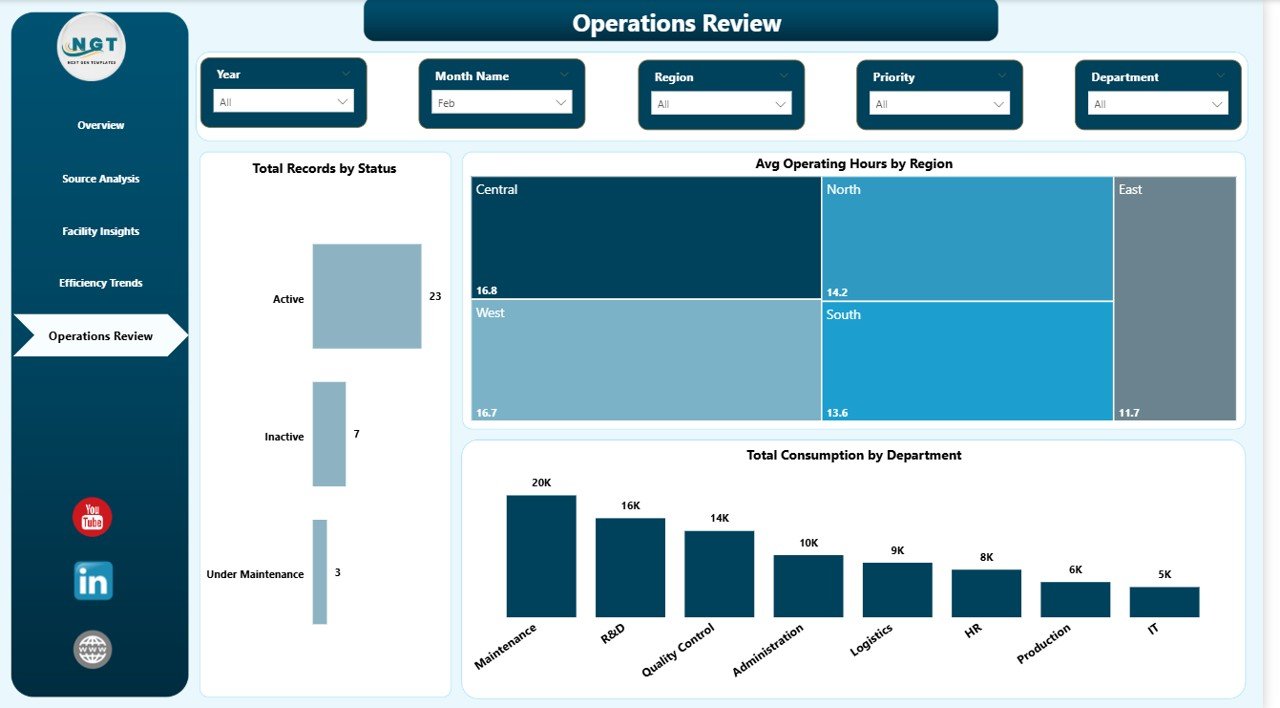
5 — Operations Review
The Operations Review page provides complete operational visibility. Charts include Total Records by Status breaking down operational status distribution across your energy assets, Avg Operating Hours by Region comparing runtime across geographic areas to identify regional usage patterns, and Total Consumption by Department analyzing departmental consumption patterns for budget allocation and optimization decisions.
Advantages of Energy Consumption Analysis Dashboard in Power BI
This dashboard eliminates the need for manual energy reporting by automating data visualization across 5 focused analytical pages. Energy managers save hours of reporting time each week by using interactive slicers instead of building charts from scratch. The dashboard provides a single source of truth for energy performance data, eliminating discrepancies between departmental spreadsheets. Carbon emission tracking across sources and facilities supports ESG compliance and sustainability reporting requirements. The professional design ensures that insights can be shared directly with executives and board members without additional formatting.
Opportunities for Improvement
While the dashboard provides comprehensive energy analytics out of the box, organizations with advanced requirements might consider connecting it to live data sources using Power BI dataflows or scheduled refresh for real-time monitoring. Adding custom DAX measures for cost-per-unit calculations or year-over-year growth comparisons could enhance the analytical depth. Organizations with more than 10 facilities might benefit from adding a geographic map visual for spatial energy distribution analysis. Integration with IoT sensor data could further enhance the real-time monitoring capabilities of this template.
Best Practices for Using This Dashboard
Start by replacing the sample data with your actual energy records, ensuring all columns match the expected format. Use the Overview page as your daily check-in to spot anomalies in consumption or cost trends. Leverage the Source Analysis page during quarterly energy reviews to identify which fuel types contribute most to costs and emissions. Schedule Power BI data refreshes to keep the dashboard current with your latest energy data. Use the Efficiency Trends page to set monthly efficiency targets and track progress. Share the dashboard via Power BI Service to give team members read-only access for collaborative energy management.
Explore Relevant Templates
If you found this dashboard useful, explore these related templates from NextGenTemplates:
- Energy Consumption Analysis Dashboard in Excel — The same powerful energy analytics in a familiar spreadsheet format with pivot tables and slicers.
- Energy Consumption Analysis Dashboard in HTML — A browser-based interactive version with 5 pages, filters, and CSV export capability.
- ESG Environmental Dashboard in Power BI — Track carbon emissions, water usage, waste, and compliance scores with interactive Power BI analytics.
- Building Automation Dashboard in Excel — Monitor building energy, alerts, maintenance costs, comfort scores, and occupancy insights.
Browse all Power BI Dashboard Templates for more professional analytics solutions.
Frequently Asked Questions
What KPIs does the Energy Consumption Analysis Dashboard in Power BI track?
The Energy Consumption Analysis Dashboard in Power BI tracks 5 key performance indicators: Total Consumption, Total Cost, Total Carbon Emission, Total Records, and Avg Efficiency Rating. These metrics are displayed on the Overview page and analyzed in depth across all 5 dashboard pages with over 15 interactive charts covering source analysis, facility insights, efficiency trends, and operations review.
How many dashboard pages are included in this Power BI template?
This template includes 5 interactive dashboard pages: Overview, Source Analysis, Facility Insights, Efficiency Trends, and Operations Review. Each page provides focused analysis on a different dimension of energy consumption with dedicated charts, KPI cards, and interactive slicer filters.
Do I need advanced Power BI skills to use this energy dashboard?
No advanced skills are required. Simply open the .pbix file in Power BI Desktop, explore the pre-built pages, and replace the sample data with your own energy consumption records. All charts, KPI cards, and filters update automatically. No DAX formulas or Power Query transformations need to be written.
Can I customize this dashboard for my organization?
Yes. Power BI Desktop provides full editing capability for every visual element. You can modify colors, add new charts, create custom DAX measures, adjust slicer filters, add new data columns, and connect your own data sources to make the dashboard match your exact requirements.
What is the best Power BI dashboard template for energy consumption analysis?
The Energy Consumption Analysis Dashboard in Power BI from NextGenTemplates is one of the most comprehensive energy analytics templates available. It covers 5 analytical dimensions — overview metrics, source analysis, facility insights, efficiency trends, and operations review — with 5 KPI cards, 15+ interactive charts, and dynamic slicer filters designed specifically for energy management professionals.
How does this dashboard support carbon emission tracking?
The dashboard includes dedicated carbon emission charts including Total Carbon Emission by Energy Source on the Source Analysis page and Total Consumption and Total Carbon Emission by Facility on the Facility Insights page. These visuals help sustainability teams monitor environmental impact by fuel type and location for ESG compliance reporting.
Conclusion
The Energy Consumption Analysis Dashboard in Power BI is a must-have analytics tool for any organization serious about monitoring and optimizing energy performance. With 5 interactive pages, 5 KPI cards, over 15 charts, and dynamic slicer filters, it transforms complex energy data into clear, actionable insights. Whether you are tracking consumption patterns, analyzing costs by facility, monitoring carbon emissions, or benchmarking efficiency trends, this template delivers everything you need in one professional Power BI experience.
Click here to Purchase Energy Consumption Analysis Dashboard in Power BI
For more dashboard templates and tutorials, visit our YouTube channel:
Click to buy Energy Consumption Analysis Dashboard in Power BI