Warehouse Efficiency Dashboard in Excel is a comprehensive, ready-to-use Excel dashboard template designed for warehouse managers, logistics coordinators, supply chain directors, and operations teams who need to monitor warehouse throughput, order fulfillment, inventory turnover, workforce productivity, and shipping performance from one centralized and interactive workbook. This Excel dashboard includes 5 interactive pages — Overview, Warehouse Analysis, Shipping Insights, Worker Productivity, and Order Fulfillment — and tracks key performance indicators including Total Orders, Total Units Shipped, Order Fulfillment Rate, Avg Processing Time, and On-Time Shipment %.
In today’s fast-paced supply chain environment, warehouse teams need instant access to actionable data. Manual tracking through disconnected spreadsheets leads to missed fulfillment targets, poor storage utilization, and rising operational costs. The Warehouse Efficiency Dashboard in Excel eliminates these blind spots by transforming raw warehouse data into clear, dynamic visuals with interactive charts, KPI cards, and slicer-based filtering that update automatically when you refresh the data.
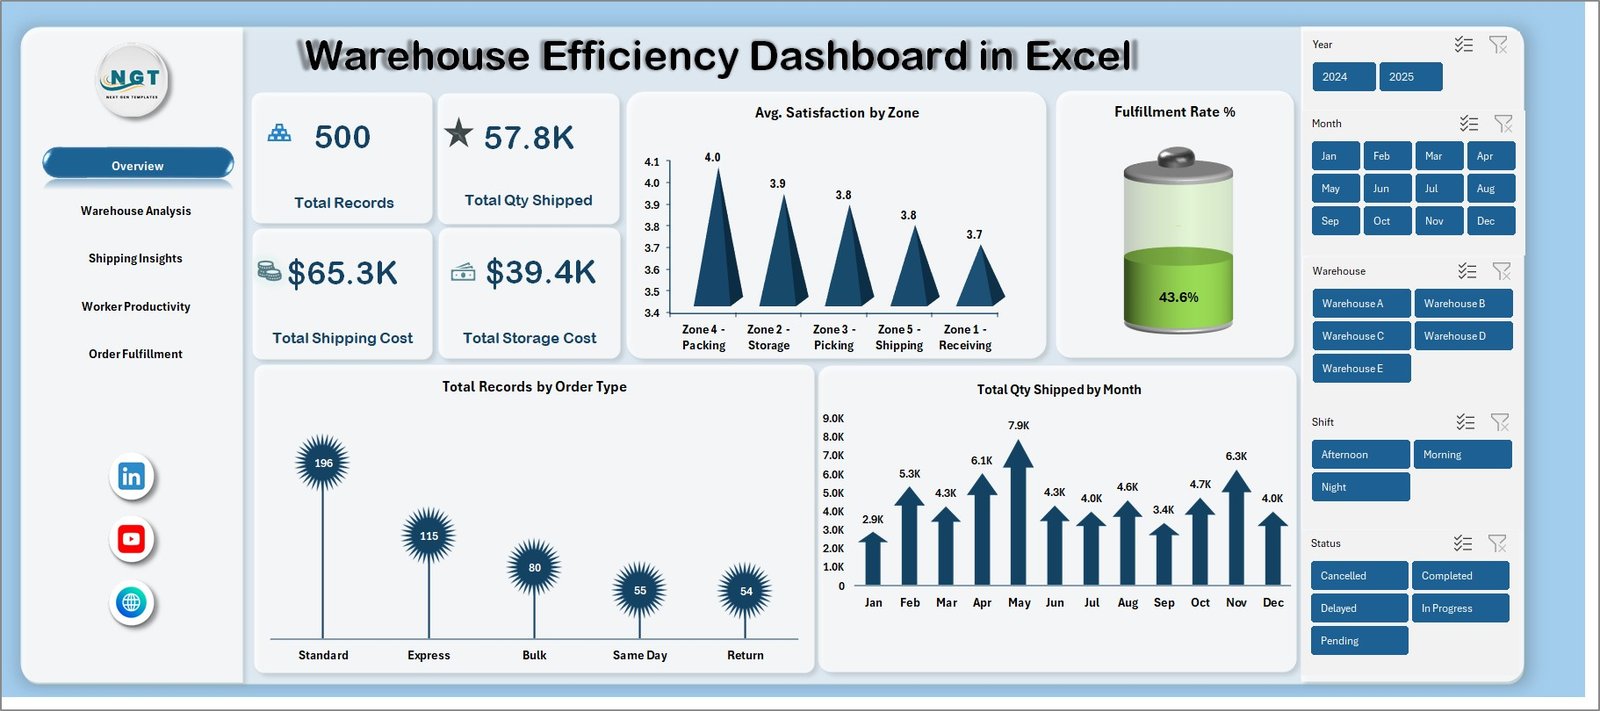
Key Features of Warehouse Efficiency Dashboard in Excel
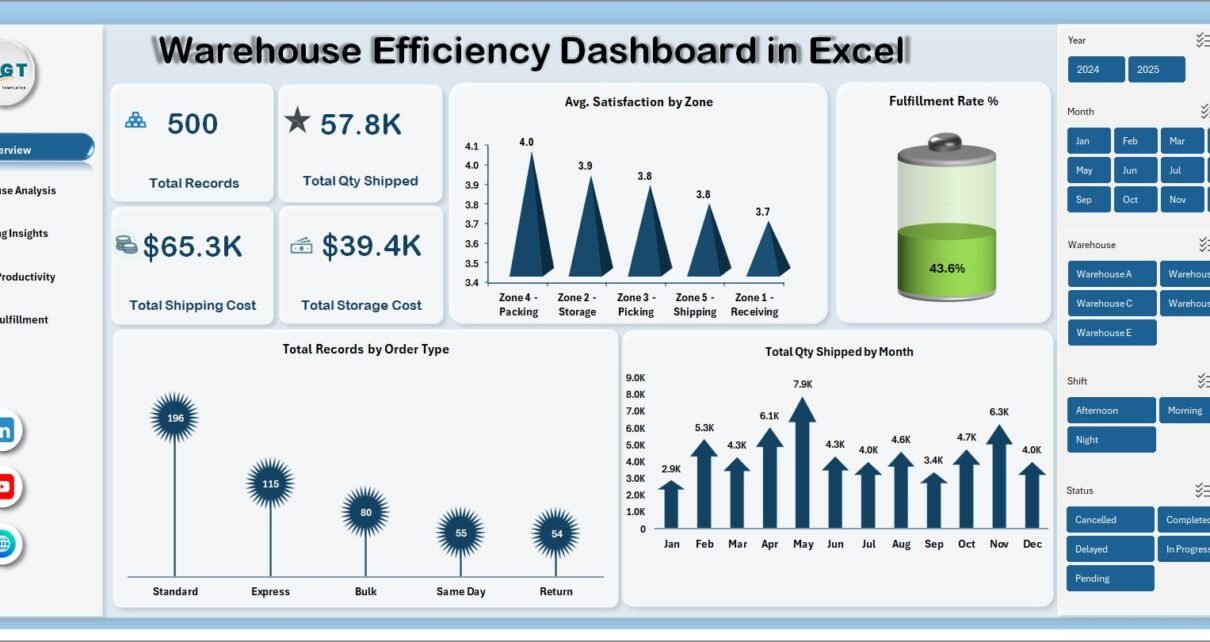
This Excel dashboard template delivers comprehensive warehouse analytics across 5 interactive pages with 20+ dynamic charts and slicers. The Overview page displays KPI cards — Total Orders, Total Units Shipped, Order Fulfillment Rate, Avg Processing Time, and On-Time Shipment % — alongside analytical charts covering orders by warehouse zone, units shipped by month, order status distribution, and fulfillment rate by product category. Built-in slicers on every page enable instant filtering, allowing managers to drill down into specific zones, categories, shifts, or time periods within seconds.
The template uses pivot-powered dynamic charts that auto-refresh when you update the data sheet. No VBA or macros are required — everything runs on standard Excel formulas and pivot tables. The Warehouse Analysis page provides deep-dive analytics into inventory movement and stock turnover. The Shipping Insights page tracks carrier performance and delivery costs. The Worker Productivity page evaluates individual and shift-level warehouse performance. The Order Fulfillment page monitors fulfillment rates, processing times, and order priority trends.
The dashboard works in Microsoft Excel 2016 and later versions. It is fully unlocked and customizable — you can modify charts, add new KPIs, change color themes, and adjust slicer options to match your warehouse setup. For complementary supply chain analytics, explore the Procurement Management Dashboard in Excel and the Trucking and Logistics Dashboard in Excel. Browse all available Excel Dashboard Templates on NextGenTemplates.
Click here to Purchase Warehouse Efficiency Dashboard in Excel
Dashboard Pages Explained
1. Overview
The Overview page serves as the executive command center of the entire warehouse operation. At the top, KPI cards display real-time metrics: Total Orders, Total Units Shipped, Order Fulfillment Rate, Avg Processing Time, and On-Time Shipment %. These cards provide an instant snapshot of your warehouse performance health without drilling into details.
Below the KPI cards, dynamic charts deliver deeper analysis: Orders by Warehouse Zone reveals which zones handle the highest volume. Units Shipped by Month shows seasonal throughput patterns. Order Status Distribution breaks down orders by their current fulfillment stage. Fulfillment Rate by Product Category highlights which product categories have the best and worst fulfillment performance. Multiple slicers let you filter the entire page with a single click for targeted analysis during executive meetings.
Warehouse Efficiency Dashboard in Excel — Overview
2. Warehouse Analysis
The Warehouse Analysis page dives deep into warehouse-level operational performance. This page provides detailed insights into inventory movement by category to identify fast-moving vs slow-moving product lines. Stock Turnover by Zone reveals which zones have the healthiest inventory rotation. Units Received vs Units Shipped tracks inbound and outbound flow trends over time. Storage utilization analysis highlights areas where space is being underused or overloaded.
Warehouse managers use this page to optimize stock placement, plan reorder cycles, and reduce dead stock that consumes valuable storage space. For comprehensive inventory management across multiple locations, consider the Inventory & Warehouse Master Kit.
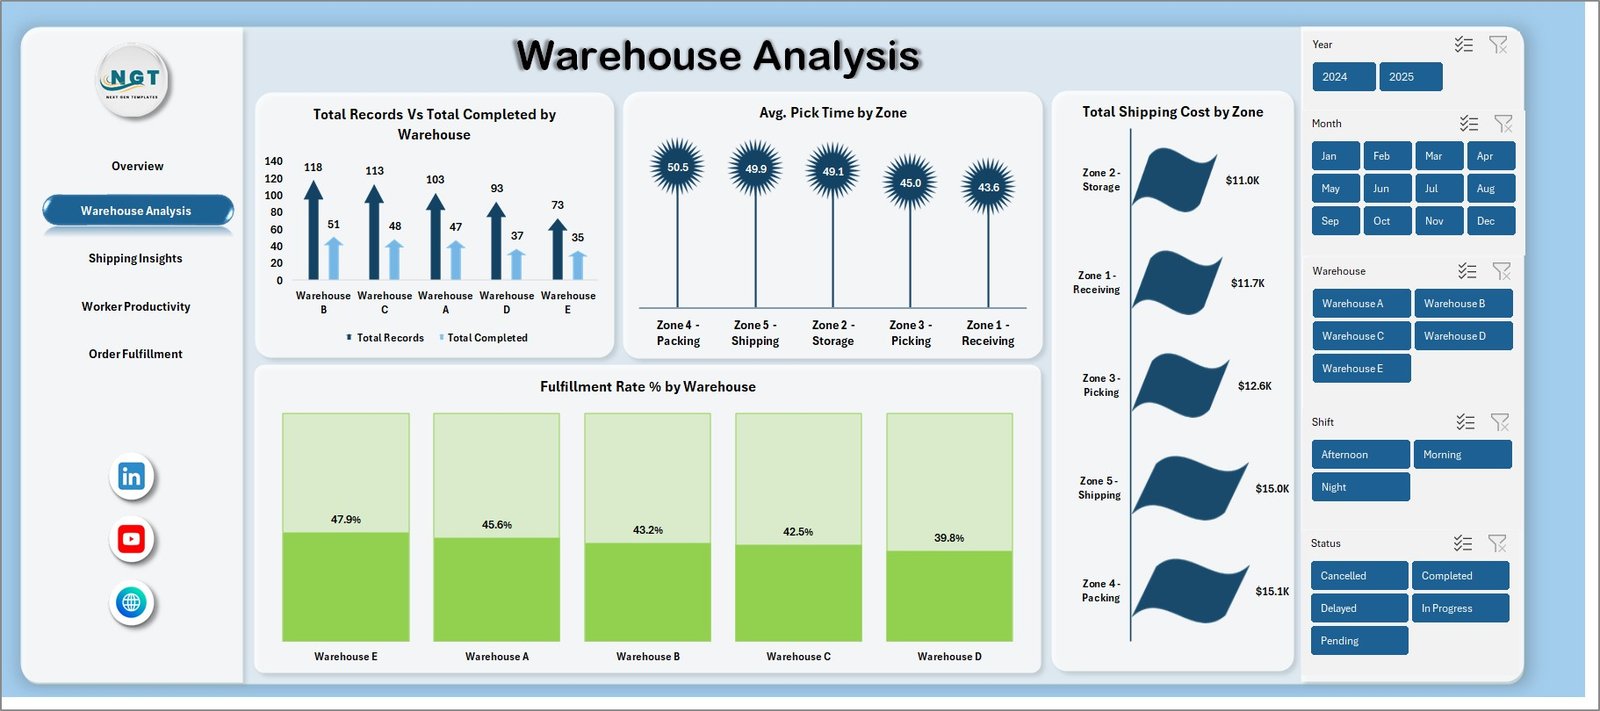
Warehouse Analysis
3. Shipping Insights
The Shipping Insights page focuses on the outbound logistics side of warehouse operations. On-Time Shipment Rate by Carrier tracks which carriers consistently meet delivery deadlines and which ones need attention. Shipping Cost by Zone breaks down logistics costs across geographic regions. Delivery Delays by Category reveals which product categories experience the most shipping delays. Monthly Shipping Volume Trends shows seasonal shipping patterns to support capacity planning and carrier negotiations.
Logistics coordinators and supply chain directors use this page to optimize carrier selection, negotiate better shipping rates, and reduce delivery delays. For broader supply chain visibility, explore the Supply Chain Analytics Dashboard in HTML.
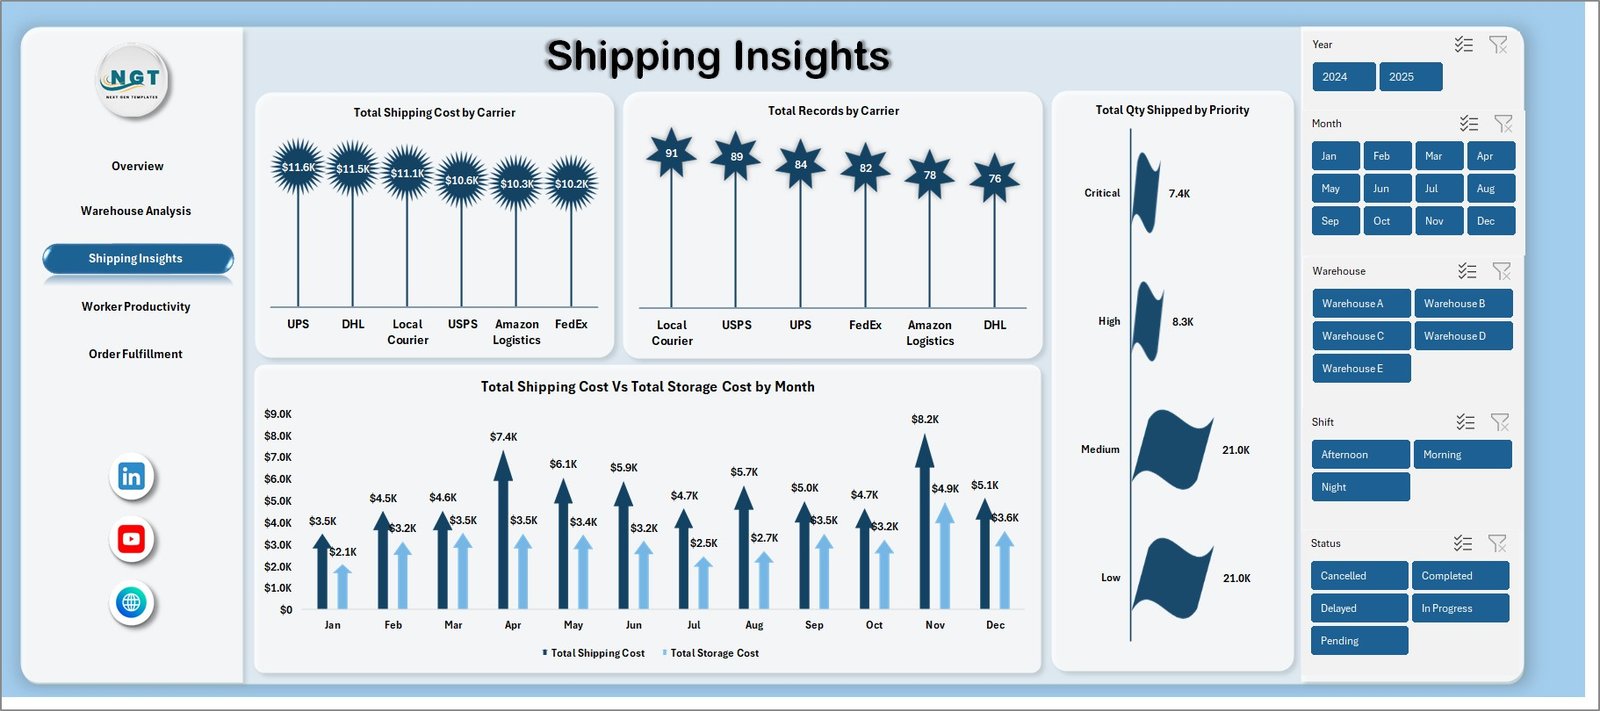
Shipping Insights
4. Worker Productivity
The Worker Productivity page evaluates individual and team-level warehouse performance. Orders Processed by Worker compares workload distribution across your workforce. Units Picked Per Shift reveals shift-level productivity patterns — morning, afternoon, and night shifts can be compared directly. Processing Time by Worker identifies workers with the fastest and slowest order completion times. Shift-Level Productivity Analysis provides a broad view of which shifts achieve the highest throughput, supporting workforce scheduling and staffing decisions.
HR managers and warehouse supervisors use this page for performance reviews, incentive planning, and shift optimization. For complementary logistics and fleet management analytics, check out the Trucking and Logistics Dashboard in Excel.
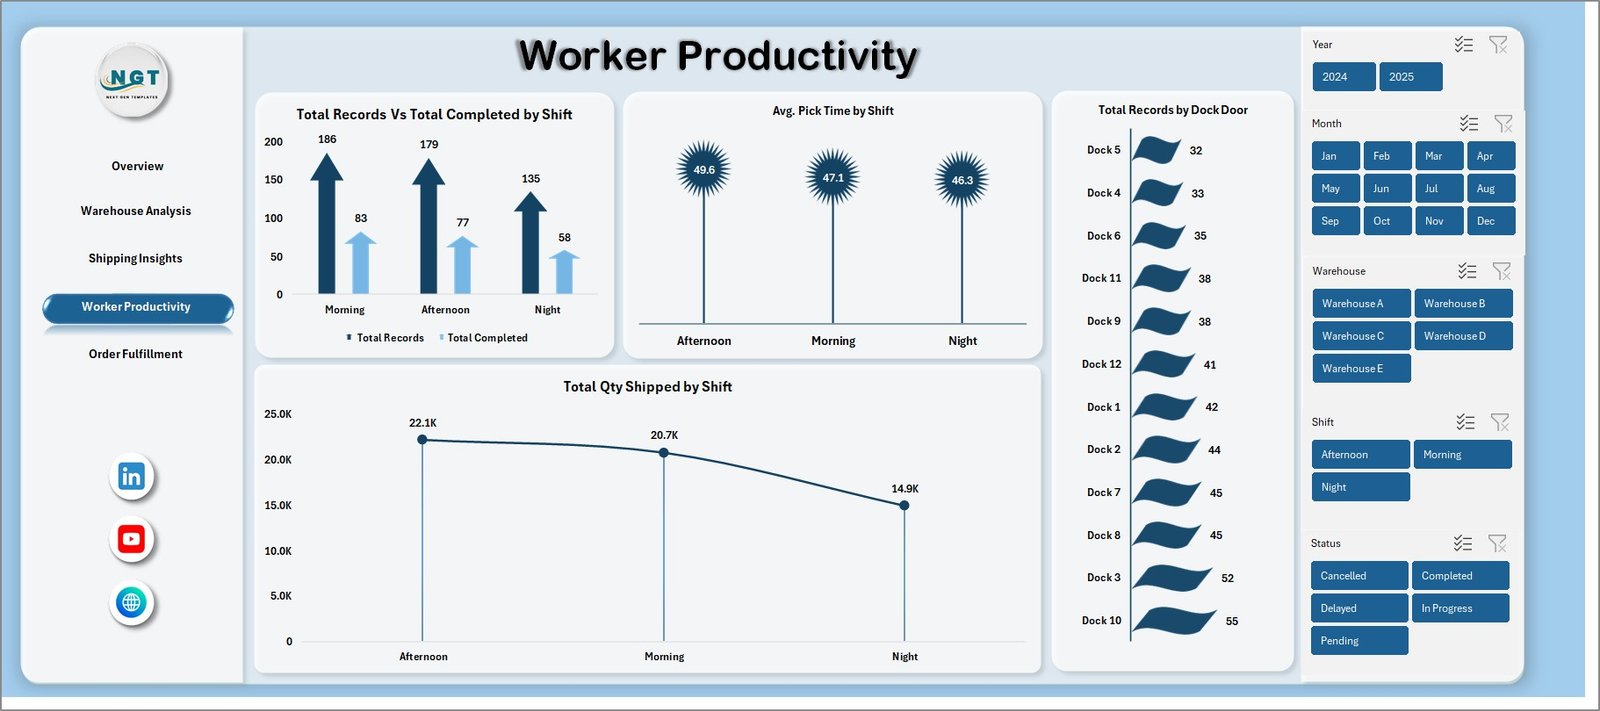
Worker Productivity
5. Order Fulfillment
The Order Fulfillment page dives deep into how efficiently your warehouse processes and fulfills customer orders. Fulfillment Rate by Zone identifies which warehouse zones achieve the highest completion rates. Orders by Status and Priority reveals how orders are distributed across different priority levels and fulfillment stages. Avg Processing Time by Category tracks how long different product categories take to pick, pack, and ship. Fulfillment Trends Over Time displays monthly fulfillment rate patterns, helping managers spot seasonal bottlenecks and capacity constraints early.
This page is essential for operations managers focused on reducing order cycle times, improving fulfillment accuracy, and identifying zones that need additional staffing or process improvements. For more advanced procurement analysis to support warehouse operations, explore the Procurement Management Dashboard in Excel.
Click here to Purchase Warehouse Efficiency Dashboard in Excel
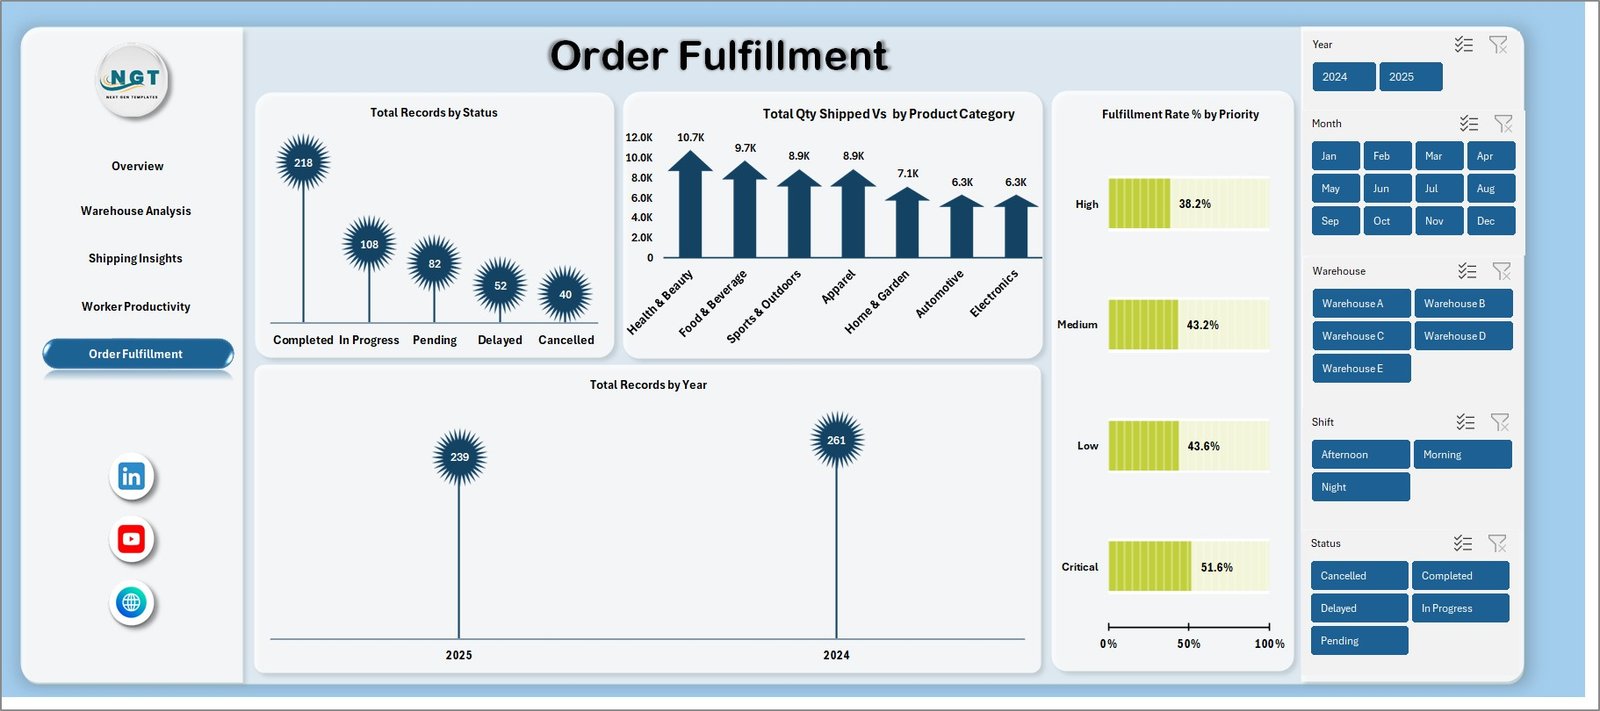
Order Fulfillment
6. Data Sheet
The Data Sheet is where you enter your warehouse transaction records. Simply add your data in the same format as the sample dataset provided — maintaining the same column structure — and the entire dashboard will auto-update when you refresh the pivot tables. Fields include order date, warehouse zone, product category, worker name, shift, units ordered, units shipped, processing time, order status, shipment status, carrier, shipping cost, and priority level. A pre-loaded sample dataset with 500 records is included so you can see the dashboard in action immediately.

Data Sheet
7. Support Sheet
The Support Sheet contains all the pivot tables that power the dashboard’s charts and KPI cards dynamically. After updating your data in the Data Sheet, go to the Data tab in the Excel Ribbon and click Refresh All — all pivots will recalculate and all charts will update automatically. You can keep this sheet hidden during everyday use to maintain a clean and professional workbook appearance when sharing with stakeholders.

Support Sheet
Advantages of the Warehouse Efficiency Dashboard in Excel
- Centralized Warehouse Visibility — Consolidate all warehouse metrics into one interactive dashboard instead of juggling multiple reports and spreadsheets. Get instant visibility into fulfillment, inventory, workforce, and shipping performance.
- Zero Learning Curve — No macros, no VBA, no complex setup. If you can paste data into Excel and click a button, you can use this dashboard. It works entirely on standard pivot tables and charts.
- Instant Data Refresh — Pivot-powered architecture means one click updates every chart, card, and metric across all 5 pages. Replace sample data with your own and click Refresh All.
- Workforce Performance Insights — The Worker Productivity page lets you compare worker output, shift performance, and processing times to make data-driven staffing and scheduling decisions.
- Cross-Platform Compatibility — Works with Microsoft Excel 2016 and later, including Microsoft 365. No additional software or cloud subscriptions needed.
Opportunities for Improvement
- WMS Integration — Connecting the dashboard to a Warehouse Management System (WMS) data feed would enable real-time automated updates instead of manual data entry.
- Additional KPIs — Adding metrics such as Picking Accuracy Rate, Storage Utilization %, and Returns Processing Time would extend the analytics scope for larger operations.
- Barcode Scanning Integration — Pairing this dashboard with VBA-powered barcode scanning would automate data collection and reduce manual entry errors.
- Conditional Formatting Alerts — Adding color-coded alerts for KPIs that fall below target thresholds would make the Overview page even more actionable for daily management reviews.
Best Practices for Using This Dashboard
- Update Data Weekly — Refresh your warehouse data at least once a week and click Refresh All in the Data tab for the most accurate and actionable insights.
- Start with the Overview — Use the Overview page to identify areas of concern, then drill into Warehouse Analysis, Shipping Insights, Worker Productivity, or Order Fulfillment for detailed analysis.
- Use Slicers Strategically — Combine multiple slicer selections to create focused views such as “Morning Shift orders in Zone A for Q1” for targeted operational reviews.
- Benchmark Monthly — Compare current month performance against prior periods using the trend charts to track improvement over time.
- Hide the Support Sheet — Right-click the Support Sheet tab and select Hide to keep the workbook clean when sharing with executives or stakeholders.
Explore Relevant Templates
🔹 Inventory & Warehouse Master Kit — Bundle of 8 premium inventory and warehouse templates for Excel, Google Sheets, VBA, and Power BI at 36% savings.
🔹 Procurement Management Dashboard in Excel — Track procurement spending, supplier performance, and budget compliance across 5 interactive pages.
🔹 Trucking and Logistics Dashboard in Excel — Monitor fleet operations, driver performance, route analysis, and financial trends.
🔹 Supply Chain Analytics Dashboard in HTML — Monitor supply chain performance with interactive HTML charts and filters.
🔹 Third-Party Logistics (3PL) Dashboard in Excel — Track 3PL performance, costs, and delivery metrics across all your logistics partners.
Frequently Asked Questions
What KPIs does the Warehouse Efficiency Dashboard in Excel track?
The Warehouse Efficiency Dashboard in Excel tracks key performance indicators including Total Orders, Total Units Shipped, Order Fulfillment Rate, Avg Processing Time, and On-Time Shipment %. These KPIs are displayed on the Overview page through interactive KPI cards and are analyzed across all 5 dashboard pages.
How many dashboard pages are included in this Excel template?
This template includes 5 interactive dashboard pages: Overview, Warehouse Analysis, Shipping Insights, Worker Productivity, and Order Fulfillment. Additionally, there is a Data Sheet for entering your warehouse records and a Support Sheet containing the pivot tables that power all the charts.
Do I need VBA or macros to use this warehouse dashboard?
No. The Warehouse Efficiency Dashboard in Excel is 100% formula and pivot-table based. No VBA or macros are needed. It works in Microsoft Excel 2016 and later versions without enabling macros, making it safe, lightweight, and accessible for any user.
Can I track individual worker productivity with this Excel template?
Yes. The Worker Productivity page includes dedicated charts comparing orders processed by worker, units picked per shift, processing time by worker, and shift-level productivity trends. You can use slicers to filter by specific workers for individual performance reviews.
What is the best Excel template for tracking warehouse efficiency?
The Warehouse Efficiency Dashboard in Excel from NextGenTemplates is one of the most comprehensive warehouse analytics templates available. It features 5 interactive dashboard pages — Overview, Warehouse Analysis, Shipping Insights, Worker Productivity, and Order Fulfillment — all powered by pivot tables with automatic refresh and built-in slicer filtering.
How do I update the dashboard with my own warehouse data?
Navigate to the Data Sheet tab, replace the 500 sample records with your own warehouse transaction data in the same column format, then click Refresh All in the Data tab. All pivot tables and charts across all 5 dashboard pages will update instantly with your data.
Conclusion
The Warehouse Efficiency Dashboard in Excel is a must-have analytics tool for any warehouse team looking to gain visibility into order fulfillment rates, inventory turnover, workforce productivity, and shipping performance. With 5 interactive pages — Overview, Warehouse Analysis, Shipping Insights, Worker Productivity, and Order Fulfillment — plus KPI cards and 20+ dynamic charts, this template transforms complex warehouse data into clear, actionable insights that drive better operational decisions.
Whether you manage a single warehouse or coordinate operations across multiple fulfillment centers, this dashboard provides the clarity and speed you need to stay on top of every order, every worker, and every shipment.
Click here to Purchase Warehouse Efficiency Dashboard in Excel
🎥 Visit our YouTube channel to learn step-by-step video tutorials
👉 Youtube.com/@PK-AnExcelExpert
For more Excel resources: Microsoft Excel Support