New: NextGenTemplates Academy - video courses on Excel formulas with AI and Pivot Tables & dashboards. Early-bird: 20% off with code EARLYBIRD20 - first 20 orders only. See the courses →
  • Learn Excel (Free Course)
    • 1. Shortcut Keys
    • 2. Fill & Flash Fill
    • 3. Find & Replace
    • 4. Sort & Filter
    • 5. Formulas & Functions
    • 6. Data Validation
    • 7. Conditional Formatting
    • 8. Basic Charts
    • 9. Advanced Charts
    • 10. Pivot Tables
    • 11. Excel Dashboards
    • 12. VBA Course
    • 13. Excel Formulas with AI
  • Templates
  • Tutorials
    • Charts and Visualization
    • VBA
    • Excel Tips and Tricks
    • Excel Dashboards
    • Power Pivot & DAX
  • Power BI
  • Template Store
    • Ready to Use Templates
  • Courses
  • Academy
    • Excel + AI Mastery: 100 Formulas
    • Excel Pivot Tables & Dashboards
  • About Us
  • Contact Us

PK: An Excel Expert

Transforming Data into Decisions

Tag: warehouse dashboard

Dashboard Power BI

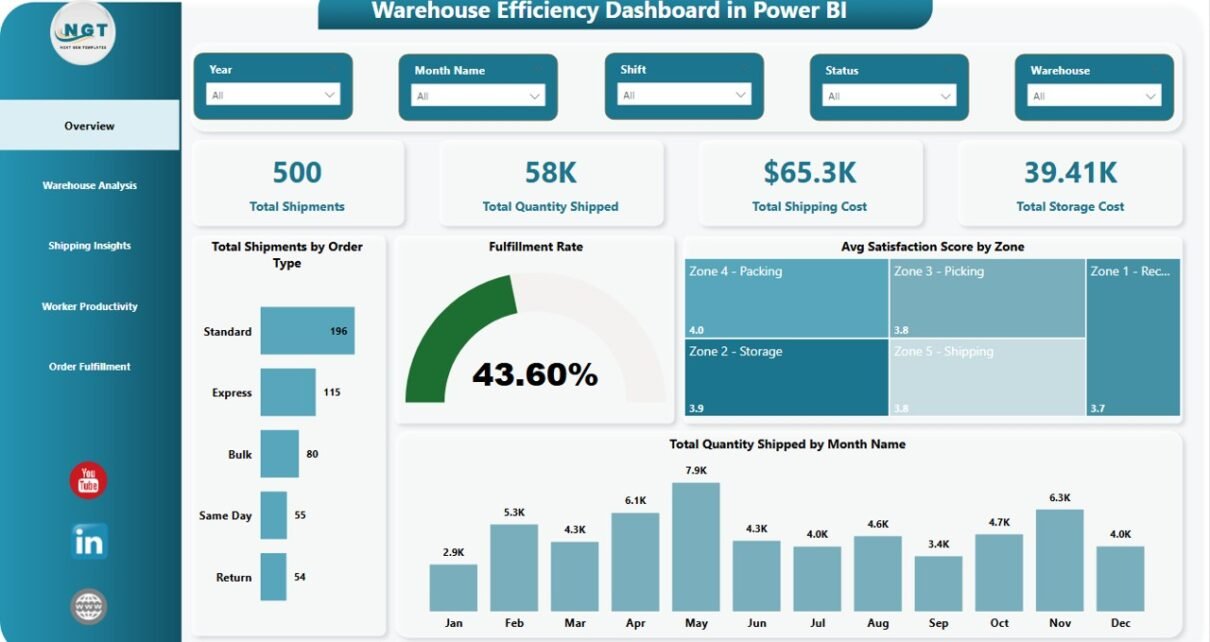
Warehouse Efficiency Dashboard in Power BI

April 19, 2026April 20, 2026 PKComments Off on Warehouse Efficiency Dashboard in Power BI
The average mid-sized warehouse handles between 2,500 and 15,000 shipments a month across multiple zones, 2–3 shifts, and 3–5 carriers — yet most ops teams still track that complexity in
Read More
Dashboard

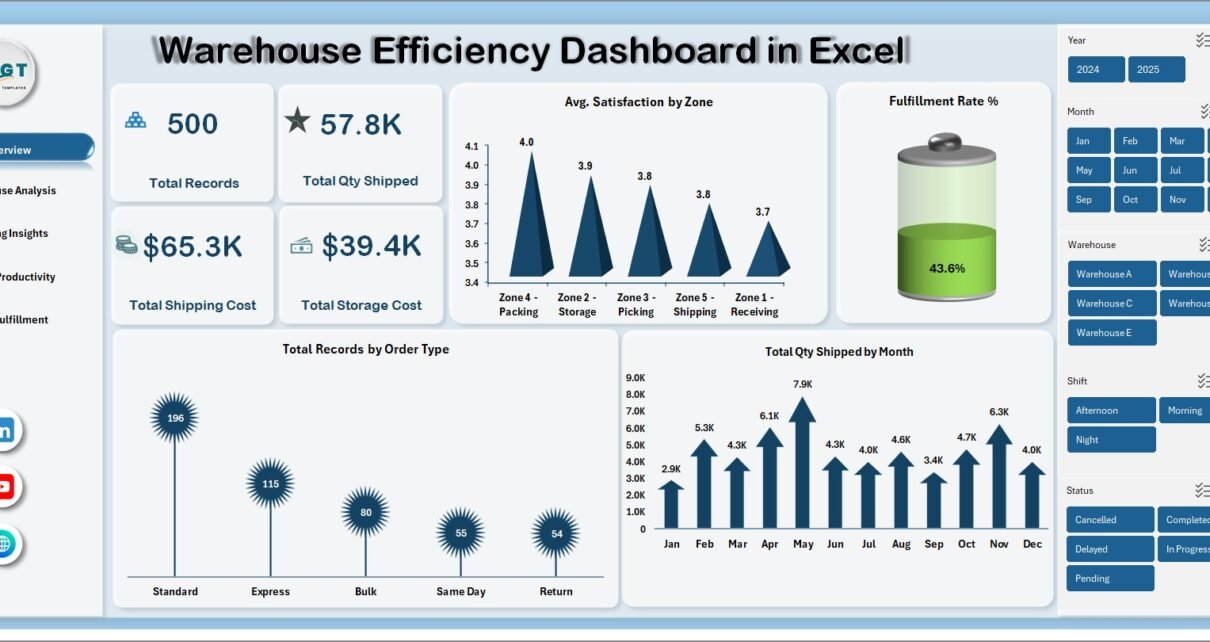
Warehouse Efficiency Dashboard in Excel

April 15, 2026April 15, 2026 PKComments Off on Warehouse Efficiency Dashboard in Excel
Warehouse Efficiency Dashboard in Excel is a comprehensive, ready-to-use Excel dashboard template designed for warehouse managers, logistics coordinators, supply chain directors, and operations teams who need to monitor warehouse throughput,
Read More
Dashboard Power BI

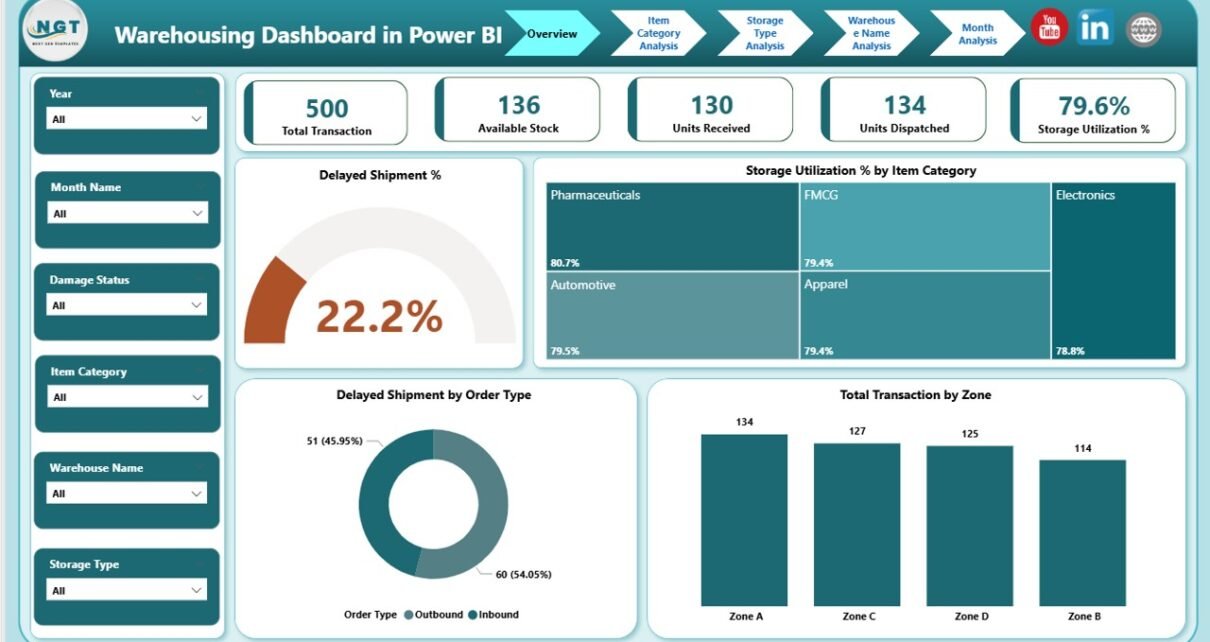
Warehousing Dashboard in Power BI

February 2, 2026February 2, 2026 PKComments Off on Warehousing Dashboard in Power BI
Managing a warehouse involves constant movement—inventory flows in, orders flow out, and data flows across systems. However, when warehouse data stays scattered across spreadsheets and manual reports, visibility drops and
Read More
Dashboard

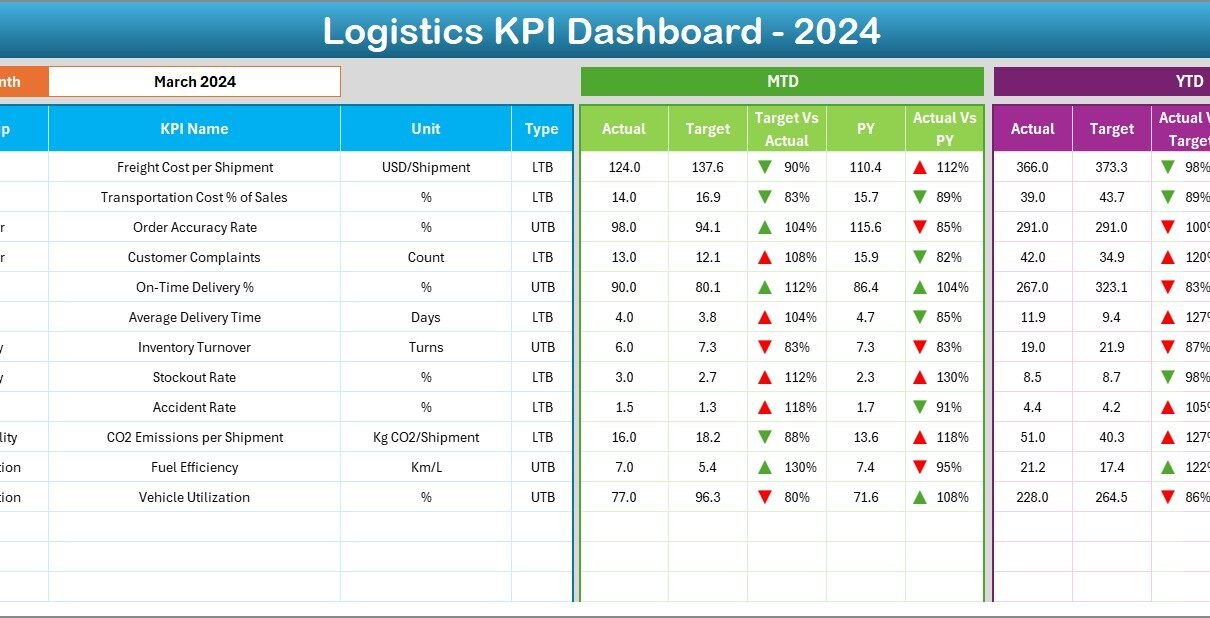
Logistics KPI Dashboard in Excel

September 12, 2025September 12, 2025 PKComments Off on Logistics KPI Dashboard in Excel
Managing logistics operations is a complex process. From inventory management to delivery timelines, businesses must monitor performance constantly to ensure cost efficiency and customer satisfaction. This is where a Logistics
Read More
  • Learn Excel (Free Course)
    • 1. Shortcut Keys
    • 2. Fill & Flash Fill
    • 3. Find & Replace
    • 4. Sort & Filter
    • 5. Formulas & Functions
    • 6. Data Validation
    • 7. Conditional Formatting
    • 8. Basic Charts
    • 9. Advanced Charts
    • 10. Pivot Tables
    • 11. Excel Dashboards
    • 12. VBA Course
    • 13. Excel Formulas with AI
  • Templates
  • Tutorials
    • Charts and Visualization
    • VBA
    • Excel Tips and Tricks
    • Excel Dashboards
    • Power Pivot & DAX
  • Power BI
  • Template Store
    • Ready to Use Templates
  • Courses
  • Academy
    • Excel + AI Mastery: 100 Formulas
    • Excel Pivot Tables & Dashboards
  • About Us
  • Contact Us
Copyright © 2023 PK-AnExcelExpert.com - Privacy Policy