New: NextGenTemplates Academy - video courses on Excel formulas with AI and Pivot Tables & dashboards. Early-bird: 20% off with code EARLYBIRD20 - first 20 orders only. See the courses →
  • Learn Excel (Free Course)
    • 1. Shortcut Keys
    • 2. Fill & Flash Fill
    • 3. Find & Replace
    • 4. Sort & Filter
    • 5. Formulas & Functions
    • 6. Data Validation
    • 7. Conditional Formatting
    • 8. Basic Charts
    • 9. Advanced Charts
    • 10. Pivot Tables
    • 11. Excel Dashboards
    • 12. VBA Course
    • 13. Excel Formulas with AI
  • Templates
  • Tutorials
    • Charts and Visualization
    • VBA
    • Excel Tips and Tricks
    • Excel Dashboards
    • Power Pivot & DAX
  • Power BI
  • Template Store
    • Ready to Use Templates
  • Courses
  • Academy
    • Excel + AI Mastery: 100 Formulas
    • Excel Pivot Tables & Dashboards
  • About Us
  • Contact Us

PK: An Excel Expert

Transforming Data into Decisions

Tag: carbon emissions

Dashboard Templates

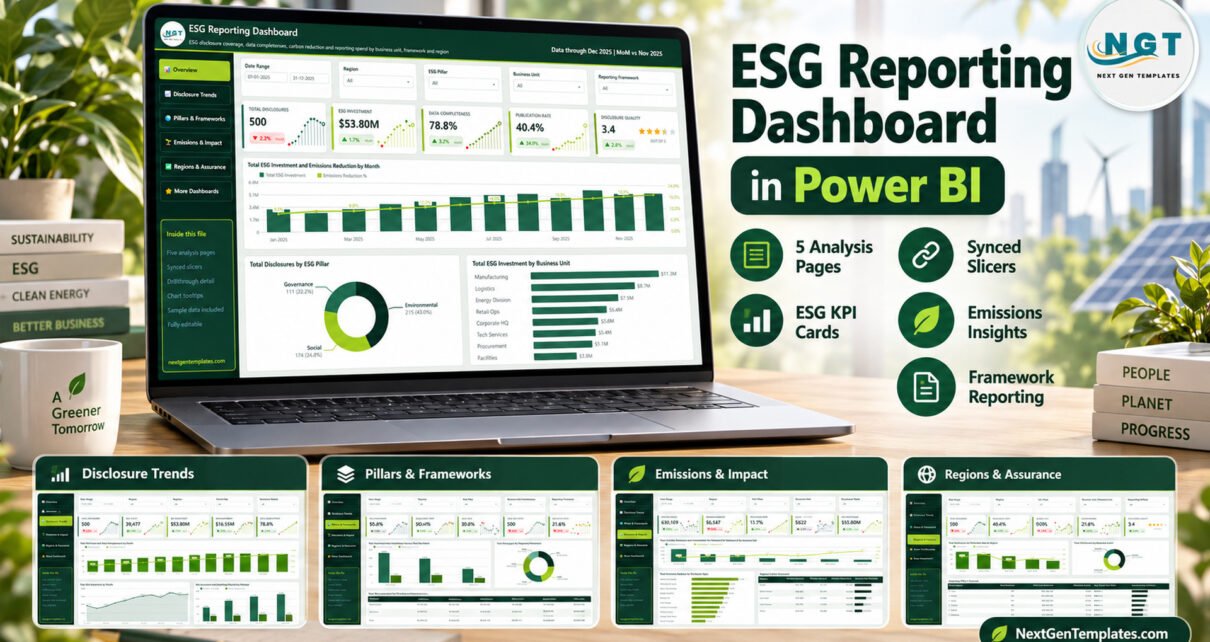
ESG Reporting Dashboard in Power BI

September 16, 2026September 16, 2026 PKComments Off on ESG Reporting Dashboard in Power BI
The ESG Reporting Dashboard in Power BI gives sustainability, finance and investor-relations teams one report for the questions that come up in every ESG review: how much are we investing,
Read More
Power BI Templates

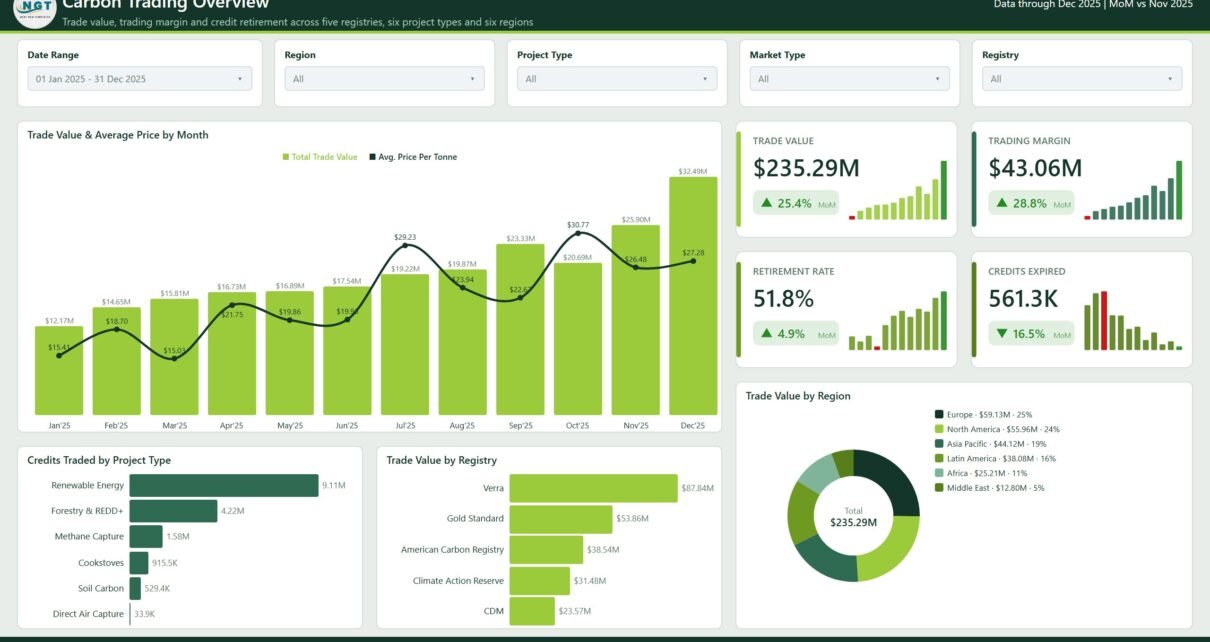
Carbon Trading Dashboard in Power BI

August 20, 2026August 20, 2026 PKComments Off on Carbon Trading Dashboard in Power BI
If your desk already keeps a carbon credit trade log in a spreadsheet, the monthly reporting pass is usually the tedious part - the same pivot tables rebuilt, the same
Read More
Power BI

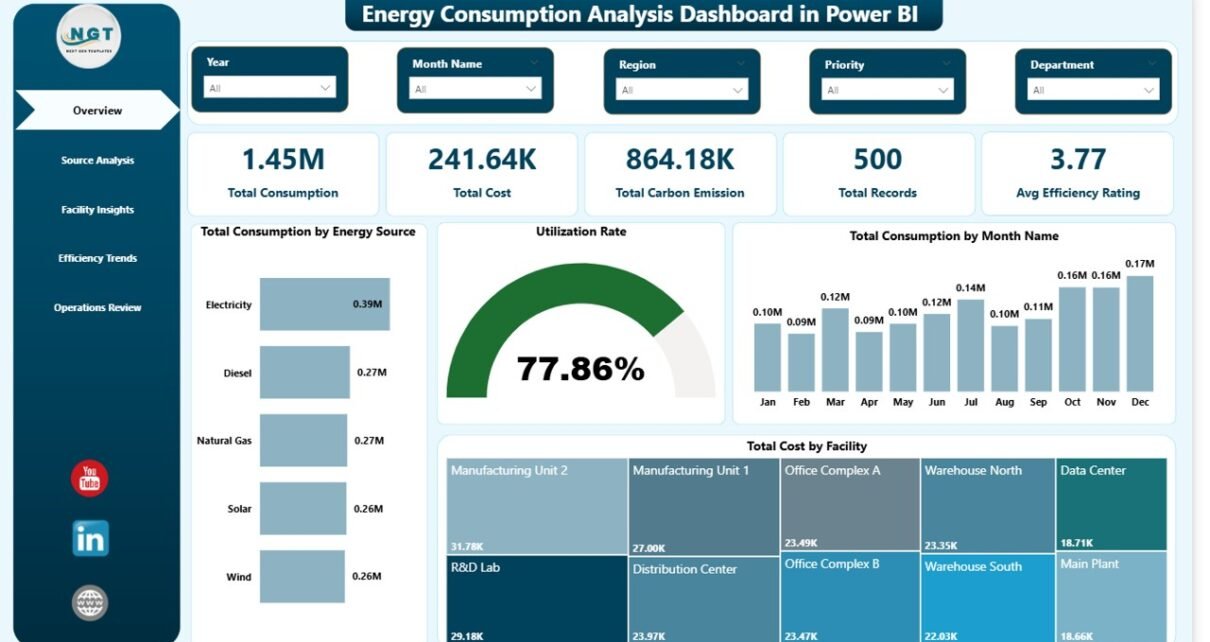
Energy Consumption Analysis Dashboard in Power BI

April 14, 2026April 14, 2026 PKComments Off on Energy Consumption Analysis Dashboard in Power BI
Energy Consumption Analysis Dashboard in Power BI is a professionally designed, interactive Power BI dashboard template that empowers energy managers, facility operators, sustainability officers, and operations teams to monitor energy
Read More
Dashboard

Carbon Footprint KPI Dashboard in Excel

April 21, 2025April 21, 2025 PKComments Off on Carbon Footprint KPI Dashboard in Excel
As climate change continues to dominate global conversations, businesses are increasingly adopting strategies to reduce their carbon footprint. One effective way of tracking and improving these efforts is by using
Read More
Dashboard

Environmental Compliance KPI Dashboard in Excel

December 18, 2024March 9, 2025 PKComments Off on Environmental Compliance KPI Dashboard in Excel
Environmental compliance is critical for businesses, industries, and organizations to ensure that they meet environmental regulations, minimize environmental impact, and contribute to sustainability. Achieving this goal requires robust tracking, monitoring,
Read More
  • Learn Excel (Free Course)
    • 1. Shortcut Keys
    • 2. Fill & Flash Fill
    • 3. Find & Replace
    • 4. Sort & Filter
    • 5. Formulas & Functions
    • 6. Data Validation
    • 7. Conditional Formatting
    • 8. Basic Charts
    • 9. Advanced Charts
    • 10. Pivot Tables
    • 11. Excel Dashboards
    • 12. VBA Course
    • 13. Excel Formulas with AI
  • Templates
  • Tutorials
    • Charts and Visualization
    • VBA
    • Excel Tips and Tricks
    • Excel Dashboards
    • Power Pivot & DAX
  • Power BI
  • Template Store
    • Ready to Use Templates
  • Courses
  • Academy
    • Excel + AI Mastery: 100 Formulas
    • Excel Pivot Tables & Dashboards
  • About Us
  • Contact Us
Copyright © 2023 PK-AnExcelExpert.com - Privacy Policy