New: NextGenTemplates Academy - video courses on Excel formulas with AI and Pivot Tables & dashboards. Early-bird: 20% off with code EARLYBIRD20 - first 20 orders only. See the courses →
  • Learn Excel (Free Course)
    • 1. Shortcut Keys
    • 2. Fill & Flash Fill
    • 3. Find & Replace
    • 4. Sort & Filter
    • 5. Formulas & Functions
    • 6. Data Validation
    • 7. Conditional Formatting
    • 8. Basic Charts
    • 9. Advanced Charts
    • 10. Pivot Tables
    • 11. Excel Dashboards
    • 12. VBA Course
    • 13. Excel Formulas with AI
  • Templates
  • Tutorials
    • Charts and Visualization
    • VBA
    • Excel Tips and Tricks
    • Excel Dashboards
    • Power Pivot & DAX
  • Power BI
  • Template Store
    • Ready to Use Templates
  • Courses
  • Academy
    • Excel + AI Mastery: 100 Formulas
    • Excel Pivot Tables & Dashboards
  • About Us
  • Contact Us

PK: An Excel Expert

Transforming Data into Decisions

Tag: Emissions Tracking

Power BI

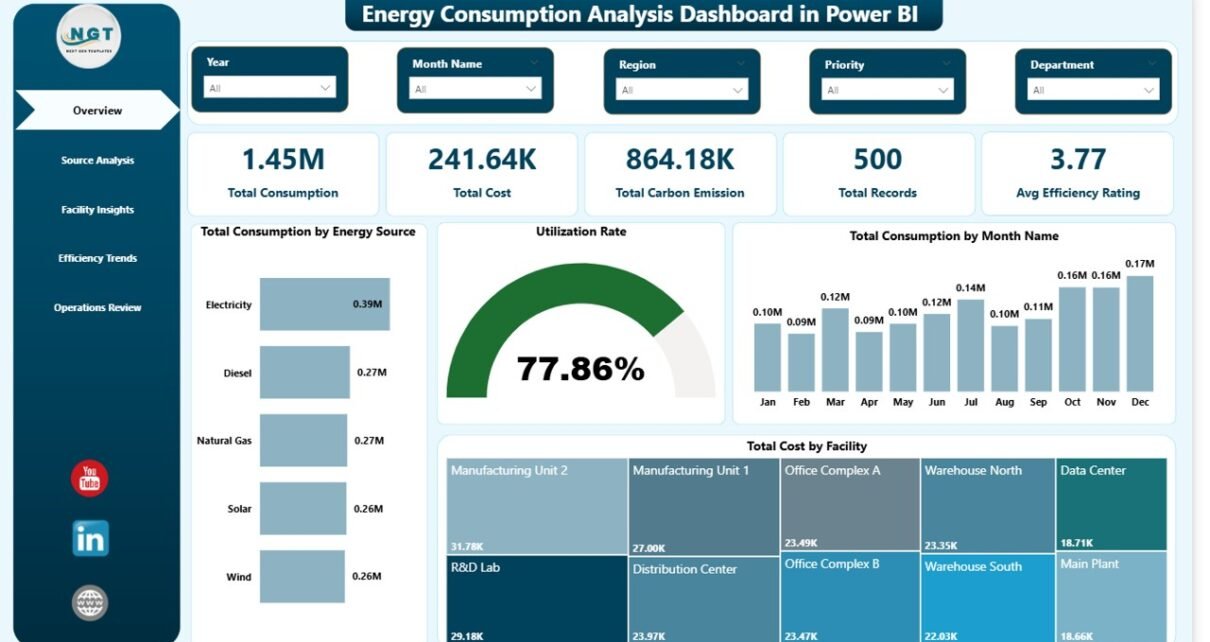
Energy Consumption Analysis Dashboard in Power BI

April 14, 2026April 14, 2026 PKComments Off on Energy Consumption Analysis Dashboard in Power BI
Energy Consumption Analysis Dashboard in Power BI is a professionally designed, interactive Power BI dashboard template that empowers energy managers, facility operators, sustainability officers, and operations teams to monitor energy
Read More
Dashboard Power BI

Environmental Services Dashboard in Power BI

February 25, 2026February 25, 2026 PKComments Off on Environmental Services Dashboard in Power BI
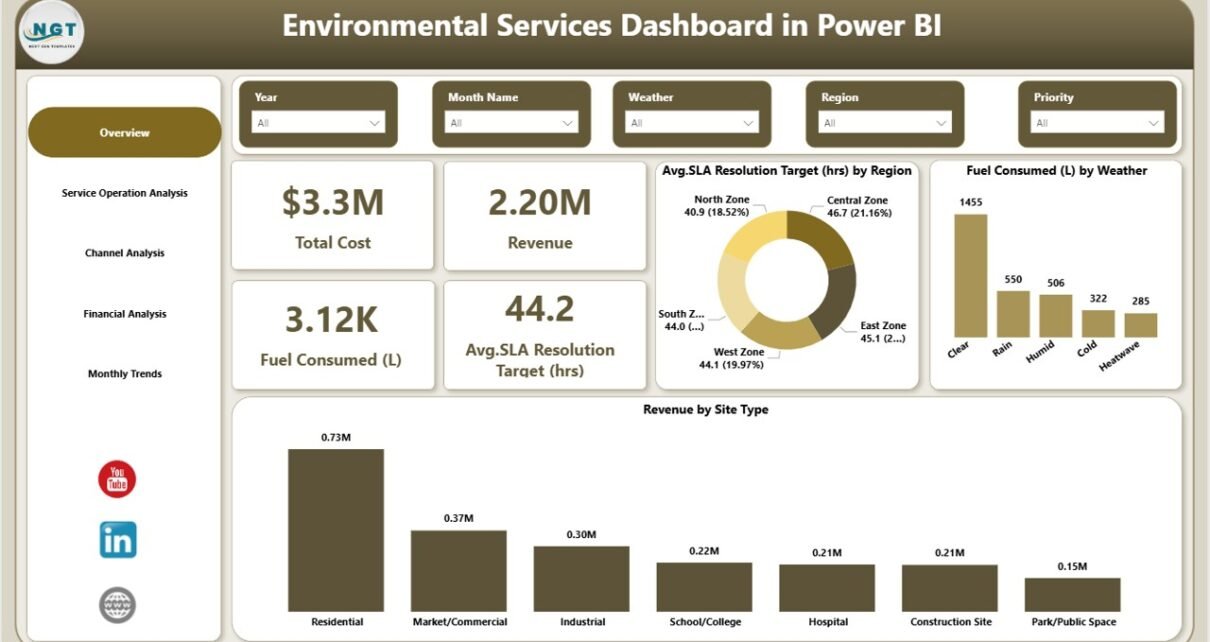
Environmental organizations today operate in a data-driven world. Companies that provide environmental services must monitor fuel consumption, emissions reduction, operational efficiency, service response time, and financial performance simultaneously. However, many
Read More
Dashboard Power BI

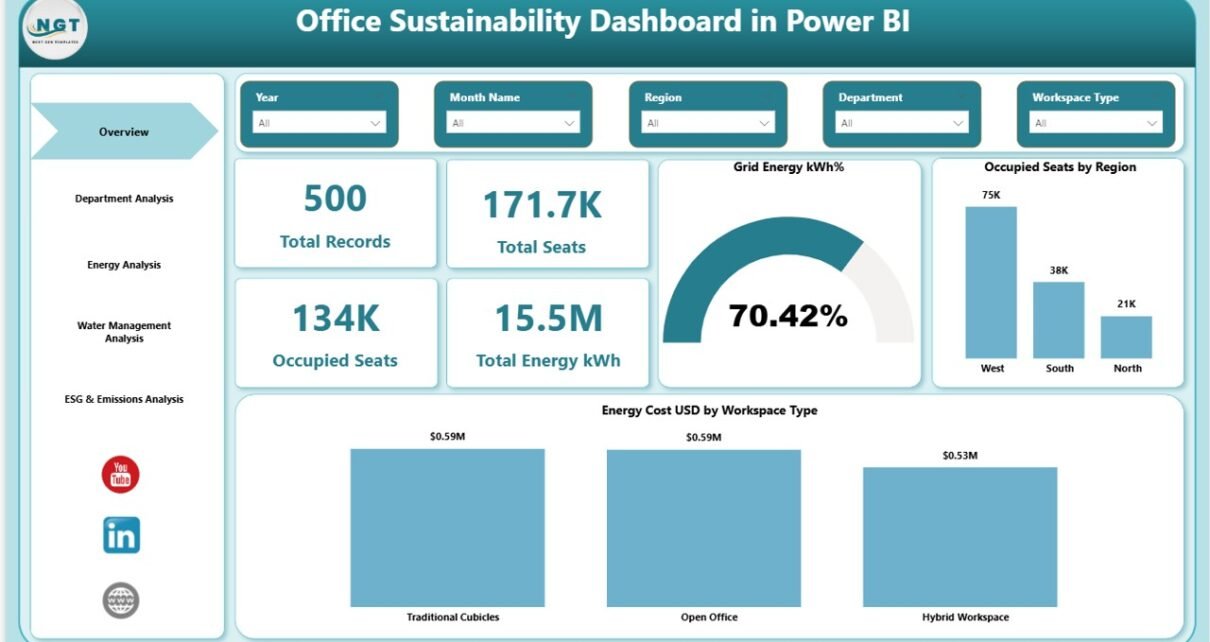
Office Sustainability Dashboard in Power BI

February 9, 2026February 9, 2026 PKComments Off on Office Sustainability Dashboard in Power BI
Sustainability no longer sits on the side of business strategy. Instead, it drives brand value, investor trust, and operational efficiency. Today, companies must track energy use, water consumption, emissions, and
Read More
Dashboard

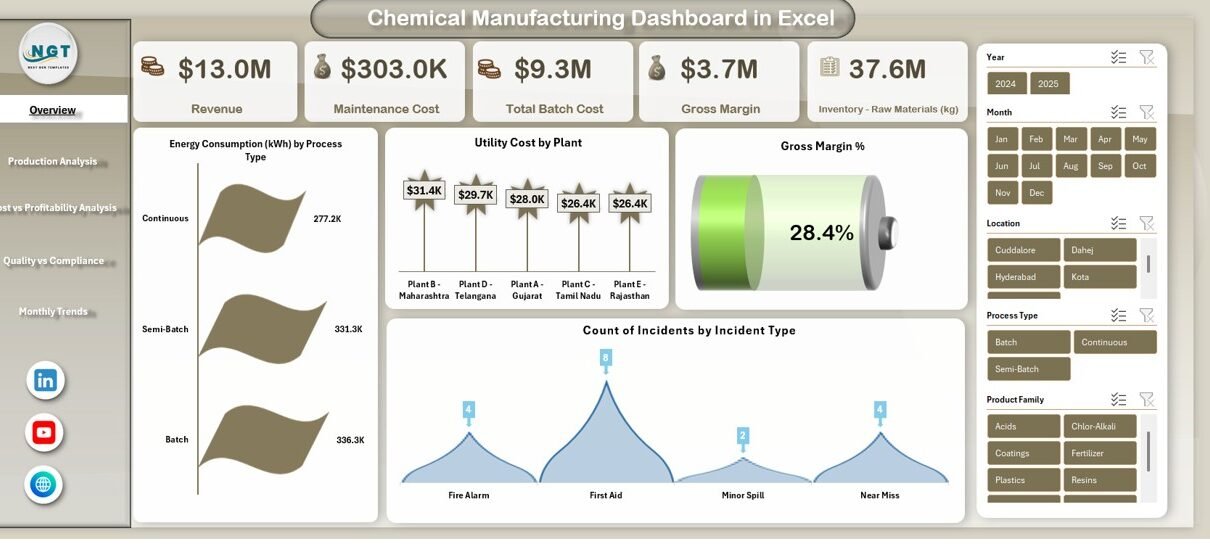
Chemical Manufacturing Dashboard in Excel

January 18, 2026January 18, 2026 PKComments Off on Chemical Manufacturing Dashboard in Excel
In today’s highly regulated and cost-sensitive chemical industry, data-driven decision-making is no longer optional. Chemical manufacturers deal with massive volumes of operational, financial, environmental, and quality data every single day.
Read More
Dashboard

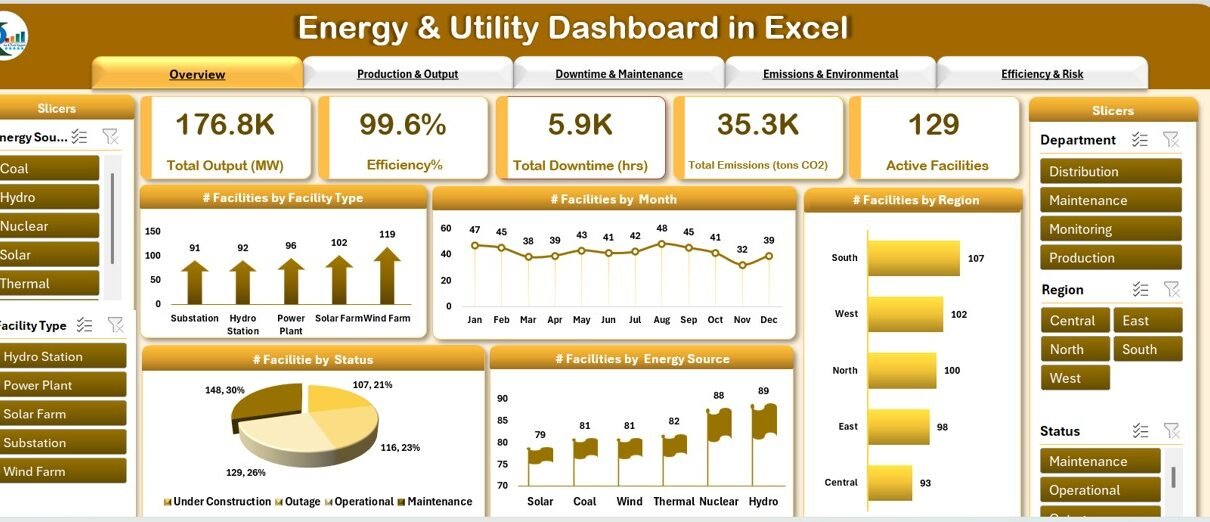
Energy & Utility Dashboard in Excel

May 23, 2025May 23, 2025 PKComments Off on Energy & Utility Dashboard in Excel
In today's fast-paced energy and utility sectors, managing operational data efficiently can significantly impact the overall performance of facilities. An Energy & Utility Dashboard in Excel is a powerful tool
Read More
  • Learn Excel (Free Course)
    • 1. Shortcut Keys
    • 2. Fill & Flash Fill
    • 3. Find & Replace
    • 4. Sort & Filter
    • 5. Formulas & Functions
    • 6. Data Validation
    • 7. Conditional Formatting
    • 8. Basic Charts
    • 9. Advanced Charts
    • 10. Pivot Tables
    • 11. Excel Dashboards
    • 12. VBA Course
    • 13. Excel Formulas with AI
  • Templates
  • Tutorials
    • Charts and Visualization
    • VBA
    • Excel Tips and Tricks
    • Excel Dashboards
    • Power Pivot & DAX
  • Power BI
  • Template Store
    • Ready to Use Templates
  • Courses
  • Academy
    • Excel + AI Mastery: 100 Formulas
    • Excel Pivot Tables & Dashboards
  • About Us
  • Contact Us
Copyright © 2023 PK-AnExcelExpert.com - Privacy Policy