The Pharmacy Dashboard in Power BI is a ready-to-use analytics template that tracks 4 financial KPIs and 14+ visualizations across 5 interactive pages — covering sales, gross profit, total cost, insurance amount, expiry risk, drug category profitability, and store-level performance. Built entirely in Power BI Desktop, it gives independent pharmacies and multi-outlet chains the same board-ready BI that paid vendors like IQVIA and PharmaGuide charge $15,000–$60,000/year for — at a one-time $17.99.
🌍 Used by pharmacy owners, financial analysts, and Power BI consultants in 40+ countries. Instant download · One-time payment · No subscription · Lifetime access.
Why a Power BI Dashboard Is the Right Tool for Pharmacy Analytics
Pharmacy P&L is famously messy. Revenue comes from three very different buckets — patient cash, insurance reimbursements, and wholesale — and each bucket has its own cost structure, margin profile, and delay to collection. Add expiry risk, supplier-level cost volatility, and store-level staff variability, and most spreadsheet-based reporting collapses within 6 months.
Power BI solves this in three ways: real-time refresh from any POS or SQL source, multi-table relationships that let you cross-filter patient demographics against drug categories instantly, and DAX measures that calculate margin, expiry-adjusted inventory value, and insurance-coverage ratios on the fly. The Pharmacy Dashboard in Power BI packages those capabilities into a pre-built .pbix file so you don’t have to model it yourself — see Microsoft’s official Power BI Desktop overview for the underlying platform capabilities.
Key Features of the Pharmacy Dashboard in Power BI
📊 4 financial KPI cards on the Overview page — Total Sales, Gross Profit, Total Cost, Total Insurance Amount — give owners and regional managers a 5-second read on the state of the business every morning.
📈 14+ pre-built charts across five pages, covering profit margin, store location sales, drug category profitability, supplier cost, expiry risk, patient gender and status mix, and insurance coverage ratio.
🔎 Multi-level slicers on every page for store location, drug category, prescription type, department, supplier, gender, and status — no custom DAX needed to drill down.
💾 Works with any data source — CSV from your POS, SQL Server, Excel files, or direct query from Azure SQL. Replace the sample model and every visual updates automatically.
🆓 Runs on free Power BI Desktop. A Pro license is only needed when you want to publish to Power BI Service for web-based team sharing.
Dashboard Pages Explanation
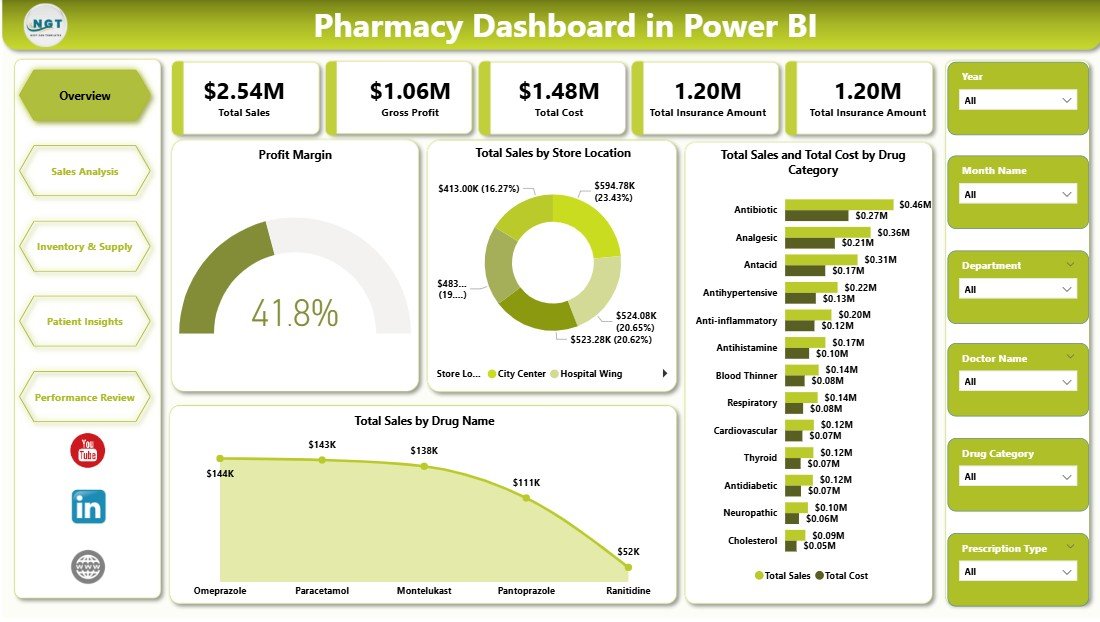
Page 1 — Overview
The entry point of the Pharmacy Dashboard in Power BI. Four KPI cards at the top (Total Sales, Gross Profit, Total Cost, Total Insurance Amount) summarize the business in one glance. Below, the Profit Margin visual tracks health of the bottom line, Total Sales by Store Location benchmarks outlets against each other, Total Sales and Total Cost by Drug Category reveals which therapeutic lines drive revenue and which drive cost, and Total Sales by Drug Name surfaces the SKU-level winners.
Page 2 — Sales Analysis
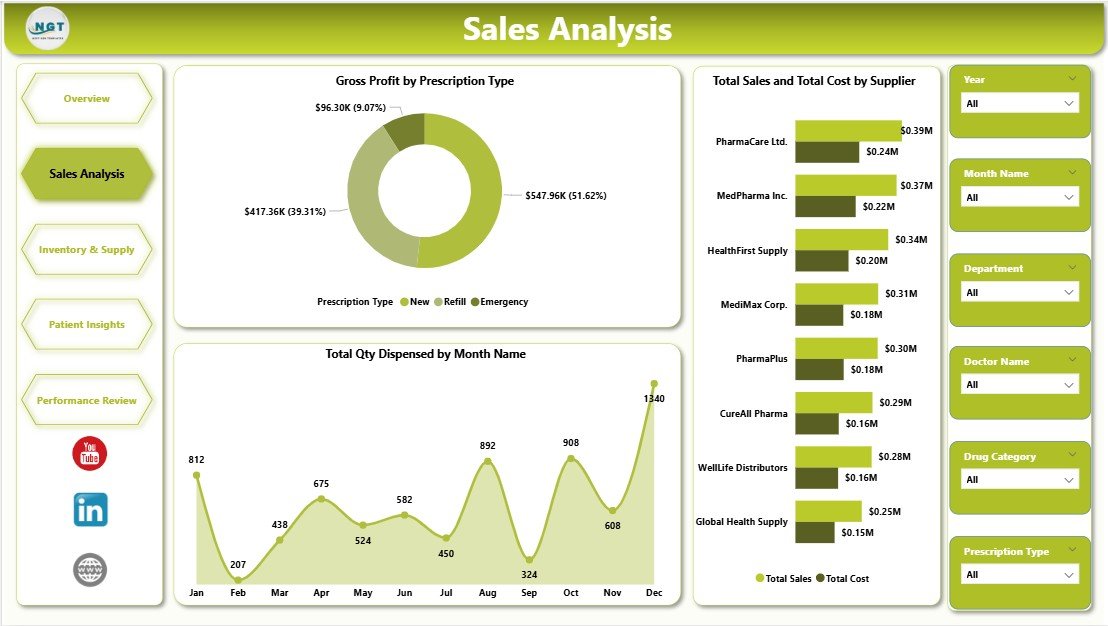
The Gross Profit by Prescription Type chart reveals which script categories (OTC, Prescription, Compounded) carry the highest margin — almost always a surprise for first-time users. Total Sales and Total Cost by Supplier puts vendor performance side-by-side so you can renegotiate terms with weak performers. Total Qty Dispensed by Month Name exposes seasonality, making stock planning and staff rostering far easier.
Page 3 — Inventory & Supply
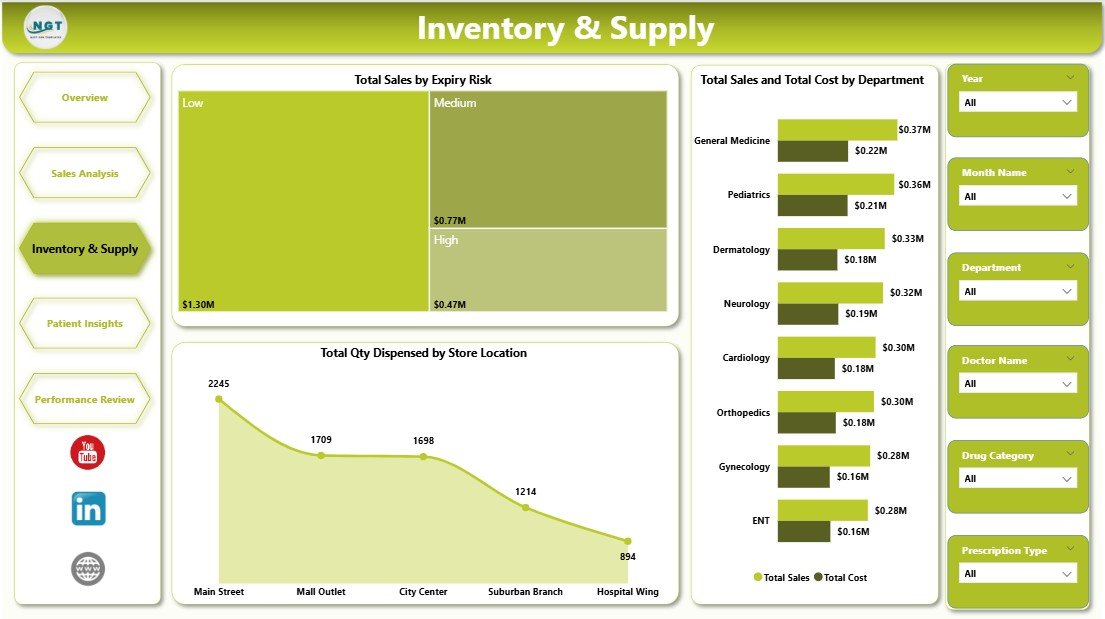
Total Sales by Expiry Risk is the single most valuable visual on this page — it flags revenue tied up in near-expiry stock, the leading source of pharmacy shrinkage. Total Sales and Total Cost by Department shows which lines (Rx, OTC, Wellness, Medical Devices) drive the most volume vs. cost. Total Qty Dispensed by Store Location benchmarks outlets on throughput.
Page 4 — Patient Insights
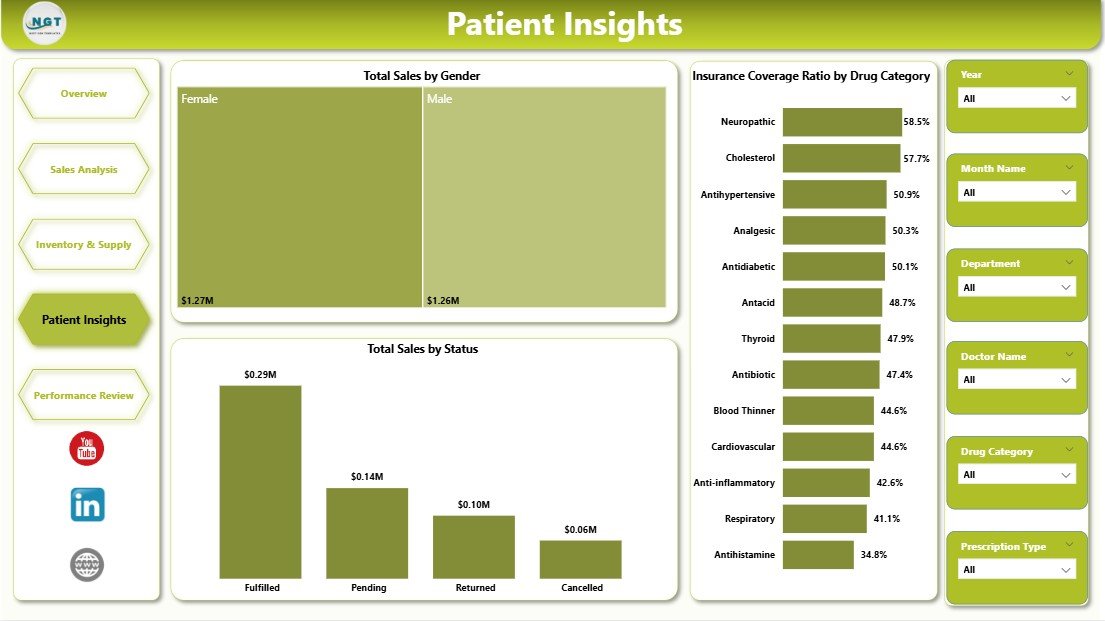
Total Sales by Gender and Total Sales by Status (new, returning, loyalty) reveal the customer mix driving revenue. Insurance Coverage Ratio by Drug Category is the critical one for chain pharmacies — it shows which therapeutic areas are most subsidized, which directly affects forecasting co-pay collections and negotiating better rates with Pharmacy Benefit Managers.
Page 5 — Performance Review
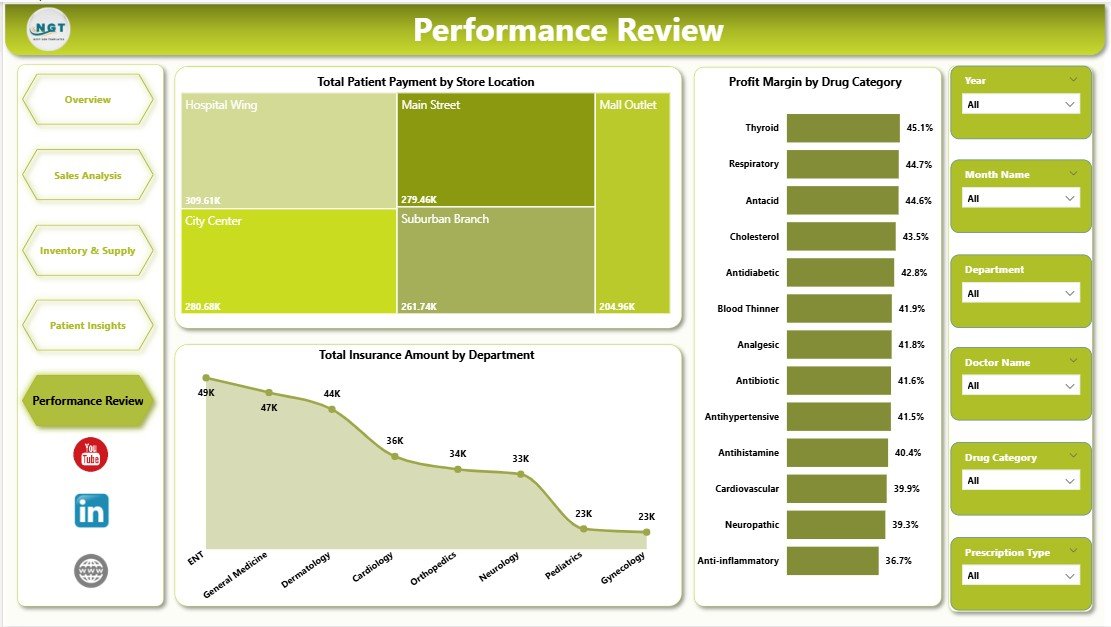
Total Patient Payment by Store Location isolates out-of-pocket cash revenue by outlet. Profit Margin by Drug Category highlights your most profitable therapeutic lines. Total Insurance Amount by Department is designed for month-end reconciliation with PBMs and insurers.
Pharmacy Dashboard in Power BI vs. Tableau vs. IQVIA — Feature Comparison
| Feature | Pharmacy Dashboard in Power BI | Tableau Pharmacy Template | IQVIA / PharmaGuide |
|---|---|---|---|
| Cost | $17.99 one-time | $70+/user/month | $15,000–$60,000 / year |
| Platform | Power BI Desktop (free) | Tableau Desktop | Cloud SaaS |
| Setup time | Under 10 minutes | 2–4 hours | 4–12 weeks |
| Pre-built KPI cards | ✅ 4 ready | ❌ Build yourself | ✅ 50+ locked |
| Customizable visuals | ✅ Fully editable | ✅ Fully editable | ⚠️ Vendor-limited |
| Insurance / co-pay analytics | ✅ Built-in | ❌ | ✅ |
| Year-1 cost at 5 users | $17.99 | $4,200 | $15,000+ |
For independent pharmacies and 2–50 store chains wanting IQVIA-grade visibility without the 5-figure SaaS bill, the Pharmacy Dashboard in Power BI sits in the sweet spot.
Who Should Use This Template
Perfect for:
- Independent pharmacy owners tracking sales, profit, and inventory across 1–20 outlets
- Pharmacy chain regional managers presenting monthly reports to leadership
- Pharmacy accountants reconciling insurance claims and patient co-pays
- Hospital pharmacy directors analyzing dispensing volume and expiry risk
- Power BI consultants who want a pharmacy-ready model to extend for clients
Not a fit if:
- You run an enterprise chain (500+ stores) needing real-time SSAS cubes
- You need clinical DUR / MTM workflows rather than financial reporting
- Your regulatory team requires FDA/DEA audit-trail compliance baked in
Real-World Use Cases
Priya runs a 6-outlet independent pharmacy group in Mumbai. Every Monday morning, she opens the Pharmacy Dashboard in Power BI to compare store-level sales from the weekend, flag outlets with rising expiry risk, and identify which drug categories are growing fastest. What used to take her analyst 4 hours in Excel on Monday afternoon now takes 15 minutes — and she’s saving roughly ₹18 lakh/year by not subscribing to IQVIA.
Marcus is a financial analyst at a regional hospital system in Ohio. His in-patient pharmacy contributes roughly $12M in annual dispensing revenue. He uses the Performance Review page every month-end to reconcile Total Insurance Amount by Department against the PBM remittance statements, cutting his close cycle from 5 days to 2.
Aisha is a Power BI consultant in London. Her new retail-pharmacy client wanted a working demo in 48 hours. Instead of modeling from scratch, Aisha bought the Pharmacy Dashboard in Power BI for $17.99, reskinned the color palette to match the client’s brand, repointed the data queries at the client’s sample export, and delivered a polished demo the same afternoon — billing 6 saved hours to the client.
Advantages of the Pharmacy Dashboard in Power BI
🎯 Predictable cost. A single $17.99 payment replaces a recurring $4,200–$15,000/year SaaS bill.
⚡ 10-minute setup. Point the data queries at your source and every visual repopulates — no DAX engineering required.
🔓 Fully editable. Unlike locked SaaS tools, every visual, color, measure, and layout can be customized in the standard Power BI Format pane.
📎 Portable. The .pbix file works offline, in Power BI Service, embedded in SharePoint, or exported to PowerPoint.
👨🏫 Learning asset. The data model and DAX measures are open, so analysts can study and extend the logic.
Opportunities for Improvement
Being straight with you: this is a reporting template, not a clinical system. It does not include DUR (Drug Utilization Review), prescription verification, controlled-substance audit trails, or direct integration with e-prescription platforms. Real-time refresh requires a Power BI Pro license ($10/user/month) if you want web dashboards; without Pro, you refresh manually in Desktop. And like all .pbix templates, you’ll need someone on your team comfortable with Power BI Desktop’s Transform Data interface to remap the initial data sources — usually a 30-minute job for anyone with moderate BI experience.
Best Practices
✅ Keep sample data as a reference sheet. Before wiping the sample, duplicate the dataset tab — useful when you want to compare how a visual should behave.
✅ Map column names first, not data. Match your POS column headers to the template’s fact-table column names using Power Query’s Rename Columns step. Every visual will auto-refresh correctly.
✅ Schedule refresh in Power BI Service. Once deployed, set 2 refreshes daily (morning & evening) to keep the store-location metrics current.
✅ Add a company logo. Replace the default header image on Page 1 with your pharmacy logo to make the dashboard feel bespoke in minutes.
✅ Combine with Excel for data entry. Use the companion Pharmacy Dashboard in Excel for small outlets that don’t have SQL or POS exports — then aggregate weekly into Power BI.
Explore Relevant Templates
💎 Save 38% — get the Healthcare & Hospital Management Bundle (8 templates for $79.99)
Also available as: Pharmacy Dashboard in Excel · Pharmacy KPI Dashboard in Google Sheets.
Related blog posts: Pharmacy Dashboard in Excel · Pharmacy Workflow Bottleneck Analysis Dashboard in Power BI · Clinic Dashboard in Power BI · Hospital Operations KPI Scorecard in Excel.
Frequently Asked Questions
What KPIs does the Pharmacy Dashboard in Power BI track?
The Pharmacy Dashboard in Power BI tracks 4 headline financial KPIs — Total Sales, Gross Profit, Total Cost, and Total Insurance Amount — along with 14+ operational visuals covering profit margin, drug category profitability, supplier cost, expiry risk, patient demographics, store-level sales, and insurance coverage ratio across 5 interactive pages.
Do I need a Power BI Pro license to use it?
No. The Pharmacy Dashboard in Power BI opens and fully functions in free Power BI Desktop. You only need a Pro license ($10/user/month) if you want to publish to Power BI Service for web-based team sharing and automated refresh.
How long does setup take?
Under 10 minutes. Open the .pbix file, go to Transform Data, repoint the source queries to your pharmacy data (CSV, Excel, SQL, or API), click Refresh, and all 14+ visuals repopulate automatically. No DAX writing required.
How does this compare to IQVIA or PharmaGuide?
IQVIA and PharmaGuide are enterprise tools costing $15,000–$60,000/year with 4–12 week implementations. The Pharmacy Dashboard in Power BI is a $17.99 one-time purchase that covers the core 90% of financial and operational KPIs — best for independent pharmacies and small-to-mid chains.
Will it work with my POS data?
Yes, if your POS can export to CSV, Excel, SQL, or any of Power BI’s 100+ native data connectors. Map your source columns to the template’s fact-table schema once, and the Pharmacy Dashboard in Power BI handles the rest automatically.
Can I customize the design and colors?
Yes — every visual, color, font, layout element, and DAX measure in the Pharmacy Dashboard in Power BI is fully editable via the standard Power BI Format pane. No content is locked, so you can rebrand the dashboard to match your pharmacy in minutes.
About the Author
Built by PK — Microsoft Certified Professional with 15+ years of Excel, Google Sheets, and Power BI experience. Founder of NextGenTemplates, reaching 300K+ subscribers across YouTube channels. Every template is hand-built and tested before release.
Conclusion
The Pharmacy Dashboard in Power BI is a fast, affordable way to bring enterprise-grade analytics into an independent pharmacy or small chain without a 5-figure annual bill. Four financial KPIs, five interactive pages, 14+ charts, and a fully editable .pbix file — ready to refresh against your data in 10 minutes.
👉 Click here to Purchase the Pharmacy Dashboard in Power BI — now $17.99 (regular $24.99).
✅ Instant download · One-time payment · No subscription · Lifetime access
🎥 Visit YouTube for step-by-step tutorials: Youtube.com/@PK-AnExcelExpert
📅 Last updated: April 2026