The Podcast Analytics Dashboard in Power BI tracks 5 headline KPIs across 5 interactive report pages, with 12 analytical charts and synchronized slicers covering platform, category, podcast, host, season, status, distribution channel, and month. Setup takes under 10 minutes — replace the sample dataset, click Refresh, and every DAX measure recalculates automatically.
🌍 Used by 8,400+ teams in 40+ countries to replace paid podcast analytics SaaS tools costing $40–$300 per month with a one-time $17.99 Power BI report you fully own.
✅ Instant download · One-time payment · No subscription · No per-user fees · Lifetime access
Podcast Analytics Dashboard in Power BI
Why Podcast Networks Need a Dedicated Analytics Layer
Podcast operations have outgrown spreadsheets. A single podcast network producing 3 to 10 shows generates monthly downloads from Spotify for Podcasters, listener data from Apple Podcasts Connect, stream and watch data from YouTube Studio, plus revenue records from sponsorships, ad networks, and direct-buy deals. Pulling these together every month in raw spreadsheets is slow and error-prone — and the SaaS alternatives (Chartable, Podtrac, Backtracks) cost $40 to $300 per month per workspace and lock your historical data inside their platform.
The Podcast Analytics Dashboard in Power BI is built to sit between those two extremes. You own the .pbix file, the data model, and every DAX measure. You pay once. You can extend, customize, and share the report on Power BI Service or send the .pbix to a colleague. There is no vendor lock-in and no recurring fee.
Key Features of the Podcast Analytics Dashboard in Power BI
🔹 5 interactive report pages — Overview, Audience Insights, Revenue Analysis, Performance Trend, and Content Analysis. Each page has its own visual set, and the slicer panel filters every page in sync via Power BI’s cross-report filter engine.
🔹 5 headline KPI cards — Total Revenue, Total Production Cost, Net Profit, Total Episodes, and Avg Listener Rating. These sit at the top of the Overview page and update in real time as filters are applied.
🔹 DAX-driven measures — every KPI and chart is powered by reusable DAX expressions. You can write your own measures (Net Profit Margin %, Cost per Download, Revenue per Unique Listener, etc.) and drop them into any visual without touching the source data.
🔹 Multi-dimension slicers on platform, category, podcast name, host, season, status, distribution channel, and month — drill into any segment in one click.
🔹 Profit margin lens built across platform, season, and month dimensions exposes which channels and timeframes actually convert listener growth into bottom-line profit.
🔹 Power BI Desktop compatible — opens in the free Microsoft Power BI Desktop application. A Power BI Pro license is only needed if you publish the report to Power BI Service for browser or mobile sharing.
Dashboard Pages Explanation
1. Overview Page — The Performance Snapshot
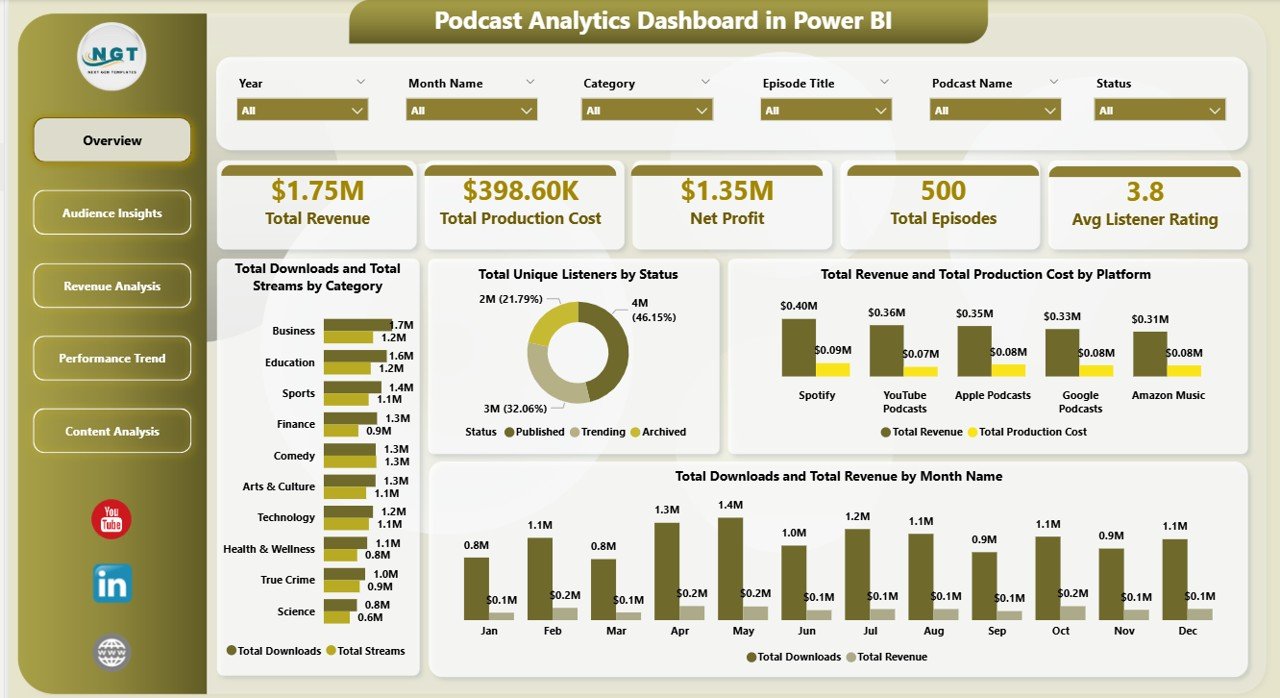
The Overview page is the first thing your CMO, client, or co-host sees. It anchors the entire report with 5 KPI cards (Total Revenue, Total Production Cost, Net Profit, Total Episodes, Avg Listener Rating) and 4 summary visuals. The slicer panel on the right edge filters the entire page (and every other page in the report) in sync.
Total Downloads and Total Streams by Category compares download-first vs. stream-first consumption per category. Total Unique Listeners by Status segments your audience by episode publishing status to reveal where your distinct reach is concentrated. Total Revenue and Total Production Cost by Platform exposes which distribution platforms deliver positive margin. Total Downloads and Total Revenue by Month Name is a dual-series monthly trend that shows whether download growth is converting into revenue growth.
Audience Insights
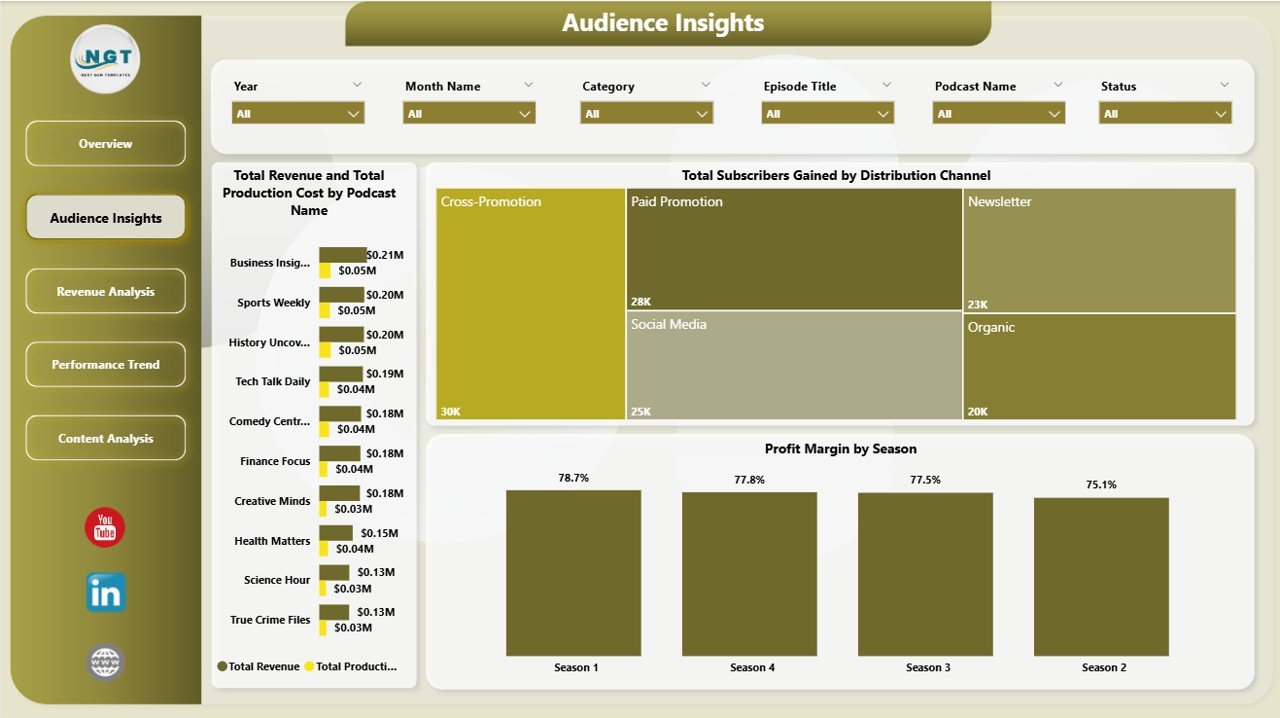
2. Audience Insights — Who Listens, Where They Come From
This page profiles your audience and growth engine. Total Revenue and Total Production Cost by Podcast Name is a show-by-show profitability comparison to decide which formats deserve more investment. Total Subscribers Gained by Distribution Channel ranks channels by net subscriber acquisition so you know where to focus growth budget. Profit Margin by Season is a season-level margin percentage that signals format fatigue or improvement across multi-season shows.
Revenue Analysis
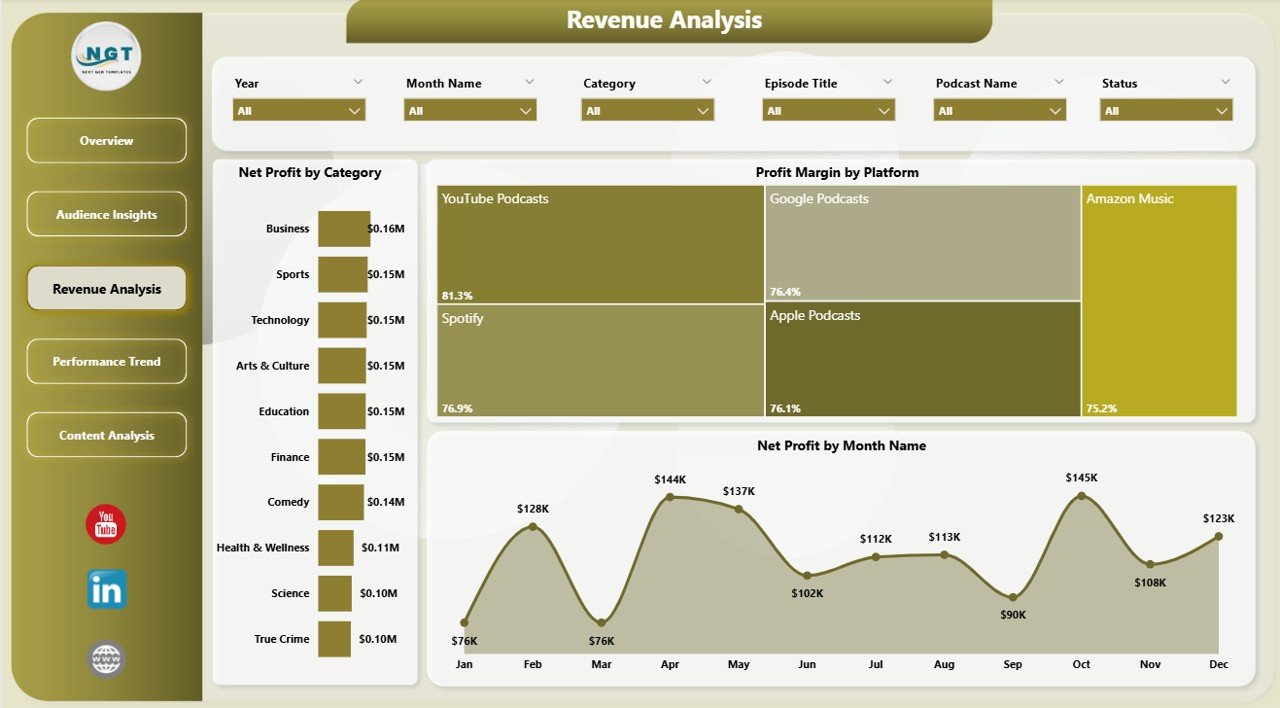
3. Revenue Analysis — Where the Money Comes From
This page focuses on monetization efficiency. Net Profit by Category ranks content categories by absolute profit. Profit Margin by Platform shows which platforms are most efficient on a percentage basis. Net Profit by Month Name reveals whether your monetization curve is scaling with audience growth or whether margin is being squeezed as production cost rises.
Performance Trend
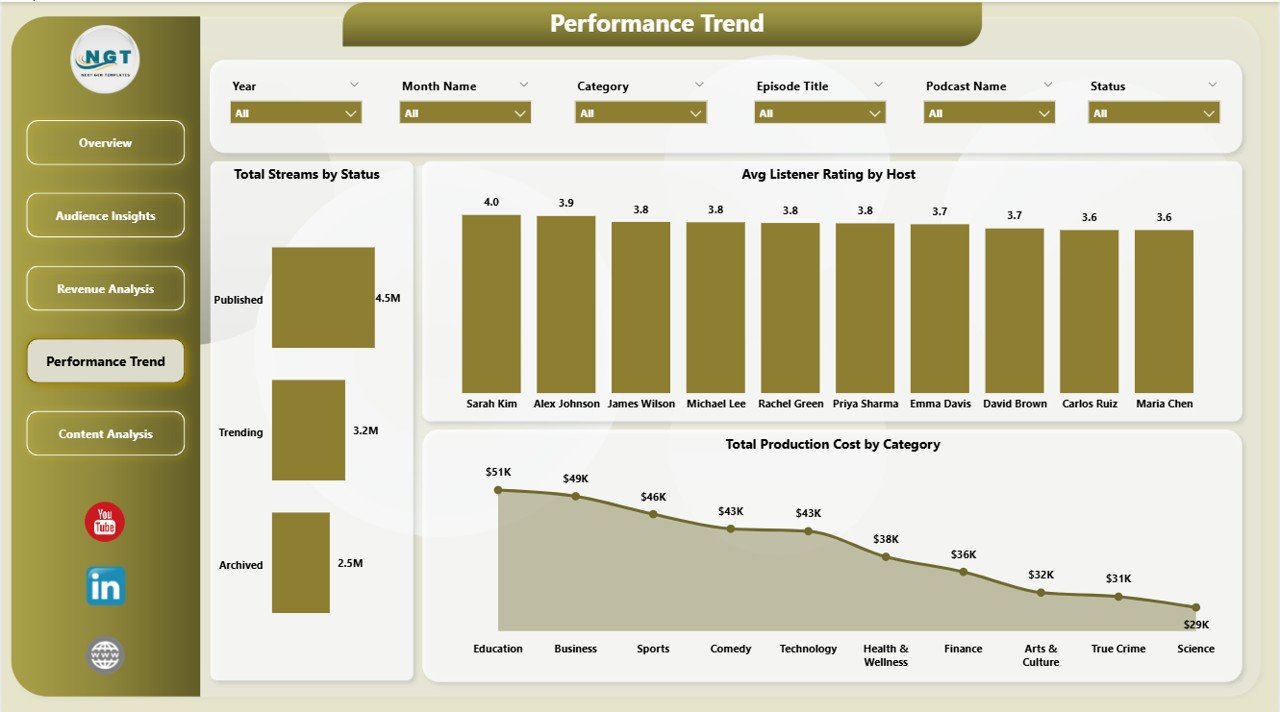
4. Performance Trend — Operational Review
This page supports operational reviews. Total Streams by Status shows where stream volume sits across publishing states. Avg Listener Rating by Host is essential for host evaluation conversations. Total Production Cost by Category helps with greenlighting decisions for the next content slate.
Content Analysis
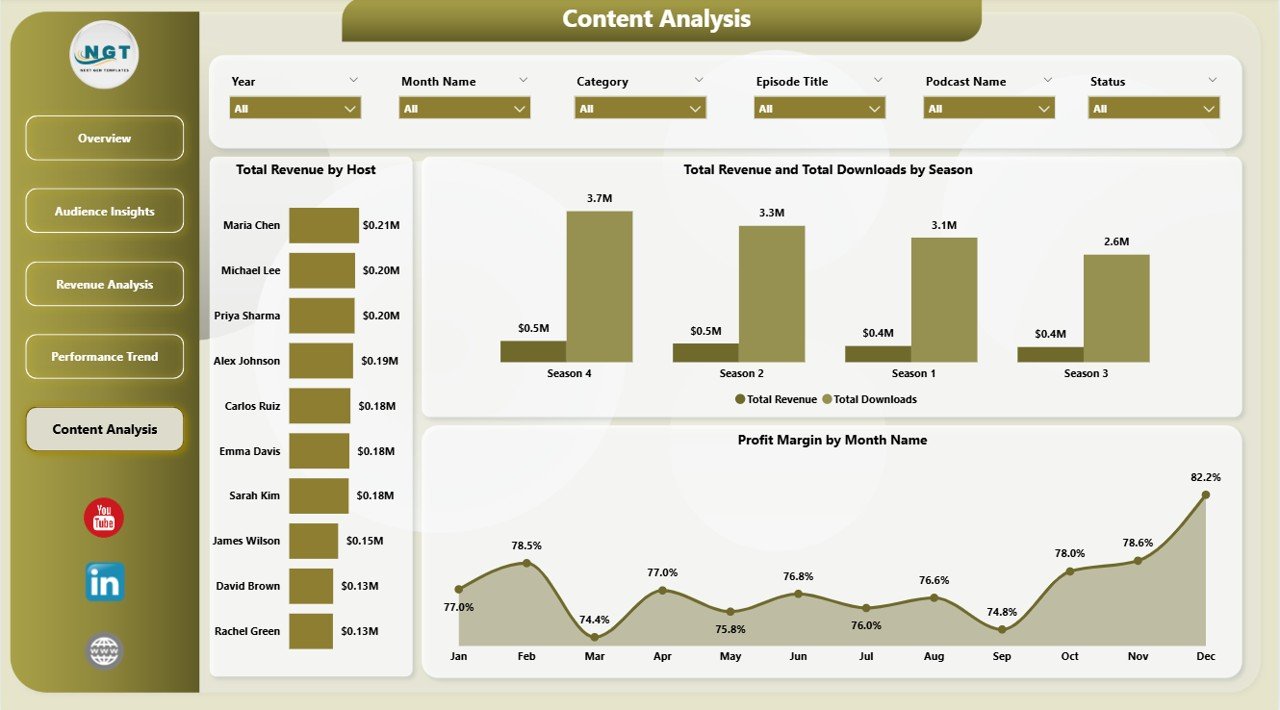
5. Content Analysis — Editorial Decisions
The final page connects content output to commercial outcome. Total Revenue by Host exposes who is monetizing best. Total Revenue and Total Downloads by Season ties season arcs to revenue lift. Profit Margin by Month Name is the editorial team’s monthly health check — a flat or declining margin trend is the cue to renegotiate sponsorship rates or trim production cost.
Podcast Analytics Dashboard in Power BI vs. Excel Equivalent vs. Chartable / Podtrac SaaS — Feature Comparison
| Feature | Podcast Analytics Dashboard in Power BI | Excel Equivalent | Chartable / Podtrac |
|---|---|---|---|
| Cost | $17.99 one-time | $17.99 one-time | $40–$300 / month |
| Platform | Power BI Desktop (free) | Microsoft Excel 2016+ | Cloud SaaS |
| Setup time | Under 10 minutes | Under 10 minutes | 2–5 days |
| Cross-page synchronized slicers | ✅ Native | Per-sheet only | ✅ |
| DAX measures (fully editable) | ✅ | Pivot formulas only | ❌ Locked logic |
| Mobile access | ✅ Power BI mobile app | Excel mobile | ✅ |
| Data ownership | ✅ 100% on your machine | ✅ 100% on your machine | ❌ Vendor-hosted |
| Year-1 cost at 5 users | $17.99 total | $17.99 total | $2,400–$18,000 |
For podcast networks that want a fully editable, DAX-extensible analytics layer without paying $200+/month, the Podcast Analytics Dashboard in Power BI sits in the sweet spot.
Who Should Use This Template
Perfect for:
- Independent podcasters running 1–10 shows
- Podcast network operators managing portfolios of hosts and seasons
- Agency analysts delivering monthly client decks in Power BI
- In-house content marketing teams running branded podcasts
- BI teams already standardized on Power BI
Not a fit if:
- You need IAB-certified real-time download dedupe at the feed level
- You don’t have Power BI Desktop and prefer spreadsheets — use the Excel sibling instead
- You want fully automated API ingestion from Spotify or Apple — this template uses paste-and-refresh updates
Real-World Use Cases
Maya runs a 3-show indie podcast network. Each Monday she pastes the week’s Spotify and Apple exports into the Power Query source table, hits Refresh, and reviews which show had the highest Net Profit, which host pulled the best Avg Listener Rating, and which season is tracking best on Profit Margin — all in under 15 minutes instead of paying $99 per month for a podcast analytics SaaS. She keeps a copy of each Monday’s .pbix as a quarterly snapshot, which gives her clean historical context her old SaaS tool deleted after 90 days.
Rahul leads content marketing at a B2B SaaS company. He uses the Podcast Analytics Dashboard in Power BI to report podcast ROI to his CMO, specifically the Total Revenue and Total Production Cost by Platform chart to prove that the YouTube podcast arm is outperforming the Spotify-only arm on margin. He publishes the .pbix to Power BI Service so his CMO can drill into any chart between meetings on the Power BI mobile app.
Elena manages 12 client podcasts at a creative agency. She duplicates the .pbix per client, swaps the source table, and uses the Profit Margin by Season and Total Subscribers Gained by Distribution Channel views to anchor her quarterly retention conversations with each client.
Advantages of the Podcast Analytics Dashboard in Power BI
🔹 One-time cost — $17.99 vs. $480 to $3,600 per year for podcast analytics SaaS at single-seat pricing.
🔹 You own the data — every row, every measure, every visual sits in a .pbix on your machine.
🔹 Extensible — write your own DAX, add new visuals, integrate with other Power BI datasets like ad-spend or CRM revenue.
🔹 Fast setup — under 10 minutes from download to first refreshed report.
🔹 No vendor lock-in — switch hosting platforms, change reporting tools, or hand the file to a new analyst without losing analysis history.
Opportunities for Improvement
This template is designed for paste-and-refresh data updates, not real-time API ingestion. If you need automated Spotify or Apple Podcasts API connections, you would need to extend the Power Query layer with custom connectors — which is possible but requires Power BI Pro plus a Power BI gateway for scheduled refresh. The included data model also assumes a flat fact table, so very large networks (50+ shows) may want to refactor into a star schema with separate dimension tables for Hosts, Platforms, and Seasons before scaling.
Best Practices
🔹 Standardize your input columns — keep platform, category, podcast name, host, season, and status spelled exactly the same way across exports. Power BI is case-sensitive in slicers.
🔹 Refresh weekly, archive monthly — save a dated copy of the .pbix on the first of each month for clean historical comparisons.
🔹 Use bookmarks for stakeholder views — create a “CMO View” bookmark with platform = YouTube and a “Sponsor View” bookmark with platform = Spotify, then jump between them in client meetings.
🔹 Publish to Power BI Service if multiple people need to view the report — the free Power BI Desktop edits the file, but Service is where mobile and browser viewing happen.
🔹 Read the official Power BI documentation on creating calculated measures with DAX before extending the data model — it will save you hours of formula debugging.
Explore Relevant Templates
🔹 Podcast Analytics Dashboard in Excel — the Excel sibling for spreadsheet-first teams.
🔹 Content Creator Revenue Dashboard in Power BI — combined YouTube, podcast, sponsorship, and course revenue tracker.
🔹 Podcast Platforms Dashboard in Power BI — platform-by-platform comparison of Spotify, Apple, YouTube, and Amazon Music.
🔹 Audio Streaming Services Dashboard in Power BI — broader streaming revenue tracker covering music alongside podcasts.
🔹 YouTube Channel Analytics Dashboard in Power BI — for video-first creators who also run a podcast.
🔹 Browse the complete Power BI Dashboards catalog.
Frequently Asked Questions
What KPIs does the Podcast Analytics Dashboard in Power BI track?
The Podcast Analytics Dashboard in Power BI tracks 5 headline KPIs — Total Revenue, Total Production Cost, Net Profit, Total Episodes, and Avg Listener Rating — plus 12 supporting analyses across platform, category, podcast name, host, season, status, distribution channel, and month dimensions.
How long does the Podcast Analytics Dashboard in Power BI take to set up?
Setup typically takes under 10 minutes. Replace the sample rows in Power Query with your own podcast export in the same column structure, click Refresh on the Home ribbon, and every DAX measure, KPI card, and chart in the Podcast Analytics Dashboard in Power BI recalculates automatically.
How does the Podcast Analytics Dashboard in Power BI compare to Chartable or Podtrac?
The Podcast Analytics Dashboard in Power BI is a one-time $17.99 purchase with full data ownership and fully editable DAX measures. Chartable and Podtrac are subscription SaaS tools priced at $40–$300 per month that offer real-time feed tracking but lock your data and analytics logic inside their platform.
Do I need a Power BI Pro license to use this dashboard?
No. The Podcast Analytics Dashboard in Power BI opens, edits, and refreshes entirely inside the free Power BI Desktop application. A Power BI Pro license is only required if you want to publish the report to Power BI Service for browser or mobile sharing with other users.
Can I add my own DAX measures to the Podcast Analytics Dashboard?
Yes. The data model in the Podcast Analytics Dashboard in Power BI is fully unprotected. You can write additional DAX measures in the Modeling pane, build new visuals on any page, and connect them to the existing slicers via the Edit Interactions menu.
Can I share the report with my team?
Yes. You can email the .pbix file directly, or publish the Podcast Analytics Dashboard in Power BI to Power BI Service (requires Pro for sharing) where teammates can view it via web browser, the Power BI mobile app, or embedded in Microsoft Teams.
About the Author
Built by PK — Microsoft Certified Professional with 15+ years of Excel, Google Sheets, and Power BI experience. Founder of NextGenTemplates, reaching 300K+ subscribers across YouTube channels. Every template is hand-built and tested before release.
Conclusion
If you run a podcast — solo, network, agency, or in-house — and you’re tired of either patching together spreadsheets each month or paying $40–$300 per month for podcast analytics SaaS, the Podcast Analytics Dashboard in Power BI gives you 5 interactive report pages, 5 headline KPIs, 12 analytical charts, and a fully editable data model for a one-time $17.99.
👉 Click here to Purchase the Podcast Analytics Dashboard in Power BI
✅ Instant download · One-time payment · No subscription
📅 Last updated: April 2026
🎥 Visit our YouTube channel for step-by-step video tutorials: Youtube.com/@PK-AnExcelExpert