If you run a coaching practice — whether you’re a life coach, business coach, executive coach or fitness coach — you already know how quickly the numbers pile up. Sessions, packages, coach schedules, client satisfaction, goal progress, referral sources, cancellations… tracking all of it in spreadsheets is exhausting and error-prone. The Coaching Business Dashboard in Power BI solves that by giving you a single, beautifully visual report that answers every business question in seconds. In this post we’ll walk through every page of the dashboard, explain the KPIs it tracks, and show you exactly how to plug it into your own coaching data.
This dashboard is the Power BI companion to our popular Coaching Business Dashboard in Excel — same insights, but with the speed, interactivity and model-level calculations that only Power BI Desktop can deliver.
Key Features of the Coaching Business Dashboard in Power BI
The Coaching Business Dashboard in Power BI is built as a complete, ready-to-use .pbix file with five fully interactive pages, five high-level KPI cards and fourteen-plus charts. Here’s what makes it stand out:
- 5 Interactive Report Pages — Overview, Coach Performance, Client Analysis, Program Insights and Revenue Trends — each built to answer a specific business question.
- 5 Headline KPIs — Total Session Revenue, Total Package Revenue, Total Session Hours, Avg Session Fee and Avg Goal Progress displayed as card visuals.
- Cross-Page Slicers — filter by coach, coaching type, program, session format, referral source and date in one click.
- Editable .pbix Source File — fully open data model, measures and visuals.
- Modern, Minimal Design — clean typography, consistent color palette and export-ready for client reports.
- Works with Any Data Source — Excel, CSV, Google Sheets, SQL Server — just point and refresh.
- Publish-Ready — upload to Power BI Service and share live dashboards with your team or clients.
Dashboard Pages Explained
Let’s walk through each page of the Coaching Business Dashboard in Power BI and see exactly what it tracks.
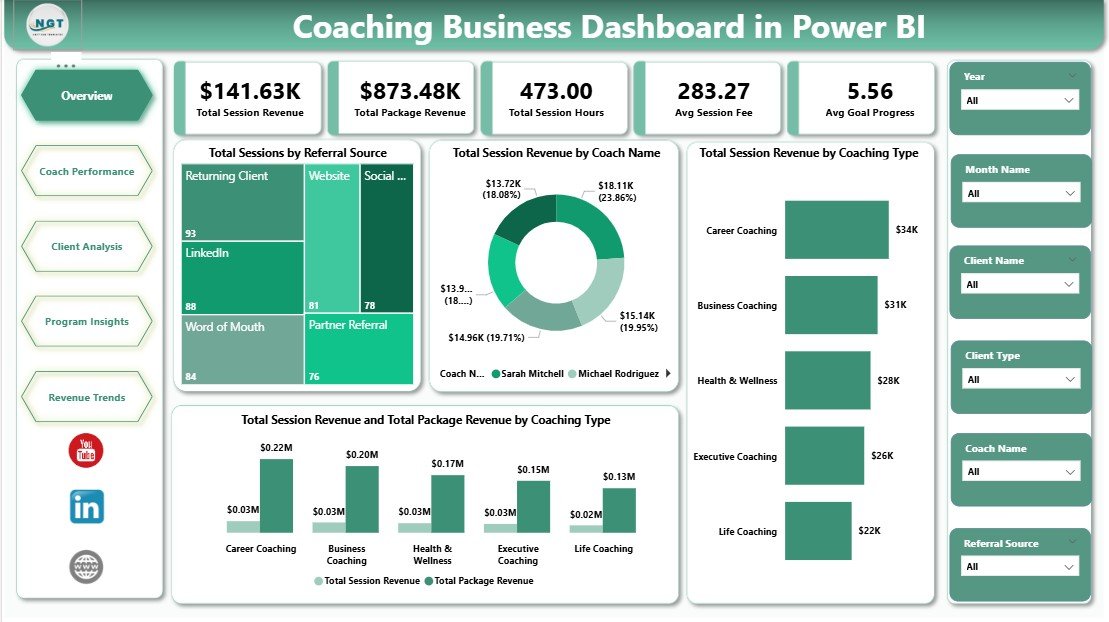
1. Overview Page
The overview page is your daily-glance view. Across the top you’ll see five KPI cards showing the headline numbers of your coaching business:
- Total Session Revenue — cumulative income earned from individual coaching sessions.
- Total Package Revenue — income from multi-session coaching packages and programs.
- Total Session Hours — total hours coached across the practice.
- Avg Session Fee — the average price clients pay per session.
- Avg Goal Progress — the average client progress towards their stated coaching goals.
Below the cards are four analytical charts. Total Sessions by Referral Source shows which marketing channels (LinkedIn, referrals, website, podcast, etc.) actually book paying clients. Total Session Revenue by Coach Name ranks your coaches by revenue contribution, making it easy to identify top performers. Total Session Revenue by Coaching Type breaks earnings out by niche — life, executive, business, career, fitness — so you know where your money really comes from. Finally, Total Session Revenue and Total Package Revenue by Coaching Type compares one-off session income against recurring package revenue per niche, helping you double down on the most profitable mix. Slicers on the page let you filter every visual instantly.
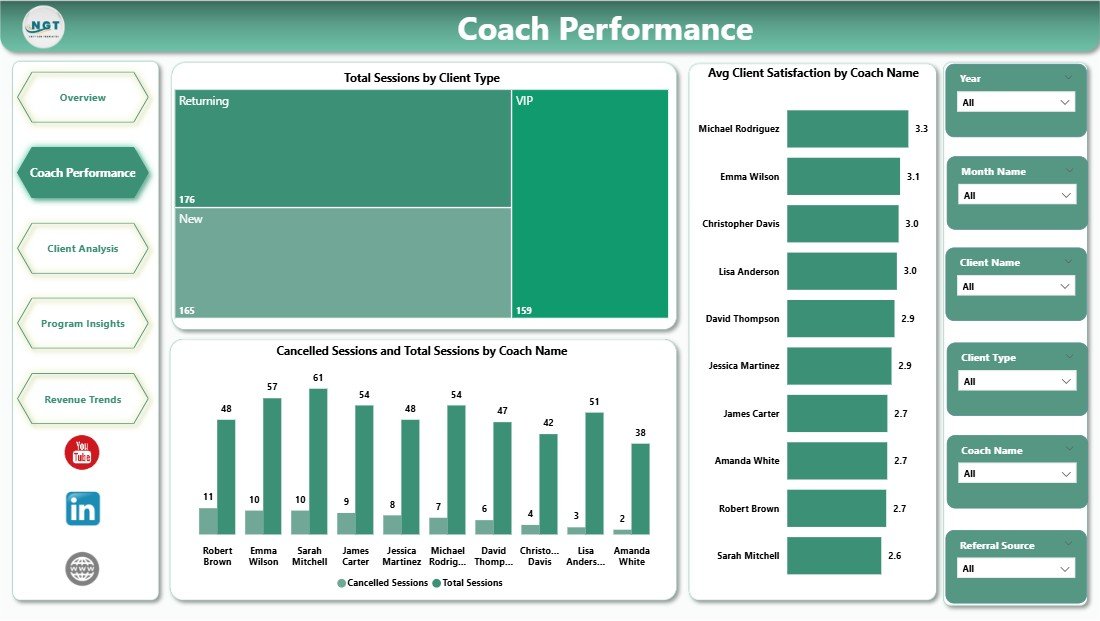
2. Coach Performance Page
This page is a full scorecard of every coach on your roster. Total Sessions by Client Type reveals whether each coach is working with the right target clients (individual, corporate, team, group). Avg Client Satisfaction by Coach Name is a pure quality metric — the higher the score, the happier the clients. Cancelled Sessions and Total Sessions by Coach Name compares total bookings against cancellations, surfacing any coach with reliability or retention problems. Agency owners and head coaches will love this page for monthly coach reviews.
3. Client Analysis Page
Understand exactly who your clients are, how they want to meet, and how they found you. Total Sessions by Session Format splits bookings across in-person, virtual and group formats — invaluable for pricing and capacity planning. Total Session Revenue by Referral Source shows which acquisition channels drive the most revenue (not just the most leads). Total Session Revenue by Program reveals which coaching programs and packages clients actually buy, helping you refine your offer suite.

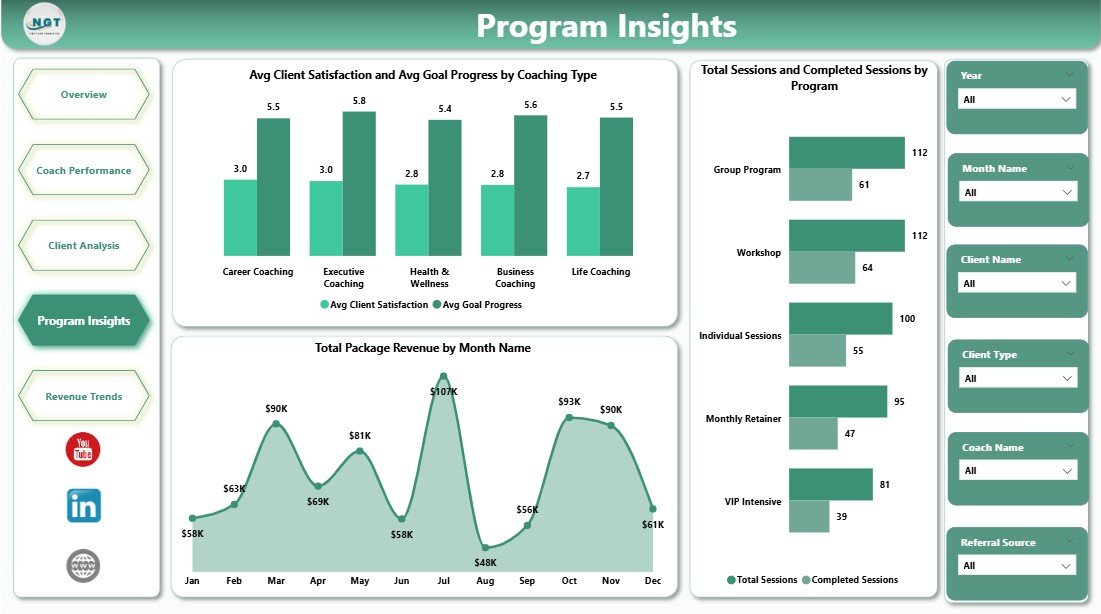
4. Program Insights Page
This page goes deep into program-level ROI. Avg Client Satisfaction and Avg Goal Progress by Coaching Type answers the most important business question in coaching: which type of coaching actually gets clients results? Total Package Revenue by Month Name surfaces seasonality — when do clients buy packages and when do sales dip? Total Sessions and Completed Sessions by Program shows completion rates — a critical quality metric, because coaching contracts that don’t complete hurt referrals and testimonials.
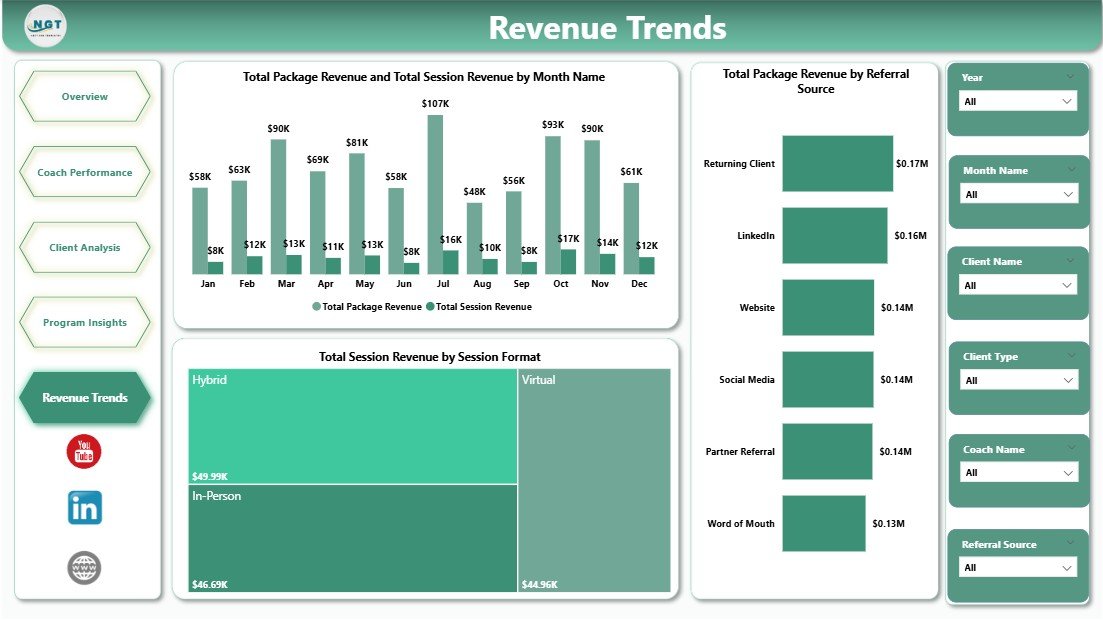
5. Revenue Trends Page
The final page is dedicated to time-based trends and monthly reviews. Total Package Revenue and Total Session Revenue by Month Name is a month-over-month line view of your two income streams — perfect for spotting growth patterns and forecasting next quarter. Total Package Revenue by Referral Source highlights which channels bring in long-term package buyers (your highest-value clients). Total Session Revenue by Session Format shows which delivery mode is trending up — a useful leading indicator for your 2026 capacity planning.
Advantages of the Coaching Business Dashboard in Power BI
- Decision-ready insights: every KPI and chart is designed to answer a real business question — not just look pretty.
- Real-time refresh: connect Power BI to your live data source and the entire dashboard updates on refresh.
- Scales with your practice: whether you’re a solo coach or run an agency with 20 coaches, the same .pbix file works.
- Shareable: publish to Power BI Service and send stakeholders a secure, live link — no more emailing PDFs.
- 100% customisable: re-theme, add new measures or remove visuals — the file is completely open.
- Cross-platform friendly: Power BI Desktop is free, and Power BI mobile apps let you check KPIs on your phone.
Opportunities for Improvement
No template is perfect, and a good business review acknowledges that. Here are a few honest opportunities for improvement with the Coaching Business Dashboard in Power BI:
- Forecasting: the current build reports historical and current data. Adding a simple Power BI forecast visual or what-if parameter for session volume would strengthen planning.
- Client retention cohorts: coaching is a retention business. A cohort-style retention matrix by month of first session would add strategic depth.
- Profitability: the dashboard tracks revenue, not margin. If you pay coaches a cut, layering in a cost-per-session field would unlock true profit analysis.
- Lead-to-client funnel: currently it reports on sessions that have happened. A top-of-funnel page showing leads, discovery calls and conversion rates would complete the picture.
All four are straightforward enhancements once the base template is in place.
Best Practices for Using the Dashboard
- Standardise your data entry. Use consistent values for coaching type, program name and referral source — Power BI groups data by exact string match.
- Refresh weekly. A weekly refresh cadence gives you timely numbers without becoming a daily time-sink.
- Review with your coaches. Use the Coach Performance page as the anchor of monthly 1:1 reviews with your team.
- Export visuals for client reports. Power BI lets you export any chart as an image — great for embedding in monthly client progress reports.
- Use bookmarks. Save filtered views (e.g. “Executive Coaching — Q1”) as Power BI bookmarks for instant one-click reports.
- Track goal progress honestly. Avg Goal Progress is the most important KPI on the dashboard for long-term business health — don’t inflate it.
Explore Relevant Templates
If you found this dashboard useful, you might also like these closely related templates on NextGenTemplates:
- Coaching Business Dashboard in Excel — the Excel version of this Power BI dashboard, ideal if your team isn’t on Power BI yet.
- Real Estate Agent Dashboard in Power BI — a similar service-business structure for realtors.
- Medical Practice Dashboard in Power BI — appointment and revenue analytics for clinics.
- Wedding Budget Dashboard in Power BI — another service-based Power BI dashboard with excellent visual design patterns.
- Browse all Power BI Dashboard Templates
You can also check related blog tutorials: Medical Practice Dashboard in Power BI, Energy Consumption Analysis Dashboard in Power BI and Wedding Budget Dashboard in Power BI for more Power BI inspiration.
For official Power BI reference, see Microsoft Power BI Documentation.
Frequently Asked Questions
What is the best Power BI dashboard template for a coaching business?
The Coaching Business Dashboard in Power BI is purpose-built for coaching practices. It tracks 5 headline KPIs across 5 interactive pages — covering revenue, coach performance, client analysis, program insights and monthly trends — making it one of the most complete Power BI templates available for life coaches, executive coaches and coaching agencies.
Do I need Power BI Pro to use the Coaching Business Dashboard?
No. The dashboard works fully in the free Power BI Desktop application. You only need Power BI Pro if you want to publish the report to the Power BI Service cloud and share live reports with your team or clients.
How do I connect my own coaching data to this Power BI dashboard?
Open the .pbix file in Power BI Desktop, go to Transform Data > Data source settings, and point the query to your own Excel, CSV, Google Sheet or SQL Server. Make sure your column headers match the template structure, then click Refresh — every KPI card, chart and slicer will update automatically.
Which KPIs does this coaching dashboard track?
The Coaching Business Dashboard in Power BI tracks Total Session Revenue, Total Package Revenue, Total Session Hours, Average Session Fee and Average Goal Progress as headline KPIs. It also analyses sessions, revenue, client satisfaction and cancellations by coach name, coaching type, program, session format and referral source.
Is this dashboard suitable for a coaching agency with multiple coaches?
Yes. The Coach Performance page is designed specifically for multi-coach operations. It compares revenue, client satisfaction and cancelled sessions across every coach on the roster — perfect for monthly team reviews, performance payouts and identifying where coaching quality needs support.
Can I customise the dashboard with my own branding?
Yes. Because it ships as a native .pbix file, you can fully re-theme the Coaching Business Dashboard in Power BI — apply your brand colors, logos, fonts and report-level theme JSON — using Power BI Desktop’s standard theming options.
Conclusion
The Coaching Business Dashboard in Power BI turns what used to be a tangle of spreadsheets into a single, beautiful, decision-ready report. Whether you’re running solo or leading a team of coaches, this dashboard gives you revenue clarity, coach accountability, client insight and program ROI — all refreshed at the click of a button. Plug in your own data, customise the theme, publish it to Power BI Service, and use it as the backbone of your monthly business review.
👉 Click here to Purchase the Coaching Business Dashboard in Power BI
🎥 For step-by-step Power BI tutorials, visit Youtube.com/@PK-AnExcelExpert.