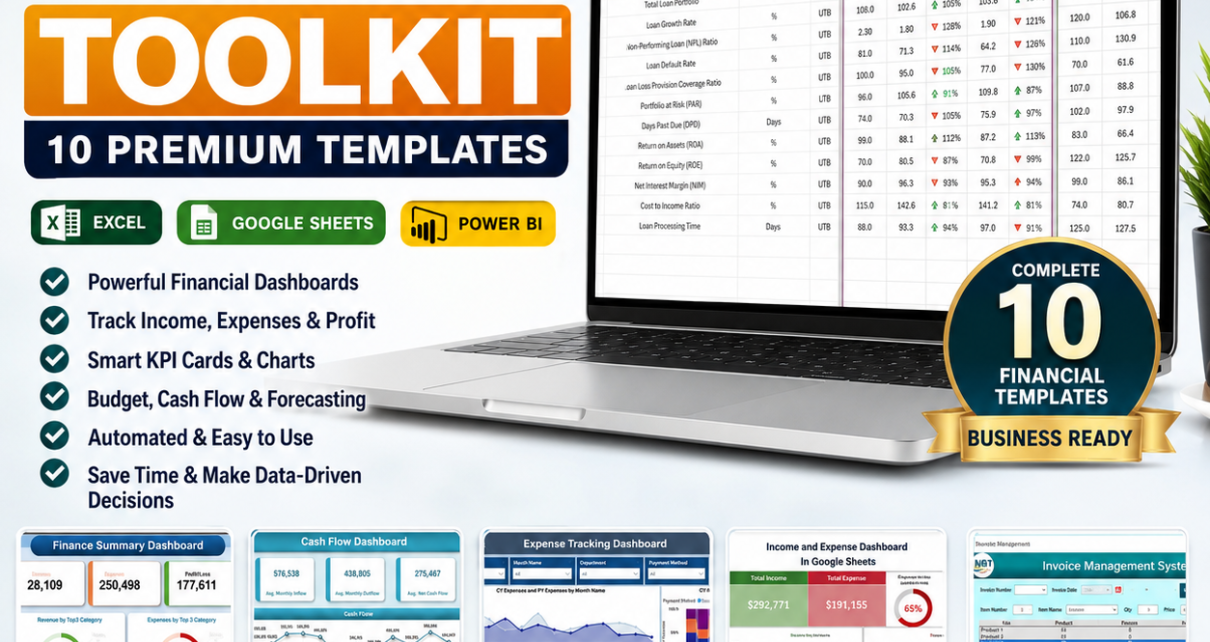
Every CFO knows the feeling: it’s the night before the board meeting and you’re still copy-pasting numbers between six different spreadsheets, each built by a different person, none of them talking to each other. The CFO’s Financial Command Toolkit exists to end that. It is a curated bundle of 10 premium finance templates covering the entire CFO remit — liquidity, budget control, expense analytics, receivables, debt exposure and profitability — delivered across Microsoft Excel, Google Sheets and Power BI.
Bought separately, these ten templates cost $111.90. As a bundle, the price is $62.99 — a saving of $48.91, or 44% off. Browse the full range in our Financial Tools collection and Excel Dashboards.
🏦 CFO’s Financial Command Toolkit
10 Premium Templates • Excel + Google Sheets + Power BI
$111.90 $62.99
Save $48.91 — 44% Off
Key Features of the CFO’s Financial Command Toolkit
Full-spectrum financial coverage. Most template purchases solve one problem. This bundle solves the whole job. Cash position, budget variance, spend control, invoicing, reimbursements, loan exposure and margin analysis are all covered — which means you stop hunting for the next template every time a new reporting requirement lands on your desk.
Three platforms, one purchase. Finance teams rarely live in a single tool. Your analysts want Excel for modelling. Your operational staff want Google Sheets so five people can enter expenses at once. Your board wants Power BI because they want to click on a bar and see what’s underneath it. This bundle covers all three, so nobody is forced into a tool they don’t want to use.
Automated cash flow with a waterfall chart. The Cash Flow Template tracks monthly inflows and outflows, calculates net cash and closing balance automatically, and renders a waterfall chart that shows precisely how you moved from opening to closing position. It is the single clearest way to explain a cash movement to a non-financial board member.
Budget vs actual variance control. The Monthly Budget Tracker uses pivot-driven calculations and interactive slicers so overspend surfaces in-month rather than at year-end. Categories are fully customisable to your chart of accounts.
Enterprise-grade expense analytics. The Power BI Expense Tracking Dashboard delivers current-year vs prior-year variance, department and project breakdowns, employee-level spend, top-vendor analysis and payment method distribution — the kind of visibility that normally requires a BI implementation project.
Zero setup time. Every formula, pivot, chart and conditional format is pre-built and tested. You replace the sample data with your own and everything recalculates.
What’s Included in the Bundle
1. Finance Summary Dashboard in Excel — $17.99
Your single-pane overview of the entire business. Tracks income, expenses, profit margins, cash flow and net income with interactive charts and real-time reporting. This is the template most CFOs open first every morning — it answers “how are we doing?” in one screen.
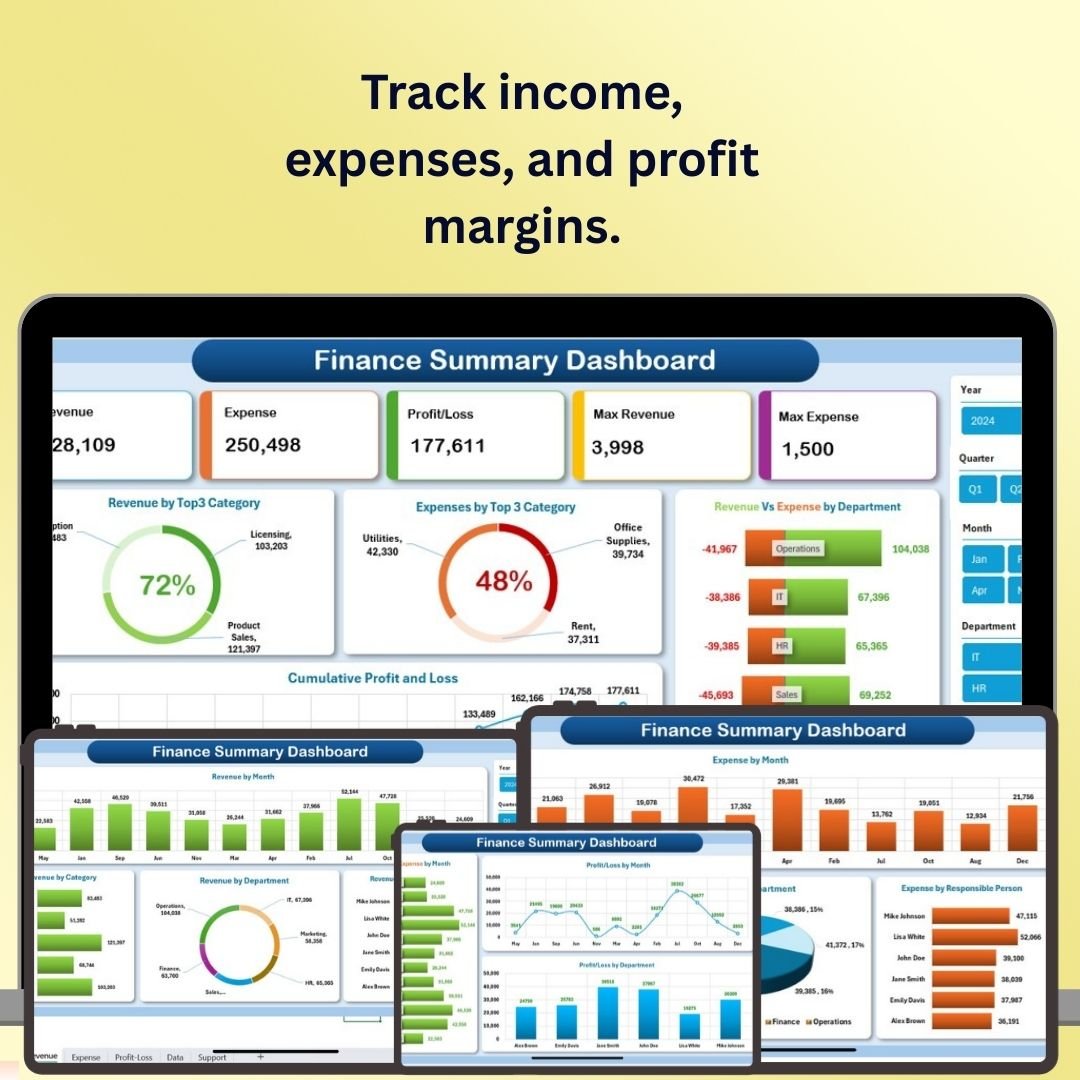
Finance Summary Dashboard in Excel
View the Finance Summary Dashboard →
2. Cash Flow Template in Excel — $6.99
Monthly cash inflows and outflows with automated net cash and closing balance calculations. The built-in waterfall chart makes liquidity movements immediately legible, and the dashboard highlights low-liquidity months before they become a problem.
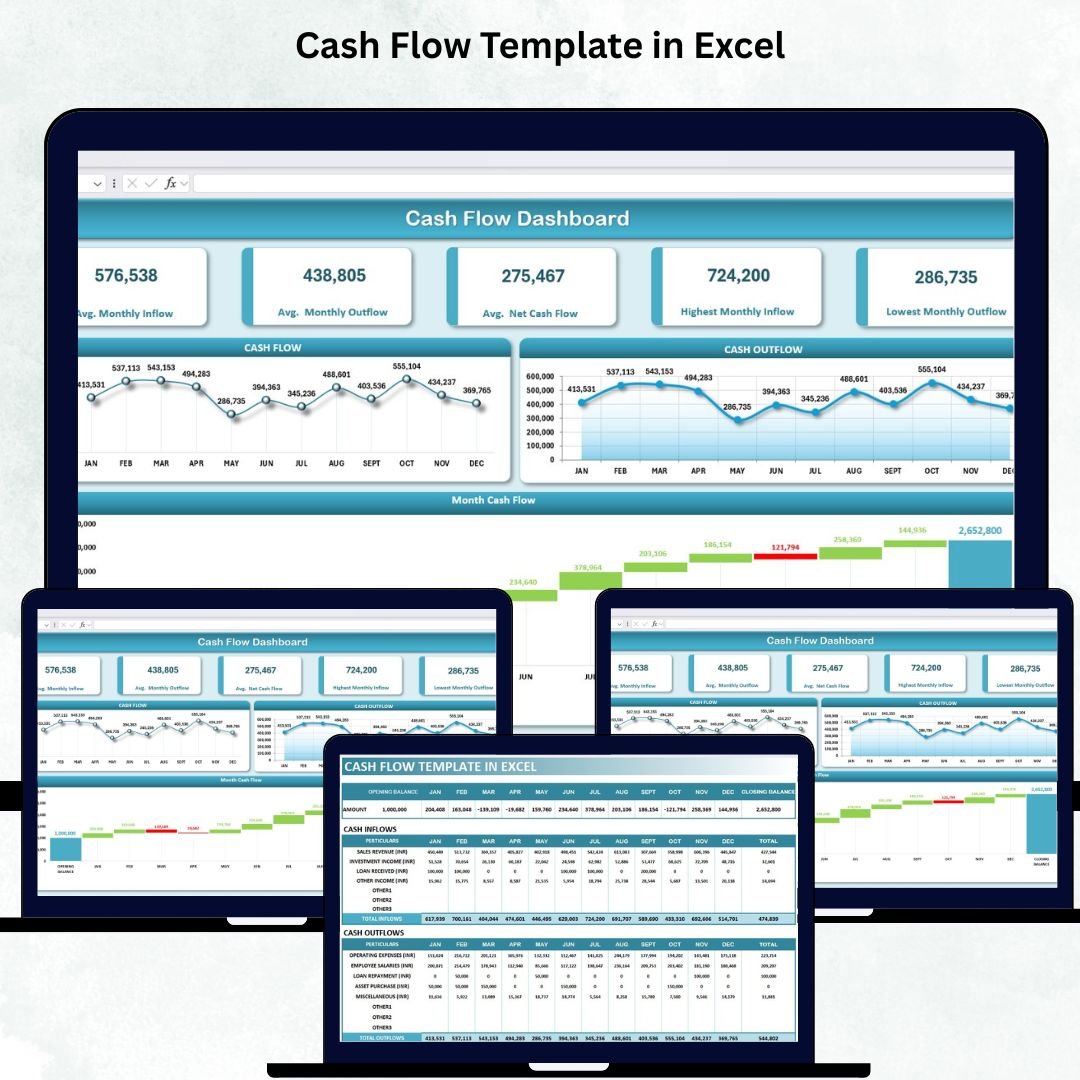 Cash Flow Template in Excel
3. Expense Tracking Dashboard in Power BI — $17.99
The analytical heavyweight of the bundle. Four dedicated pages covering overview, expense trends, department and employee analysis, and category and vendor analysis — all with dynamic slicers, drill-through and CY vs PY variance tracking.
 Expense Tracking Dashboard in Power BI
View the Power BI Expense Dashboard →
4. Monthly Budget Tracker in Microsoft Excel — $6.99
Automated budget control with dynamic slicers, customisable categories and a clean visual dashboard. Track income, expenses and savings against plan, and see exactly where the variance is coming from.
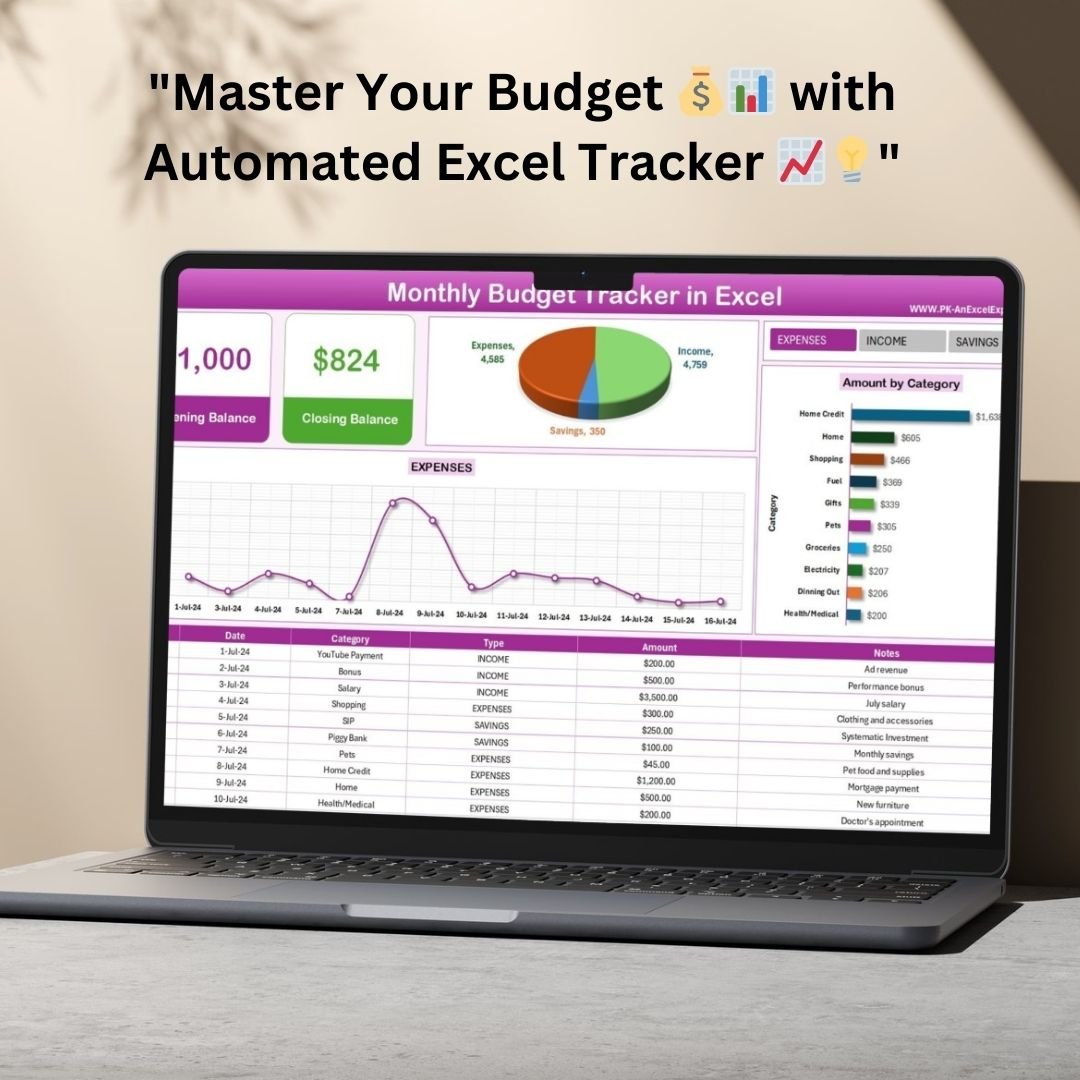 Monthly Budget Tracker in Microsoft Excel
View the Monthly Budget Tracker →
5. Income and Expense Dashboard in Google Sheets — $9.99
Cloud-native tracking with automatic categorisation and live-updating charts. The right choice when several people need to enter data at once and you want the dashboard to reflect it instantly.
 Income and Expense Dashboard in Google Sheets
View the Income and Expense Dashboard →
6. Loan Portfolio KPI Dashboard in Excel — $12.99
Monitor debt exposure, loan performance KPIs and repayment health across the portfolio. If you have covenants to comply with or lenders to report to, this template does the heavy lifting.
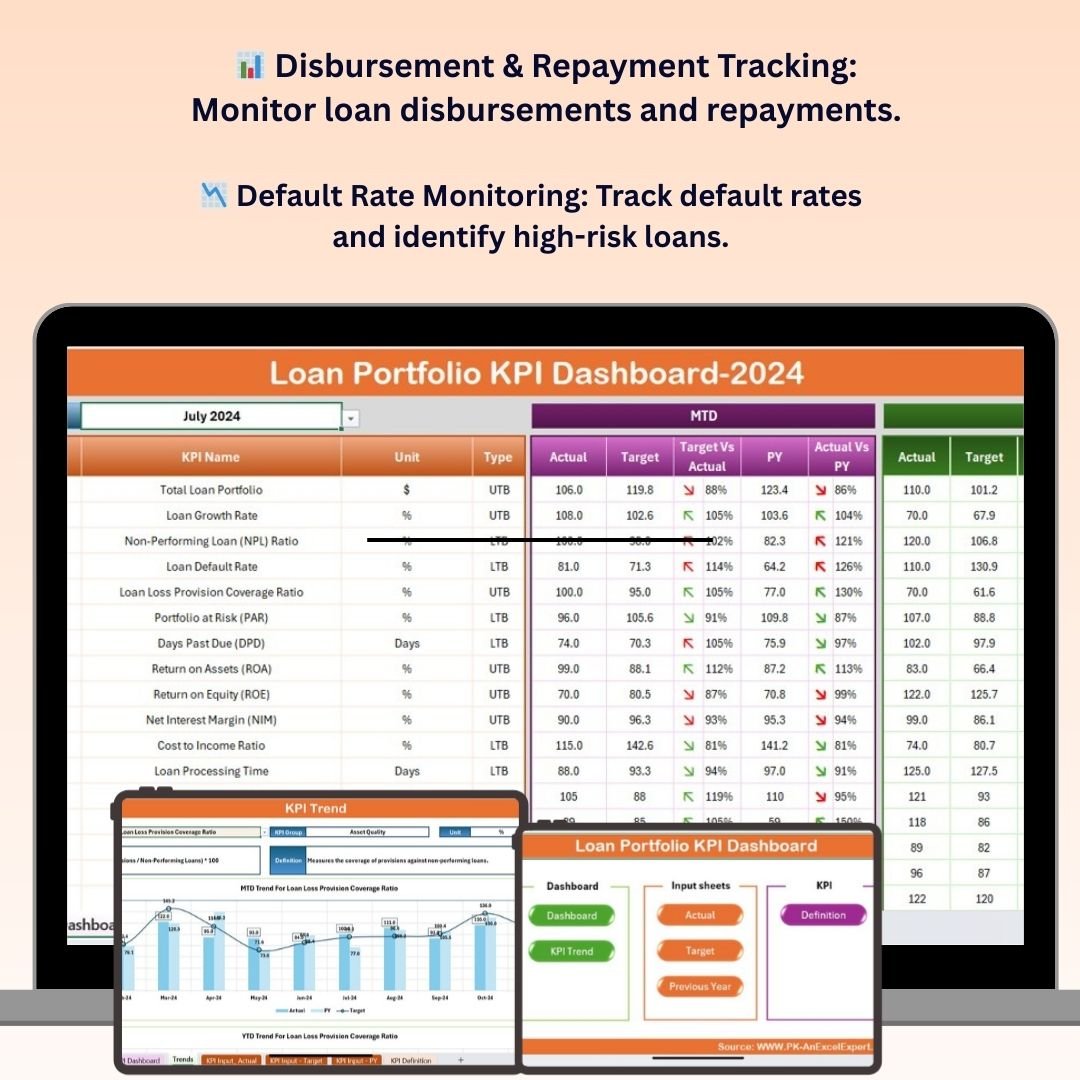 Loan Portfolio KPI Dashboard in Excel
View the Loan Portfolio KPI Dashboard →
7. Invoice Management System V1.0 — $6.99
A working VBA-powered invoice system. Create, store, search and print invoices, and keep receivables visible on a dashboard instead of buried in an email thread.
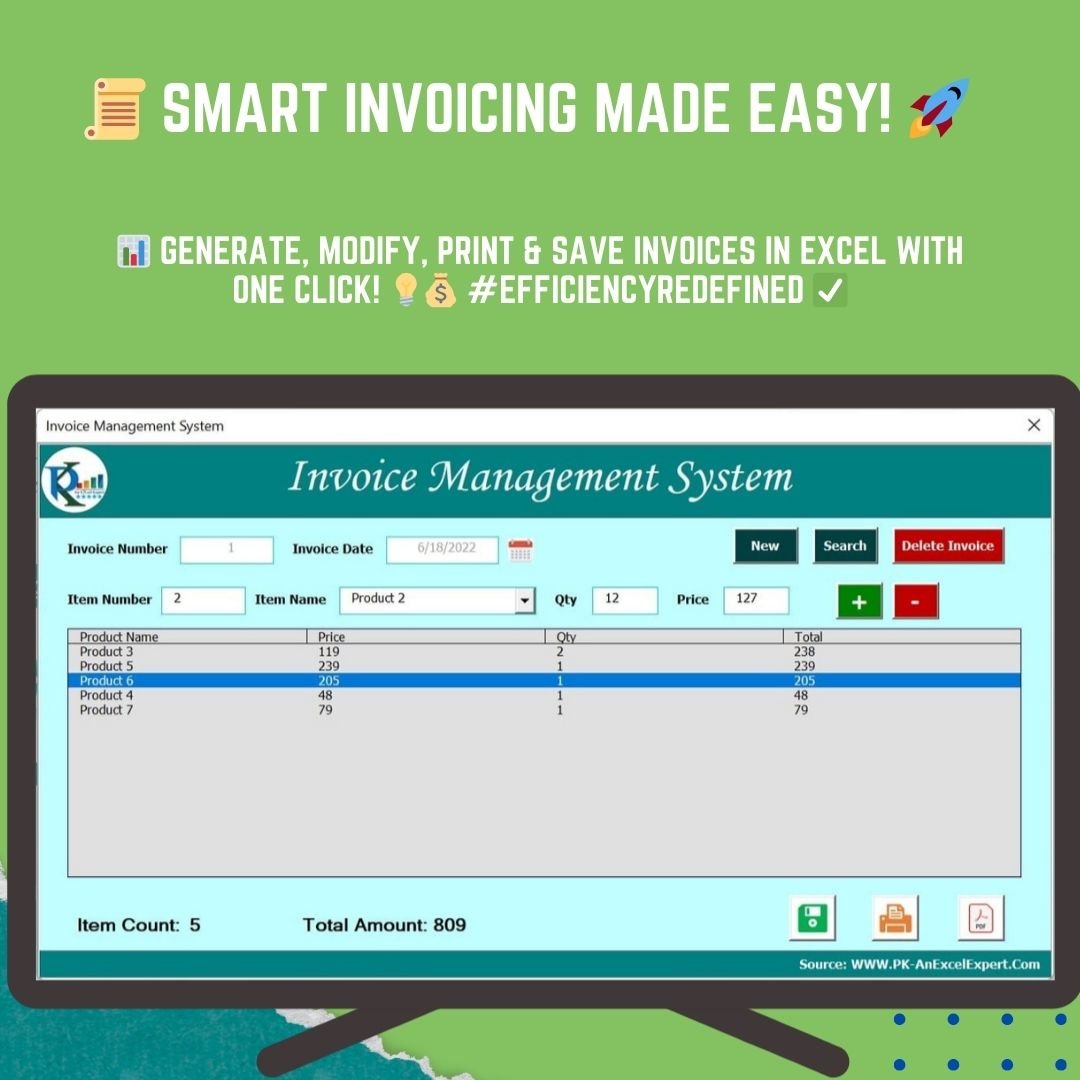 Invoice Management System V1.0
View the Invoice Management System →
8. Inventory Management and Profit Analysis Dashboard in Google Sheet — $17.99
Connects stock movement directly to margin. Shows which products genuinely make money, which tie up working capital, and where profitability is quietly leaking away.
 Inventory Management and Profit Analysis Dashboard in Google Sheet
View the Inventory & Profit Dashboard →
9. Expense Report and Tracker in Google Sheets — $6.99
Collaborative expense reporting. Staff submit, finance reviews, the dashboard totals it. No email chains, no lost receipts, no month-end scramble.
 Expense Report and Tracker in Google Sheets
View the Expense Report and Tracker →
10. Expense Reimbursement Tracker in Excel — $6.99
Tracks every reimbursement claim from submission through approval to payment, with ageing built in. Nothing sits unpaid for months, and nothing gets paid twice.
 Expense Reimbursement Tracker in Excel
View the Expense Reimbursement Tracker →
Smart Comparison — Individual Purchase vs the Bundle
| # | Template | Platform | Individual Price |
|---|---|---|---|
| 1 | Finance Summary Dashboard | Excel | $17.99 |
| 2 | Cash Flow Template | Excel | $6.99 |
| 3 | Expense Tracking Dashboard | Power BI | $17.99 |
| 4 | Monthly Budget Tracker | Excel | $6.99 |
| 5 | Income and Expense Dashboard | Google Sheets | $9.99 |
| 6 | Loan Portfolio KPI Dashboard | Excel | $12.99 |
| 7 | Invoice Management System V1.0 | Excel VBA | $6.99 |
| 8 | Inventory Management & Profit Analysis | Google Sheets | $17.99 |
| 9 | Expense Report and Tracker | Google Sheets | $6.99 |
| 10 | Expense Reimbursement Tracker | Excel | $6.99 |
| Total if bought individually | |||
| CFO’s Financial Command Toolkit — You Save $48.91 (44%) | $62.99 | ||
Why the Bundle Beats Buying Piecemeal
The savings are the least interesting part. Yes, $48.91 is real money. But the bigger win is coherence. When you buy templates one at a time over eighteen months, you end up with ten tools built to different conventions, using different category names, formatted differently. Reconciling them becomes its own job. Buying the set at once gives you a consistent system.
You get capability you didn’t know you needed. Most finance leaders come looking for a cash flow template. Six months later they need loan portfolio tracking, and then reimbursement ageing, and then vendor spend analysis. The bundle front-loads all of that, so the capability is there the day the requirement appears.
Platform flexibility protects you. If your company migrates from Excel to Google Workspace next year — or finally adopts Power BI — you already own the equivalent templates. No re-purchasing.
Best Practices for Deploying the Toolkit
Start with the baseline, not the bells and whistles. Load the Finance Summary Dashboard and Cash Flow Template first. Get an accurate picture of where you actually are before layering on analytics.
Push data collection to the edge. Roll the Google Sheets Expense Report and Tracker out to staff, and the Expense Reimbursement Tracker to line managers. When data enters continuously, month-end becomes a review rather than a reconstruction.
Reserve Power BI for the board. Use the Power BI Expense Dashboard for the audience that wants to interrogate the numbers themselves. Keep your internal working templates in Excel and Sheets where they’re faster to edit.
Standardise your categories once. Before you load real data, agree on your expense categories and department names across all ten templates. An hour spent here saves days of reconciliation later.
Review the loan portfolio quarterly, not annually. Debt exposure changes faster than most finance teams check it. The Loan Portfolio KPI Dashboard takes minutes to update once configured.
Explore More Templates
🔹 All Financial Tools Templates – The complete finance collection.
🔹 All Excel Dashboards – Every Excel dashboard we build.
🔹 All Power BI Dashboards – Interactive BI reporting templates.
Frequently Asked Questions
What is included in the CFO’s Financial Command Toolkit?
Ten premium finance templates: Finance Summary Dashboard (Excel), Cash Flow Template (Excel), Expense Tracking Dashboard (Power BI), Monthly Budget Tracker (Excel), Income and Expense Dashboard (Google Sheets), Loan Portfolio KPI Dashboard (Excel), Invoice Management System V1.0 (Excel VBA), Inventory Management and Profit Analysis Dashboard (Google Sheets), Expense Report and Tracker (Google Sheets), and Expense Reimbursement Tracker (Excel).
How much does the bundle save me?
The ten templates cost $111.90 individually. The bundle is $62.99, saving you $48.91 — a 44% discount.
Do I need Power BI to use the bundle?
No. Nine of the ten templates run in Excel or Google Sheets. Only the Expense Tracking Dashboard requires Power BI Desktop, which Microsoft offers as a free download. The other nine templates work fully without it.
Do I need advanced Excel or VBA skills?
No. All templates are pre-built and tested. You replace the sample data with your own and the dashboards update automatically. The Invoice Management System uses VBA, but the code is written and working — you simply enable macros when you open the file.
Can I customise the templates for my chart of accounts?
Yes. Categories, departments, expense types, vendors and KPI targets are all editable. Charts and pivot tables expand automatically as you add rows.
Is this a one-time purchase or a subscription?
One-time purchase. You download the files and own them. There is no recurring fee.
Conclusion
The CFO’s Financial Command Toolkit is not a collection of pretty spreadsheets — it is an operating system for a finance function. Cash, budget, spend, receivables, debt and margin, all covered, all across the three platforms your team actually uses, all for less than the cost of two of the templates bought separately.
🚀 Take Command of Your Finances
10 Premium Templates • Excel + Google Sheets + Power BI
$111.90 $62.99
Save $48.91 — 44% Off
Visit our YouTube channel for step-by-step video tutorials
Youtube.com/@PKAnExcelExpert