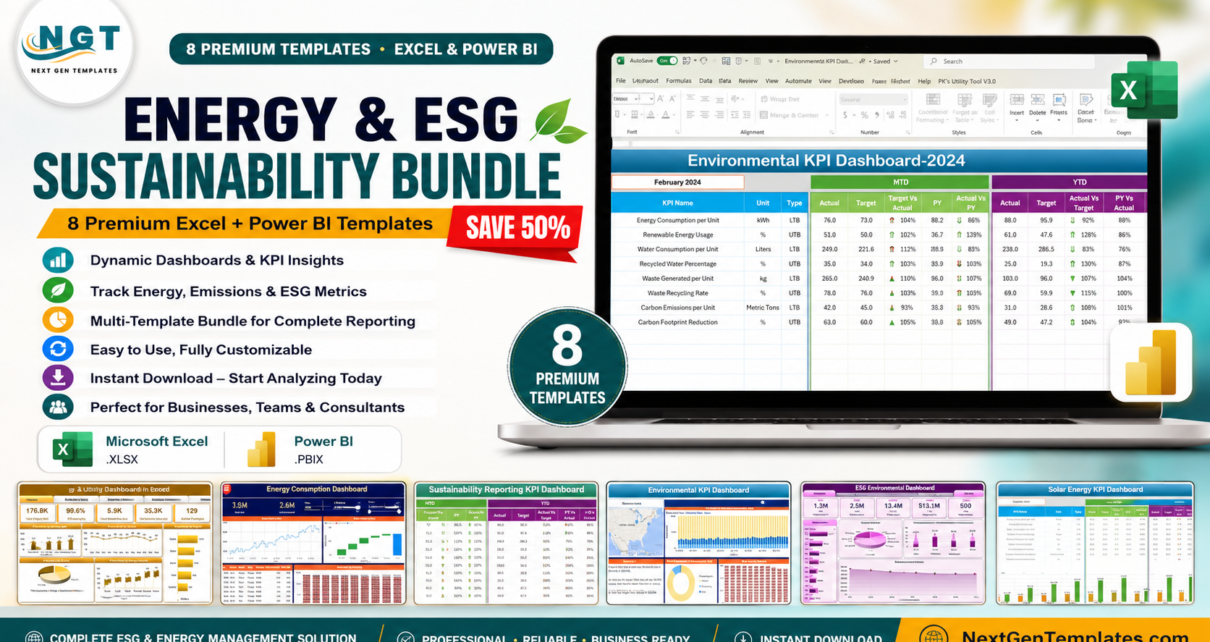
The Energy & ESG Sustainability Bundle brings together 8 premium Excel and Power BI dashboard templates specifically built for sustainability managers, ESG analysts, energy professionals, and environmental compliance teams. If you have been looking for a comprehensive toolkit to track carbon emissions, monitor energy performance, report ESG metrics to stakeholders, and analyze environmental compliance — this bundle delivers everything in a single download at a fraction of the individual cost.
Bought separately, these 8 templates would cost you $119.92. The bundle is priced at just $59.99, saving you $59.93 (50% off). Every template is plug-and-play, works in Excel 2016+ or Power BI Desktop, and requires no programming or advanced technical skills.
📦 8 Premium Templates | Excel + Power BI
Individual Total: $119.92 → Bundle Price: $59.99
Save $59.93 — 50% Off!
🔑 Key Features of the Energy & ESG Sustainability Bundle
This bundle covers every critical dimension of energy and ESG performance reporting. Here is what makes it stand out from buying individual templates:
Comprehensive ESG Framework: With two dedicated ESG dashboards — the ESG KPI Dashboard and the ESG Environmental Dashboard — you can track E, S, and G pillars simultaneously. Monitor carbon footprint, governance compliance, diversity metrics, social responsibility KPIs, and stakeholder-ready reporting outputs.
Full Energy Analytics Suite: Three energy-specific templates give you granular visibility into energy output, consumption trends (electricity, gas, water), utility facility performance, and renewable vs non-renewable energy ratios. The Power BI template adds advanced DAX-powered forecasting and multi-location cost maps.
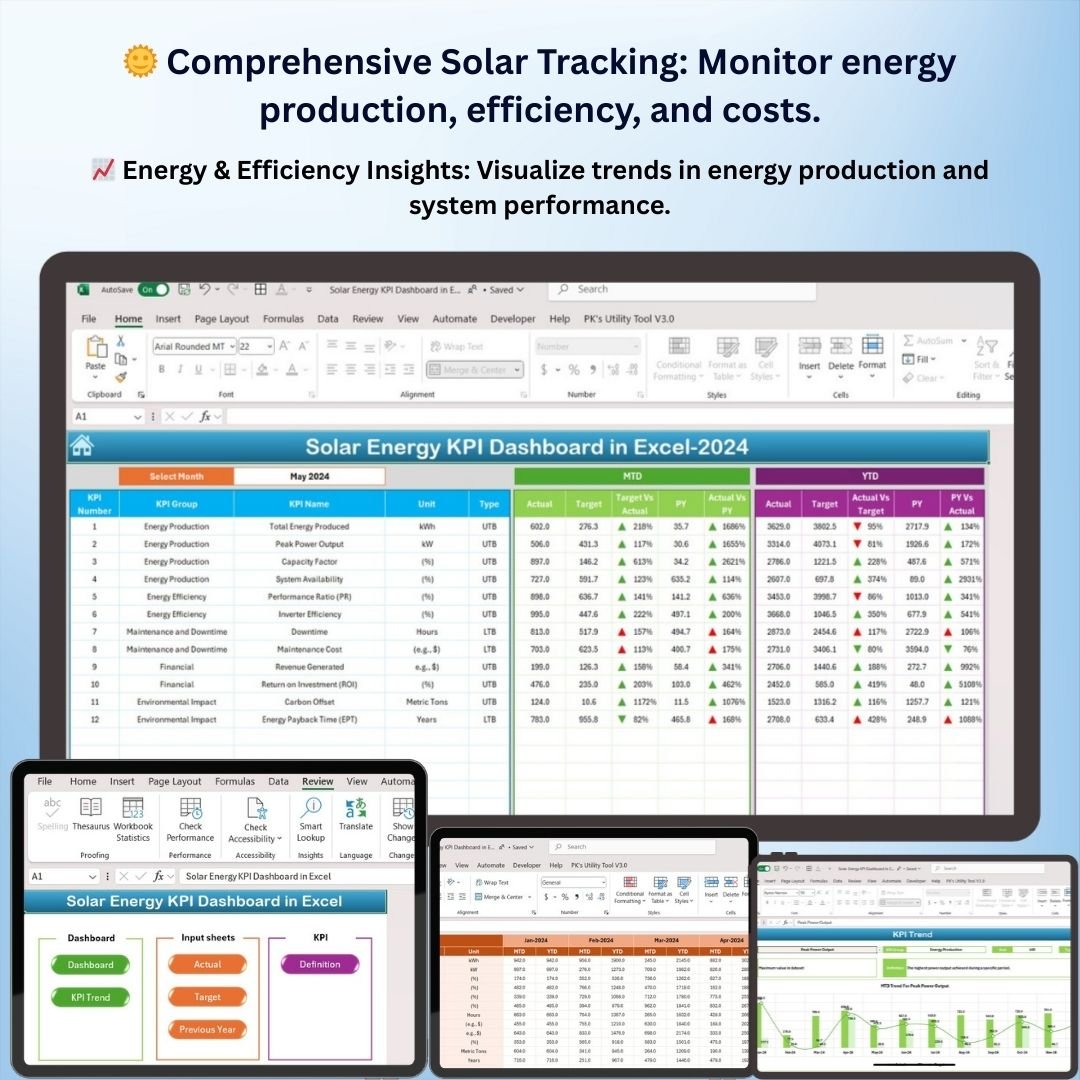
Solar Energy Monitoring: The Solar Energy KPI Dashboard tracks panel efficiency, energy production output, operational costs, and system uptime — essential for solar project managers and renewable energy teams.
Environmental Compliance Dashboard: The ESG Environmental Dashboard features 5 interactive pages including dedicated Emissions Analysis, Energy & Water tracking, Waste Management, and a Compliance page monitoring incidents, compliance scores, and renewable energy percentages by region.
Sustainability Reporting Ready: The Sustainability Reporting KPI Dashboard generates monthly, quarterly, and annual sustainability reports aligned with ESG standards — perfect for CSR teams and compliance officers preparing investor disclosures.
📦 What’s Included in the Energy & ESG Sustainability Bundle
1. ESG KPI Dashboard in Excel
A centralized dashboard for tracking Environmental, Social, and Governance KPIs. Monitor carbon footprint, diversity and inclusion metrics, governance compliance, and ESG reporting performance in real time with dynamic charts and conditional formatting.

ESG KPI Dashboard in Excel
→ View ESG KPI Dashboard on NextGenTemplates
2. Energy & Utility Dashboard in Excel
Monitor energy output, downtime, emissions, and operational efficiency across multiple facilities. Includes 5 dedicated worksheet tabs covering Overview KPIs, Production & Output comparisons, Downtime & Maintenance analysis, Emissions & Environmental tracking, and Efficiency & Risk breakdowns with slicers and charts.
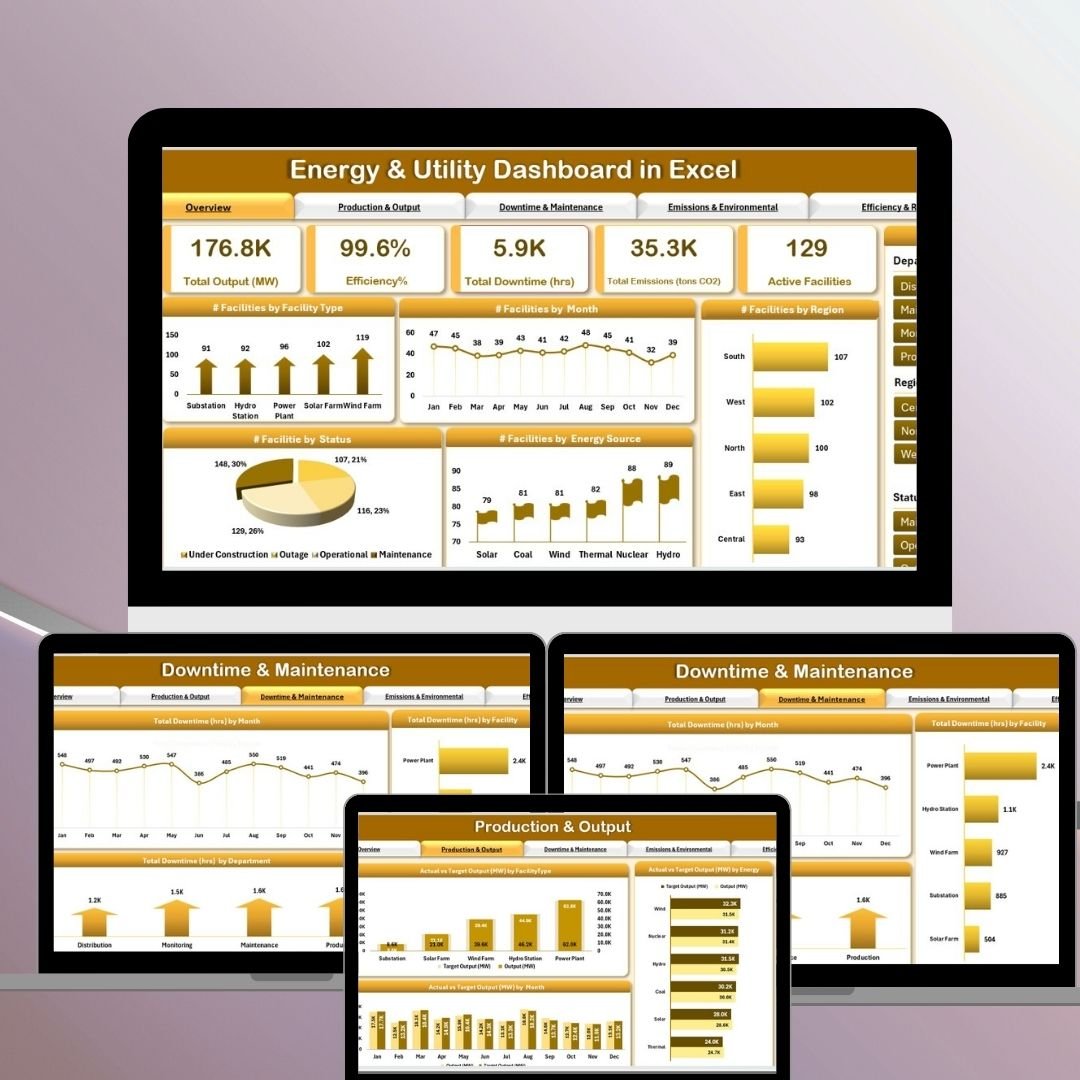
Energy & Utility Dashboard in Excel
→ View Energy & Utility Dashboard on NextGenTemplates
3. Energy Consumptions Dashboard in Power BI
An advanced Power BI report with Power Query data transformation, DAX measures, and interactive bookmarks for navigating Electricity, Gas, and Water consumption dashboards. Features city-level cost maps, consumption type comparisons, trend and forecast analytics, and building-level cost summaries — ideal for facility managers and energy analysts working in Power BI.
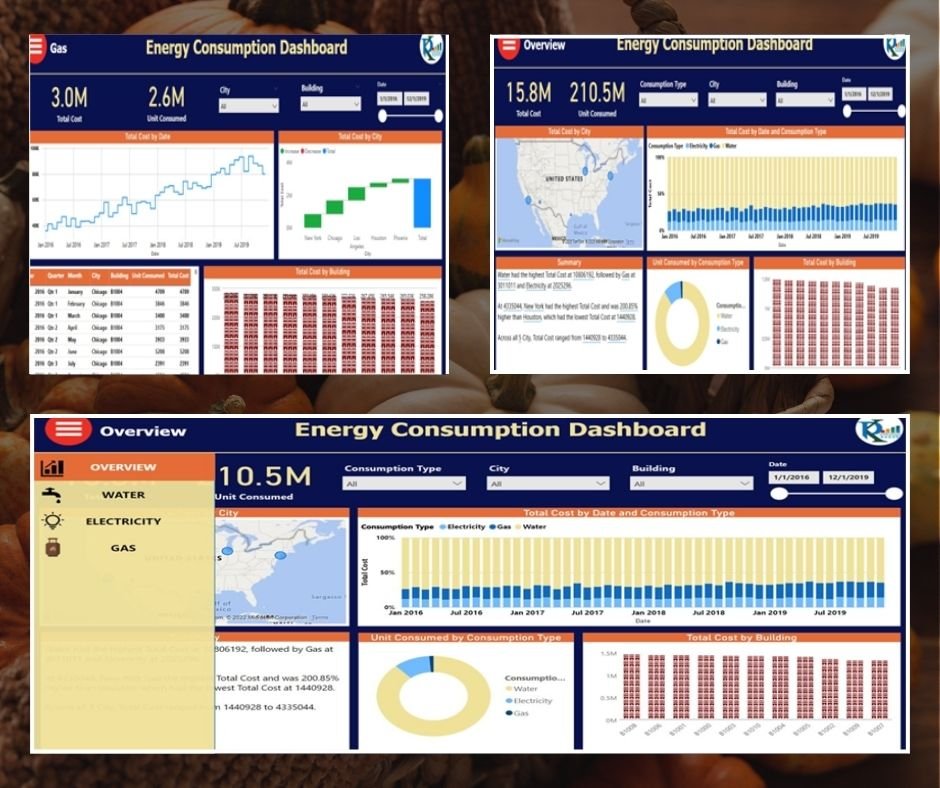
Energy Consumptions Dashboard in Power BI
→ View Energy Consumptions Power BI Dashboard on NextGenTemplates
4. Environmental KPI Dashboard in Excel
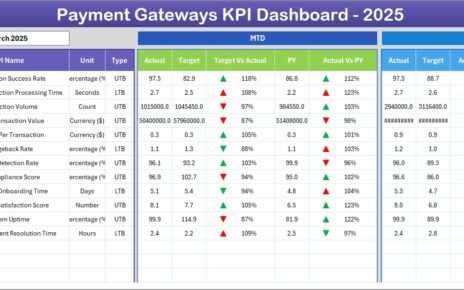
A 7-sheet Excel workbook for monitoring environmental metrics including energy usage, water consumption, waste management, and greenhouse gas emissions. Includes a Home navigation sheet, Dashboard summary, KPI Trend analysis with MTD/YTD charts, Actual Numbers Input, Target Sheet for goal-setting, Previous Year comparison, and KPI Definition reference sheet.
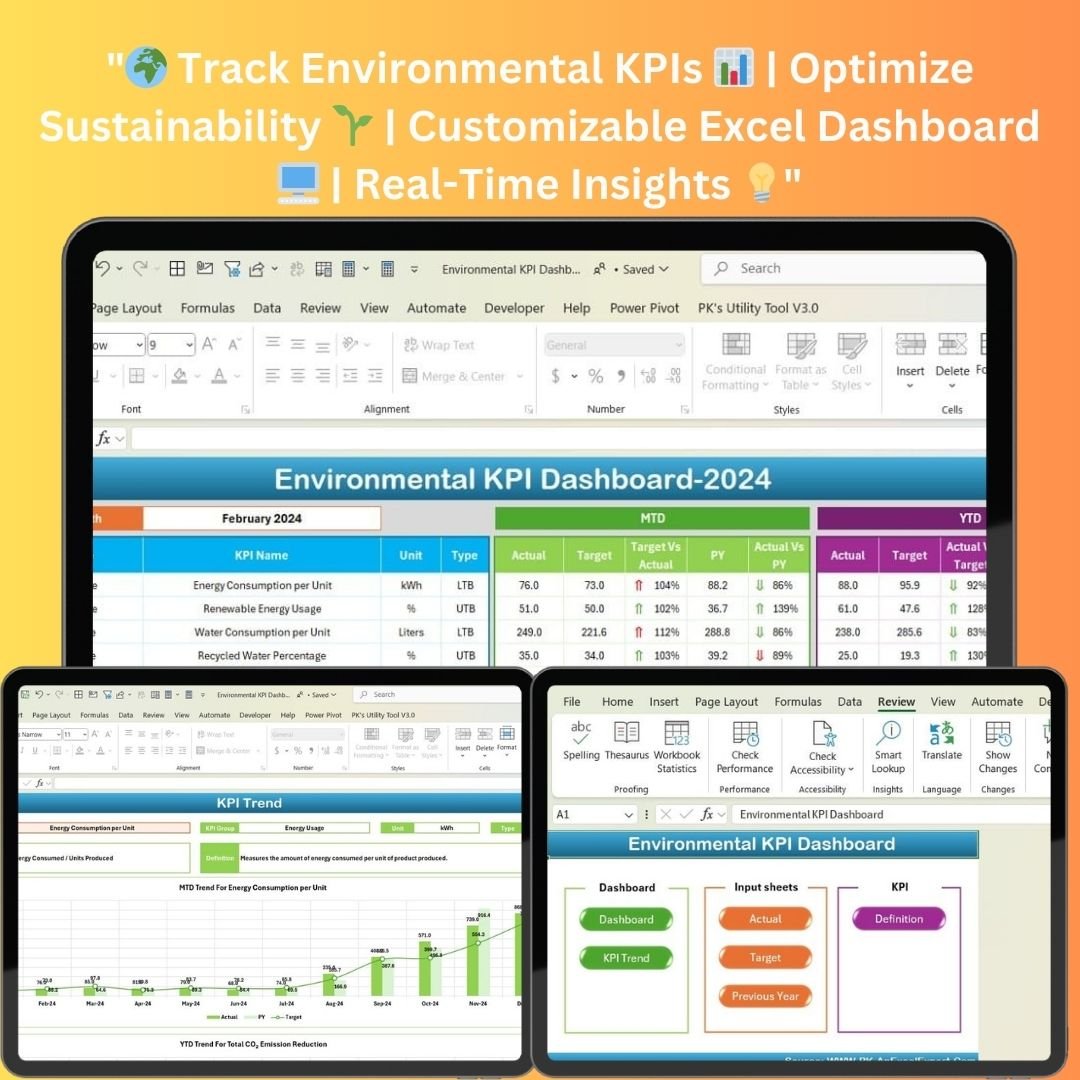
Environmental KPI Dashboard in Excel
→ View Environmental KPI Dashboard on NextGenTemplates
5. Sustainability Reporting KPI Dashboard in Excel
Designed for CSR teams and sustainability officers, this dashboard tracks carbon emissions, social responsibility indicators, employee engagement, community outreach, and time-based ESG KPI performance. Generates stakeholder reports with dynamic charts and supports monthly, quarterly, and annual analysis aligned with global ESG reporting standards.

Sustainability Reporting KPI Dashboard in Excel
→ View Sustainability Reporting KPI Dashboard on NextGenTemplates
6. Energy KPI Dashboard in Excel
A focused energy performance workbook tracking Energy Efficiency, Energy Consumption, Energy Cost, Carbon Footprint, Energy Reliability, Renewable Energy Usage, and Environmental Impact KPIs. Includes MTD/YTD input sheets, a Target Sheet, Previous Year comparison, KPI Trend charts, and a KPI Definition sheet. Fully customizable for any industry.

Energy KPI Dashboard in Excel
→ View Energy KPI Dashboard on NextGenTemplates
7. ESG Environmental Dashboard in Excel
A professionally designed, pivot-powered multi-page ESG environmental analytics dashboard. Features 5 interactive analysis pages (Overview, Emissions Analysis, Energy & Water, Waste Management, Compliance), dynamic KPI cards tracking Total Carbon Emissions, Total Energy, Total Water Usage, and Total Carbon Offset, plus slicer-based filtering by Region, Facility, Industry Sector, and Emission Source. Zero macros required — refresh all pivot tables with one click.
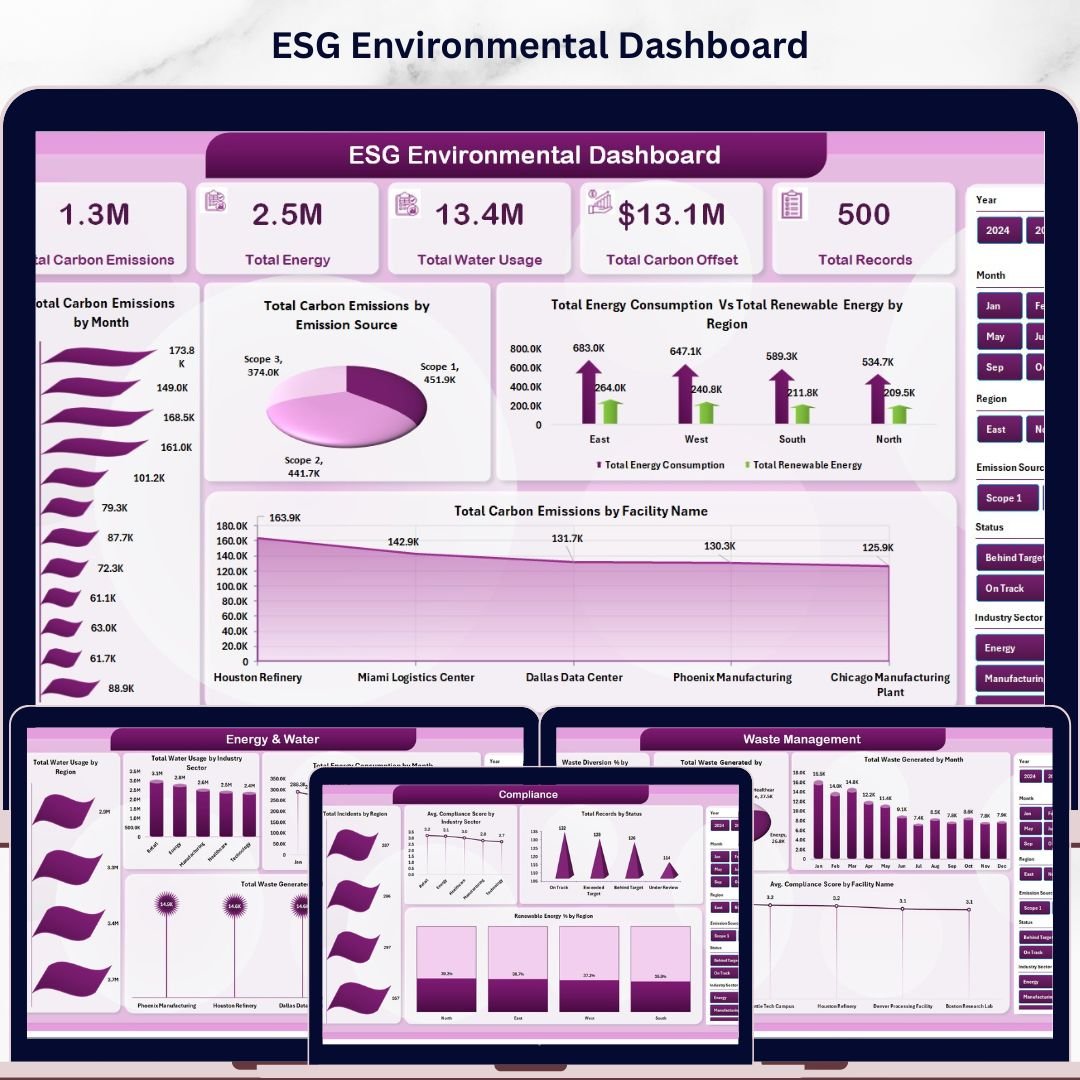
ESG Environmental Dashboard in Excel
→ View ESG Environmental Dashboard on NextGenTemplates
8. Solar Energy KPI Dashboard in Excel
Purpose-built for solar energy professionals, this dashboard tracks panel performance, total energy production, system efficiency rates, operational costs per kWh, and maintenance metrics. Includes customizable KPIs for residential and commercial solar installations with interactive slicers and trend charts for real-time monitoring and analysis.
Solar Energy KPI Dashboard in Excel
→ View Solar Energy KPI Dashboard on NextGenTemplates
💡 Smart Comparison — Individual vs Bundle
| # | Product | Platform | Individual Price |
|---|---|---|---|
| 1 | ESG KPI Dashboard in Excel | MS Excel | $12.99 |
| 2 | Energy & Utility Dashboard in Excel | MS Excel | $17.99 |
| 3 | Energy Consumptions Dashboard in Power BI | Power BI | $17.99 |
| 4 | Environmental KPI Dashboard in Excel | MS Excel | $12.99 |
| 5 | Sustainability Reporting KPI Dashboard in Excel | MS Excel | $12.99 |
| 6 | Energy KPI Dashboard in Excel | MS Excel | $12.99 |
| 7 | ESG Environmental Dashboard in Excel | MS Excel | $17.99 |
| 8 | Solar Energy KPI Dashboard in Excel | MS Excel | $12.99 |
| Individual Total | $119.92 | ||
| Bundle Price (Save 50%) | $59.99 | ||
🌟 Advantages of the Energy & ESG Sustainability Bundle
One Purchase, Complete Coverage: From ESG governance tracking to solar panel monitoring and Power BI energy consumption analysis, this single bundle eliminates the need to source, evaluate, and purchase multiple separate tools from different vendors.
Immediate Deployment: Every template is ready to use the moment you download it. Simply replace the sample data, and your KPI dashboards, trend charts, and comparison tables update instantly. No setup fees, no subscriptions, no SaaS contracts.
Multi-Stakeholder Value: Different templates serve different audiences within the same organization. Finance can use ESG KPI Dashboards for investor reporting. Operations can use the Energy & Utility Dashboard for facility performance. Sustainability teams can use the Environmental KPI Dashboard for compliance monitoring. Solar project managers get a dedicated tool for panel efficiency tracking.
Excel + Power BI Flexibility: The bundle includes both Excel-native and Power BI templates, giving your team flexibility depending on their tool preferences. The Power BI Energy Consumptions Dashboard adds DAX-powered forecasting and multi-location mapping that Excel cannot replicate.
📌 Best Practices for Using the Energy & ESG Sustainability Bundle
Start with the ESG KPI Dashboard to establish your baseline Environmental, Social, and Governance performance metrics. Then use the Environmental KPI Dashboard and ESG Environmental Dashboard to drill deeper into emissions and compliance data. Deploy the Energy KPI and Energy & Utility Dashboards for operational energy performance tracking. Use the Sustainability Reporting KPI Dashboard for generating monthly or quarterly stakeholder reports. Assign the Solar Energy KPI Dashboard to renewable energy project teams. Use the Power BI Energy Consumptions Dashboard for enterprise-wide cross-location energy cost analysis.
📑 Explore More Templates
Looking for more ESG and sustainability analytics tools? Explore the full range at nextgentemplates.com — covering Finance, HR, Operations, Healthcare, Manufacturing, and more across Excel, Power BI, and Google Sheets.
❓ Frequently Asked Questions
What is included in the Energy & ESG Sustainability Bundle?
The bundle includes 8 premium templates: ESG KPI Dashboard in Excel, Energy & Utility Dashboard in Excel, Energy Consumptions Dashboard in Power BI, Environmental KPI Dashboard in Excel, Sustainability Reporting KPI Dashboard in Excel, Energy KPI Dashboard in Excel, ESG Environmental Dashboard in Excel, and Solar Energy KPI Dashboard in Excel.
What Excel version do I need?
All Excel templates are compatible with Excel 2016 and later versions, including Microsoft 365. No macros or VBA are required for the ESG Environmental Dashboard — it runs entirely on pivot tables and native Excel features.
Do I need Power BI Desktop for the Power BI template?
Yes, the Energy Consumptions Dashboard in Power BI requires Power BI Desktop (free download from Microsoft). It uses Power Query for data transformation and DAX measures for advanced calculations.
Can I customize these templates for my specific KPIs?
Absolutely. Every template is fully customizable. You can add custom KPIs, modify chart types, adjust color themes, and expand data models to match your organization’s specific requirements.
How do I download the bundle after purchase?
After purchase, you will receive an instant download link to a ZIP file containing all 8 templates. Extract the ZIP and open each file in the relevant application.
Is this bundle suitable for ESG compliance reporting?
Yes. The ESG Environmental Dashboard includes a dedicated Compliance page tracking incidents, compliance scores, and regulatory status by region. The Sustainability Reporting KPI Dashboard supports stakeholder-ready reporting aligned with ESG frameworks.
🏁 Conclusion
The Energy & ESG Sustainability Bundle is the most comprehensive, cost-effective toolkit available for organizations serious about ESG reporting, energy performance management, and environmental compliance. With 8 professionally designed templates spanning Excel and Power BI, you get everything from carbon emissions tracking and solar panel monitoring to stakeholder-ready sustainability reports — all in a single download.
At $59.99 for all 8 templates, you are saving $59.93 compared to buying individually. Whether you are a sustainability manager, energy analyst, ESG consultant, or environmental compliance officer, this bundle delivers immediate, tangible value.
🌍 Get the Energy & ESG Sustainability Bundle Now
8 Premium Templates | Excel + Power BI | $59.99 — Save 50%
🎥 Watch step-by-step tutorials on YouTube:
YouTube.com/@PKAnExcelExpert