Introduction
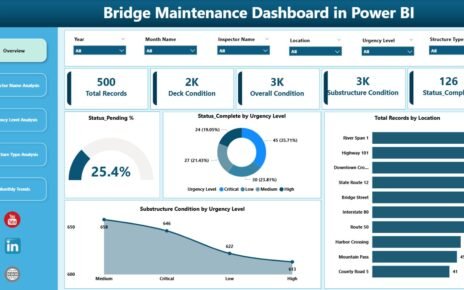
The Payment Gateways KPI Dashboard is a comprehensive and ready-to-use template designed to monitor and analyze key performance indicators (KPIs) related to payment gateway operations. This dashboard provides insightful visuals and data-driven analytics to optimize payment processing efficiency and decision-making.
Key Features of Payment Gateways KPI Dashboard
Click to Buy Payment Gateways KPI Dashboard in Excel
- Seven well-structured worksheets for comprehensive KPI tracking and analysis.
- User-friendly navigation with interactive buttons on the Home sheet.
- Dynamic month selection enabling up-to-date data visualization across the dashboard.
- Conditional formatting with up/down arrows for quick performance insight relative to targets and previous year.
- Trend charts for monthly and yearly performance analysis.
- Dedicated input sheets for actual, target, and previous year’s data ensuring easy and systematic data entry.
- Clear KPI definitions including formulas and performance types for better understanding.
Dashboard Pages Explanation
1. Home Sheet
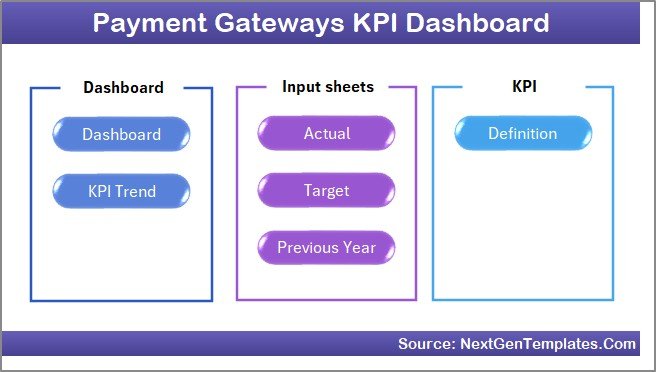
This index sheet provides six easy-to-access buttons to jump directly to each relevant worksheet, streamlining navigation within the dashboard.
 Home Page
2. Dashboard Sheet
Click to Buy Payment Gateways KPI Dashboard in Excel
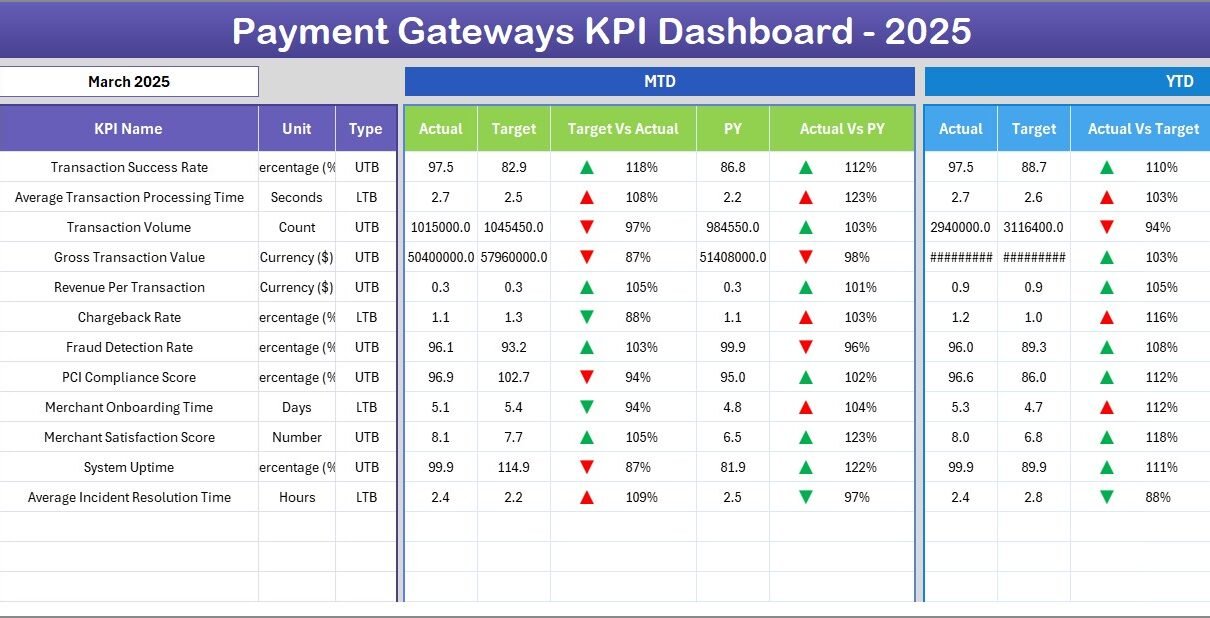
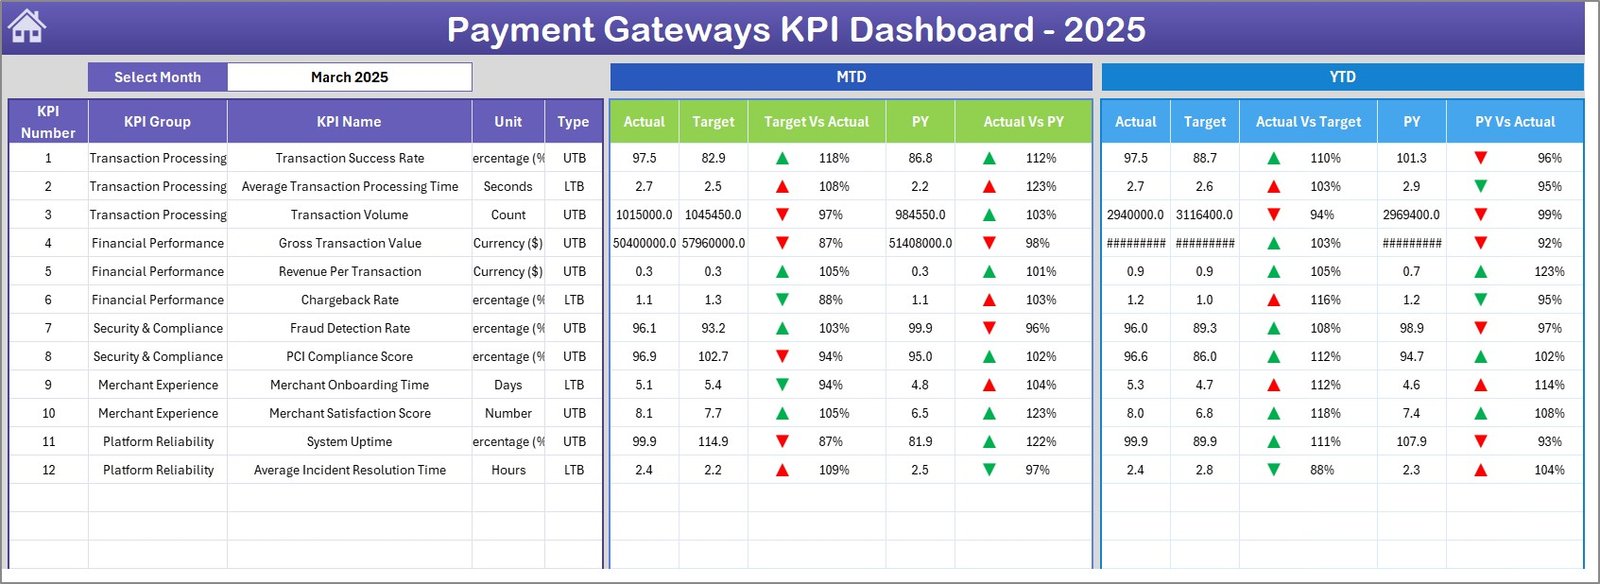
This is the main sheet presenting all KPI information at a glance.
- A month dropdown (cell D3) allows selection of any month to display data dynamically.
- Displays Monthly-To-Date (MTD) Actuals, Targets, and Previous Year (PY) numbers with conditional formatting to compare Target Vs Actual and PY Vs Actual.
- Similarly, shows Year-To-Date (YTD) data with comparative performance indicators.
 Payment Gateways KPI Dashboard
3. KPI Trend Sheet
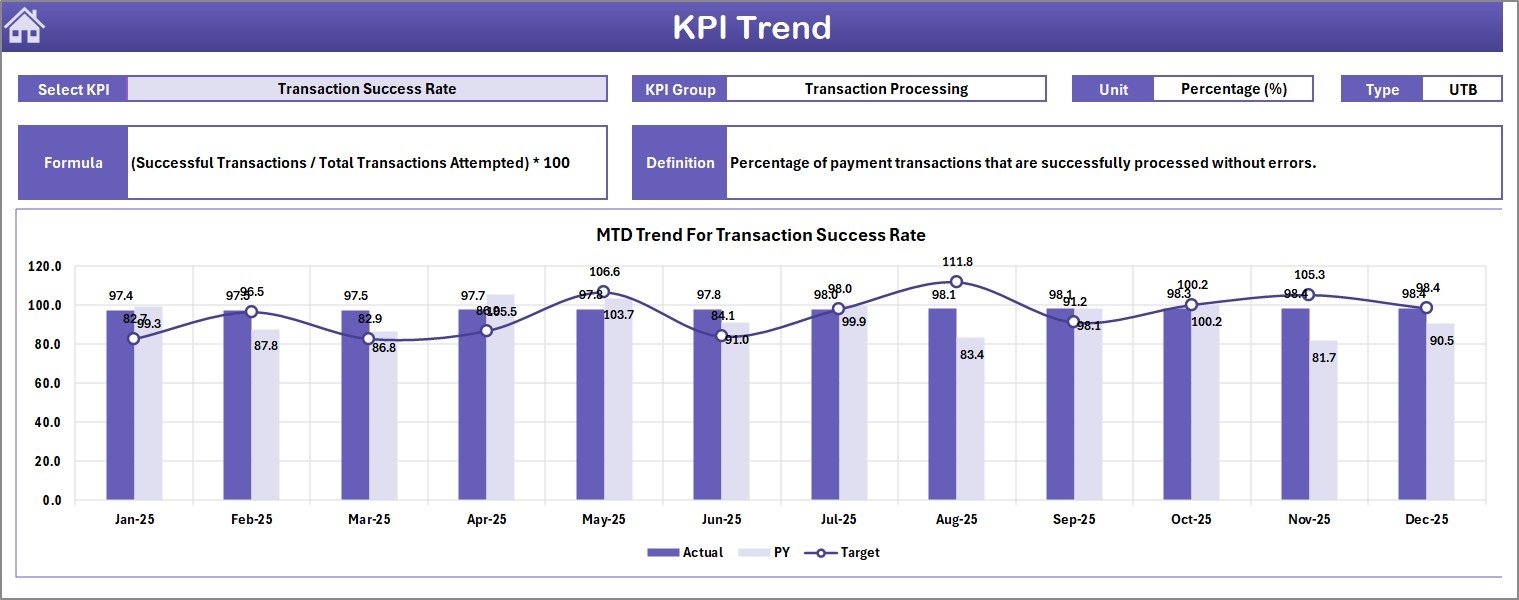
This sheet focuses on individual KPI performance trends.
- Select the KPI from a dropdown (cell C3) to display specific data.
- View KPI group, unit, type (Lower the Better or Upper the Better), formula, and definition.
- Analyze MTD and YTD trend charts for Actual, Target, and PY values to observe progress and patterns.
 KPI Trend Sheet
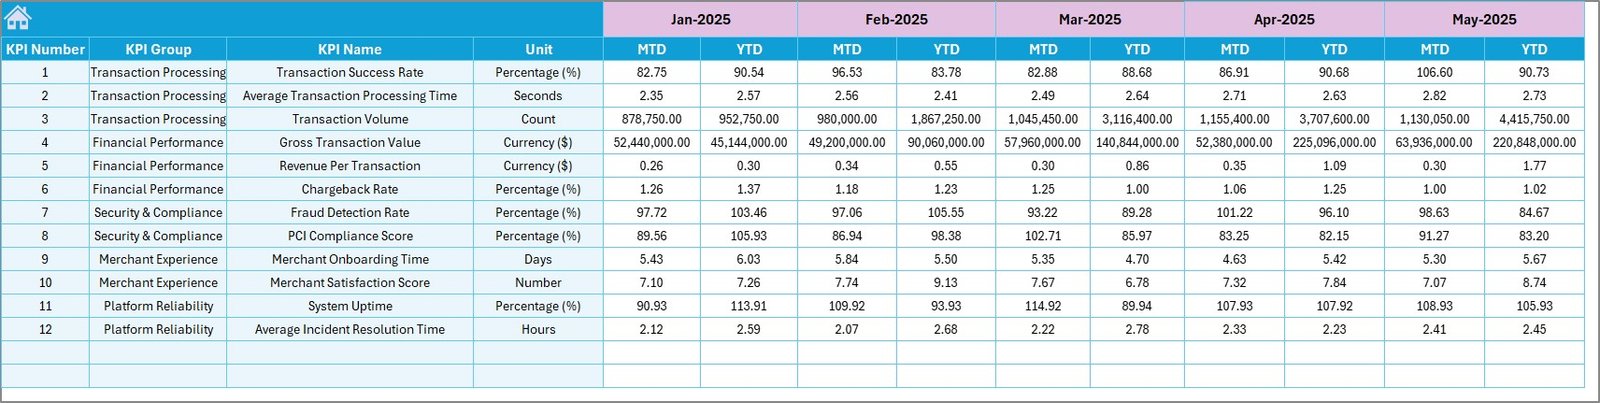
4. Actual Numbers Input Sheet
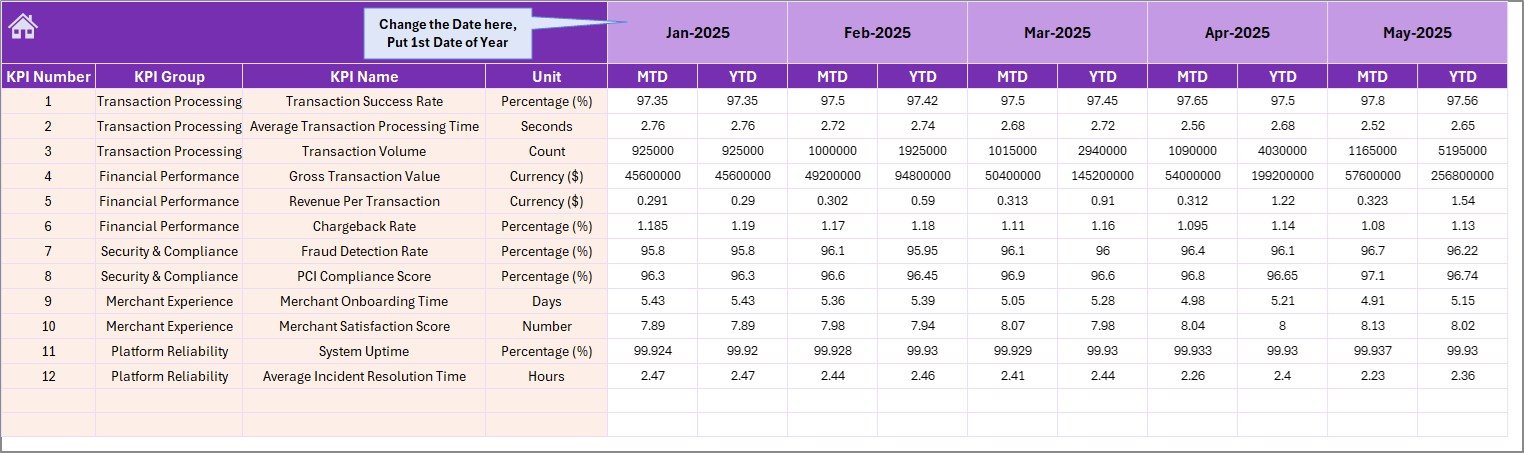
Enter Actual KPI values here for MTD and YTD for the selected month.
- Change the start month of the year in cell E1 to update the timeline.
- Facilitates precise and easy entry of actual performance data.
 Actual Numbers Input sheet
5. Target Number Input Sheet
This sheet allows input of your target values for each KPI, both for MTD and YTD.
 Target Number Input sheet
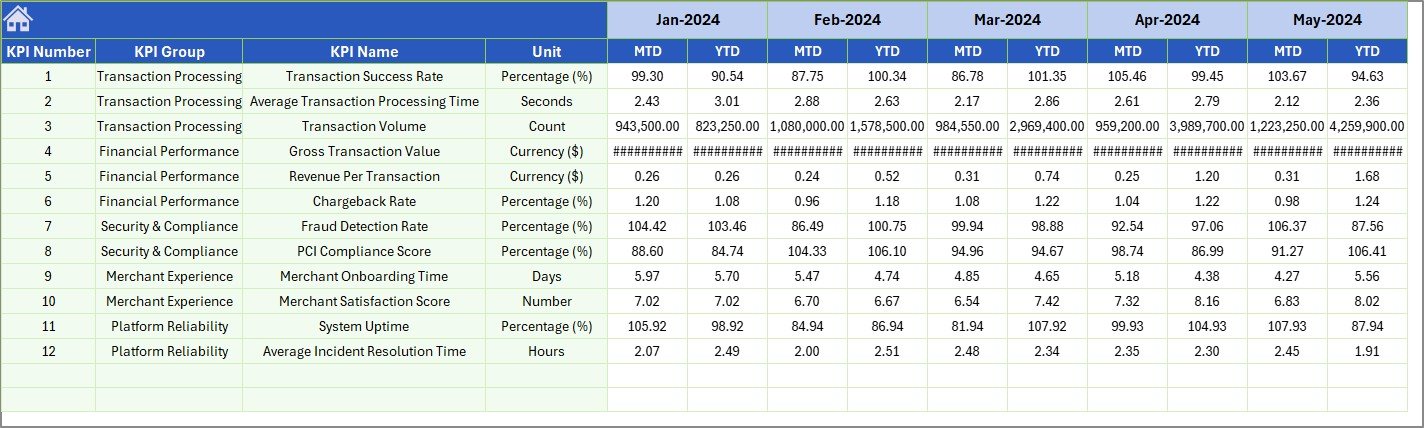
6. Previous Year Number Sheet
Enter previous year numbers for comparing current performance effectively.
 Previous Year Number Input sheet
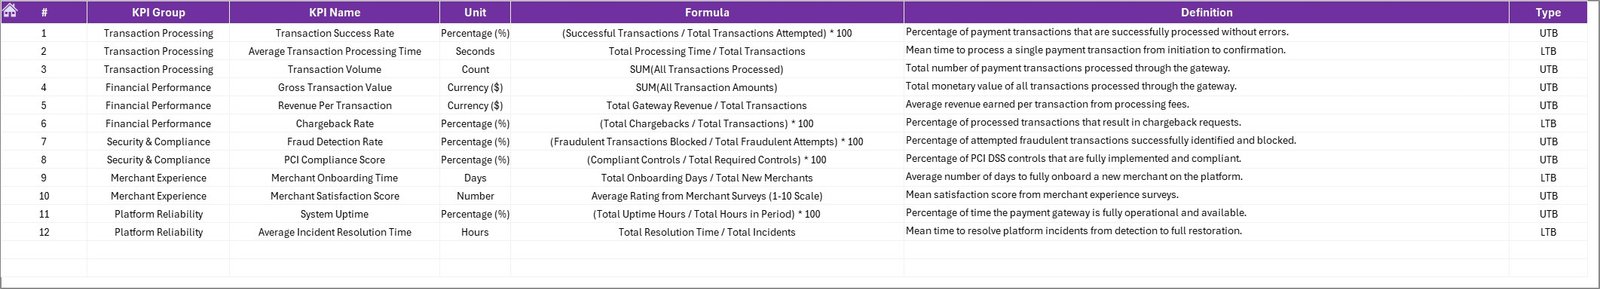
7. KPI Definition Sheet
Maintain detailed descriptions of each KPI.
- Enter KPI Name, Group, Unit, Formula, and Definition.
- Specify the KPI type as LTB (Lower The Better) or UTB (Upper The Better) to assist in interpretation.
 KPI Definition sheet
Advantages of Payment Gateways KPI Dashboard
- Centralized Data Monitoring: All critical payment gateway KPIs consolidated in one place.
- Improved Decision-Making: Real-time data with comparative metrics enables quick, informed decisions.
- Visual Insights: Interactive charts and conditional formatting enhance data comprehension.
- Customizable: Easily update input sheets to reflect changing business needs.
- Time-Saving: Pre-built formulas and layouts reduce setup time significantly.
Opportunities for Improvement
Click to Buy Payment Gateways KPI Dashboard in Excel
- Integration with live payment gateway APIs for automated data refresh.
- Mobile-friendly dashboard design for access on tablets and smartphones.
- Expanded KPI list with industry-specific or emerging metrics.
- Incorporate predictive analytics to forecast future payment trends.
- Additional user role management for secure access control.
Best Practices
- Regularly update the actual, target, and previous year input sheets to maintain data accuracy.
- Use the KPI Definition sheet to ensure all team members understand measurement criteria.
- Leverage conditional formatting and trend analysis for quick performance reviews.
- Schedule monthly reviews aligned with business objectives to optimize payment gateway operations.
- Backup dashboard data to prevent loss of important KPIs tracking information.
FAQs
Can I customize the KPIs in this Payment Gateways KPI Dashboard?
Yes, the dashboard allows modifications through the KPI Definition sheet and input tabs, enabling you to add, remove, or edit KPIs as per your business requirements.
Is this dashboard compatible with all Excel versions?
This dashboard is designed for modern versions of Microsoft Excel. For best performance, use Excel 2016 or later.
Can I automate data input from external sources?
Currently, data input is manual, but future improvements could include API integrations for automation.
How do I interpret LTB (Lower The Better) and UTB (Upper The Better) KPI types?
LTB KPIs indicate that a lower value is favorable (e.g., error rates), while UTB KPIs indicate a higher value is better (e.g., transaction volume).
Conclusion
The Payment Gateways KPI Dashboard is an essential tool for any organization aiming to streamline their payment gateway performance tracking. Its intuitive design, dynamic data selection, and comprehensive KPI visualization add significant value to operational decision-making. Customize the dashboard to your requirements and leverage the actionable insights it provides to drive your payment processes to new heights.
For more expert Excel dashboard templates and tutorials, visit Microsoft Excel Support.
Visit our YouTube channel to watch the demo.
Click to Buy Payment Gateways KPI Dashboard in Excel