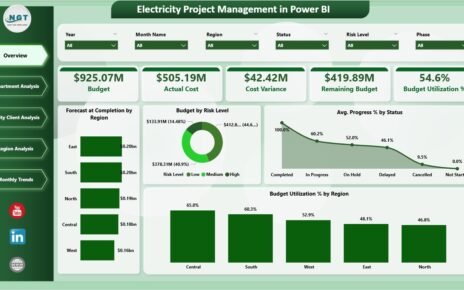
The Yoga Wellness Studio Dashboard in Power BI tracks 5 KPI cards and 16 charts across 5 pages — Overview, Class Performance, Instructor Analysis, Member Insights, and Studio Trend. Setup takes under 10 minutes — connect your studio’s class log to Power BI Desktop, and every card, slicer, and chart updates automatically.
Yoga and wellness studios sit on a goldmine of operational data — class bookings, instructor payroll, equipment cost, member type, booking channel — but most of it lives across spreadsheets, the booking platform’s clunky reports, and instructor spreadsheets. Owners end up running their business on intuition. The Yoga Wellness Studio Dashboard in Power BI consolidates everything into a single .pbix file with cards, charts, and slicers that answer the questions yoga business owners actually care about: which location is profitable, which instructor is over- or under-utilized, and which class type drives the most revenue per session.
Yoga Wellness Studio Dashboard in Power BI
Key Features of the Yoga Wellness Studio Dashboard in Power BI
The Yoga Wellness Studio Dashboard in Power BI ships with 5 dedicated report pages, 5 KPI cards, and 16 interactive charts — all wired up to a single sample dataset that you replace with your own class log. Here are the standout capabilities:
- 5 KPI cards on the Overview — Total Revenue, Total Studio Cost, Total Instructor Cost, Total Equipment Cost, and Total Attendees, all responding to slicer selections.
- Slicer-based filtering on every page — Studio Location, Class Type, Instructor, and Month. Apply once and every visual filters in unison.
- Profit Margin gauge on the Overview page that recalculates as you filter location, class type, or month — so you see exactly which slice of the business is profitable.
- Instructor satisfaction analysis — Avg Satisfaction by Instructor lets you compare member feedback scores across teachers without exporting a separate survey report.
- Booking channel breakdown — Total Classes by Booking Channel exposes which channels (app, web, walk-in, partner) deliver bookings. Useful when you’re deciding where to spend marketing budget.
- Year-over-year and month-over-month trends on the Studio Trend page — Total Revenue by Year, Total Attendees by Month, Total Capacity by Studio Location.
- Fully editable .pbix — open in Power BI Desktop (free), change colors, add measures in DAX, swap visuals, add new pages. No vendor lock-in.
Dashboard Pages Explanation
The dashboard contains five pages, each focused on a different decision-making angle for studio operations.
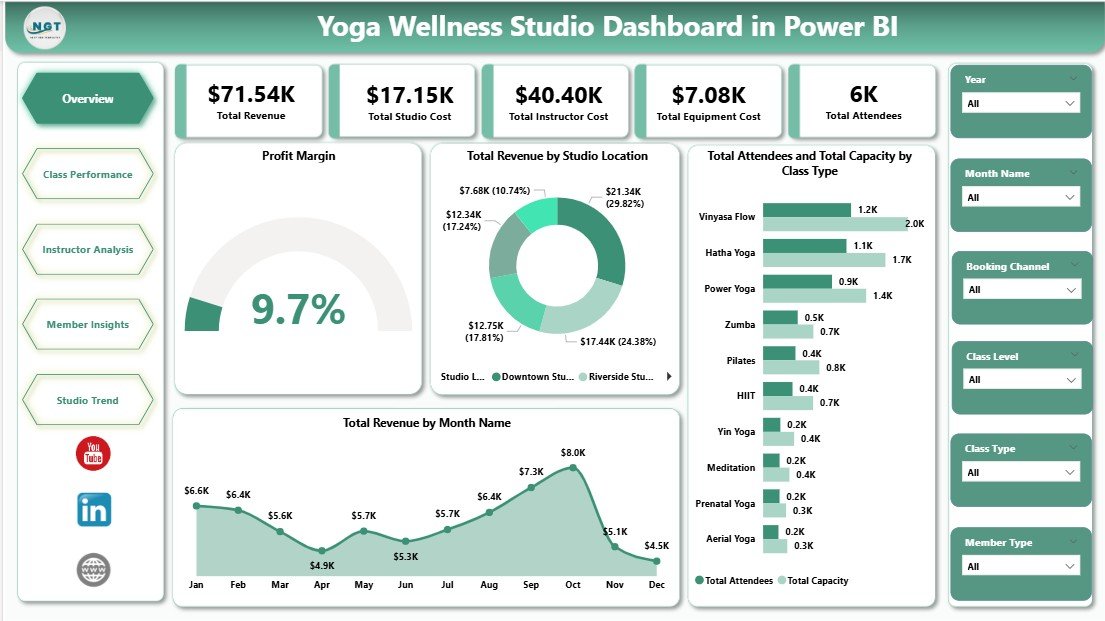
1 — Overview Page
The Overview page is the top-of-the-funnel view for studio owners. The top section shows 5 cards: Total Revenue, Total Studio Cost, Total Instructor Cost, Total Equipment Cost, and Total Attendees. Below the cards, four charts answer the most common questions:
- Profit Margin — gauge showing overall studio profit margin percentage.
- Total Revenue by Studio Location — column chart comparing every location’s revenue.
- Total Attendees and Total Capacity by Class Type — clustered chart comparing demand against supply for every yoga style.
- Total Revenue by Month Name — time-series view of monthly revenue trend across the year.
Yoga Wellness Studio Dashboard in Power BI
2 — Class Performance
The Class Performance page drills into the unit economics of each class type — Vinyasa, Hot Yoga, Yin, Restorative, Power Yoga, and any others your studio offers.
- Total Studio Cost by Class Type — which class formats consume the most studio overhead.
- Avg Revenue Per Class by Class Type — the highest-yielding session formats per single run.
- Total Attendees and Total Classes by Class Type — combined demand and supply view, exposing where to add or cut capacity.
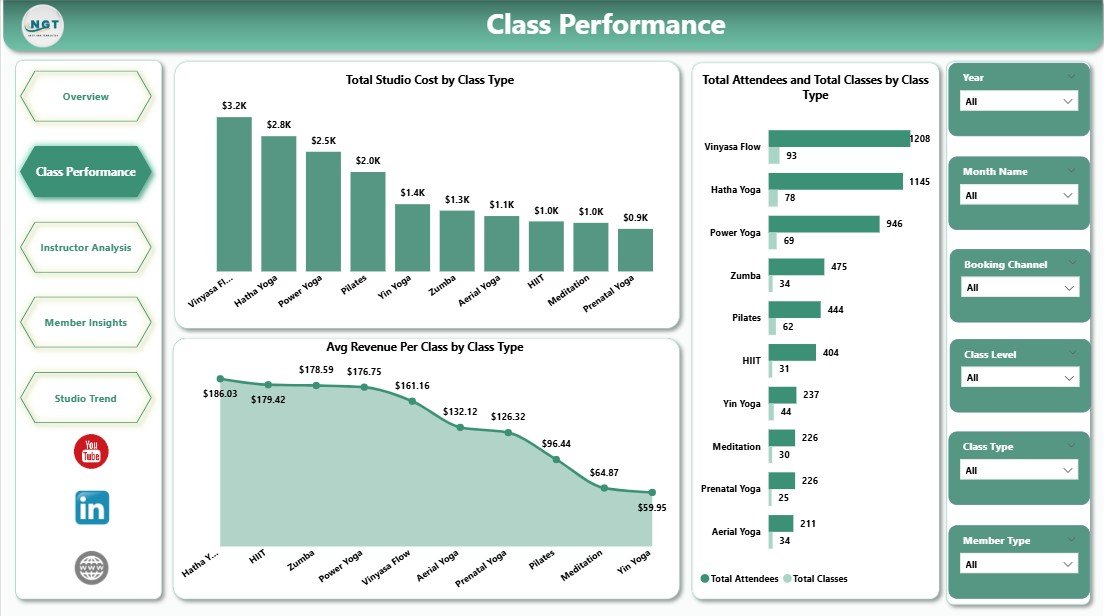
Class Performance
3 — Instructor Analysis
The Instructor Analysis page compares teachers on three axes — satisfaction, cost, and workload.
- Avg Satisfaction by Instructor — surfaces top-rated instructors based on member feedback.
- Total Instructor Cost by Instructor — total payroll spend per instructor over the period.
- Total Classes by Instructor — teaching workload distribution, helping balance scheduling.
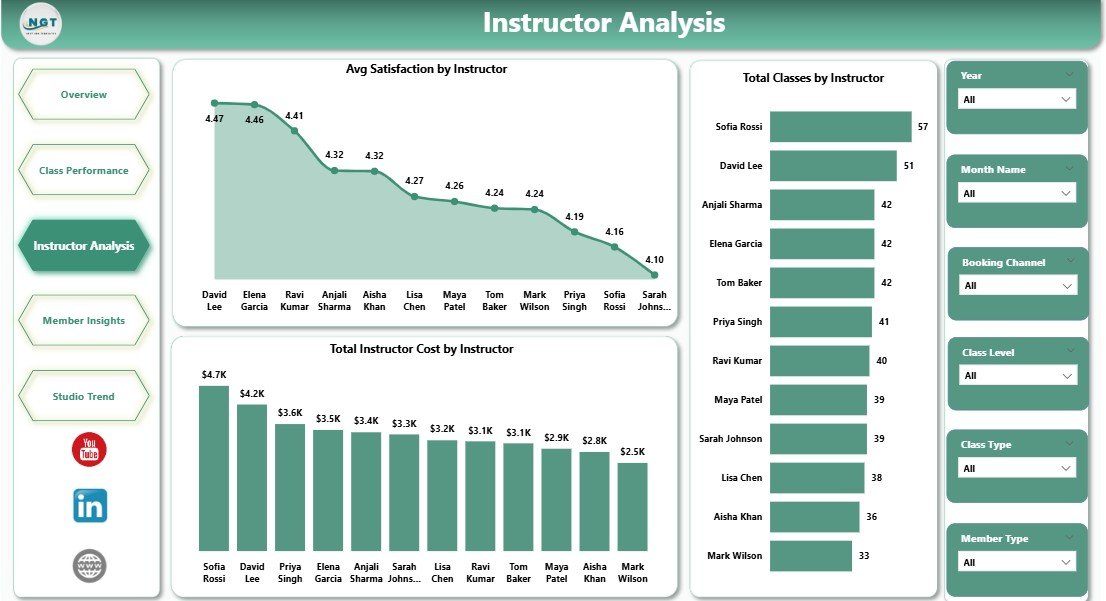
Instructor Analysis
4 — Member Insights
The Member Insights page tells you who’s booking and through which channel.
- Total Classes by Booking Channel — booking volume via app, website, walk-in, and partner channels.
- Avg Revenue Per Class by Member Type — drop-in vs monthly vs annual revenue per session.
- Profit Margin by Studio Location — which location returns the highest margin after all costs.
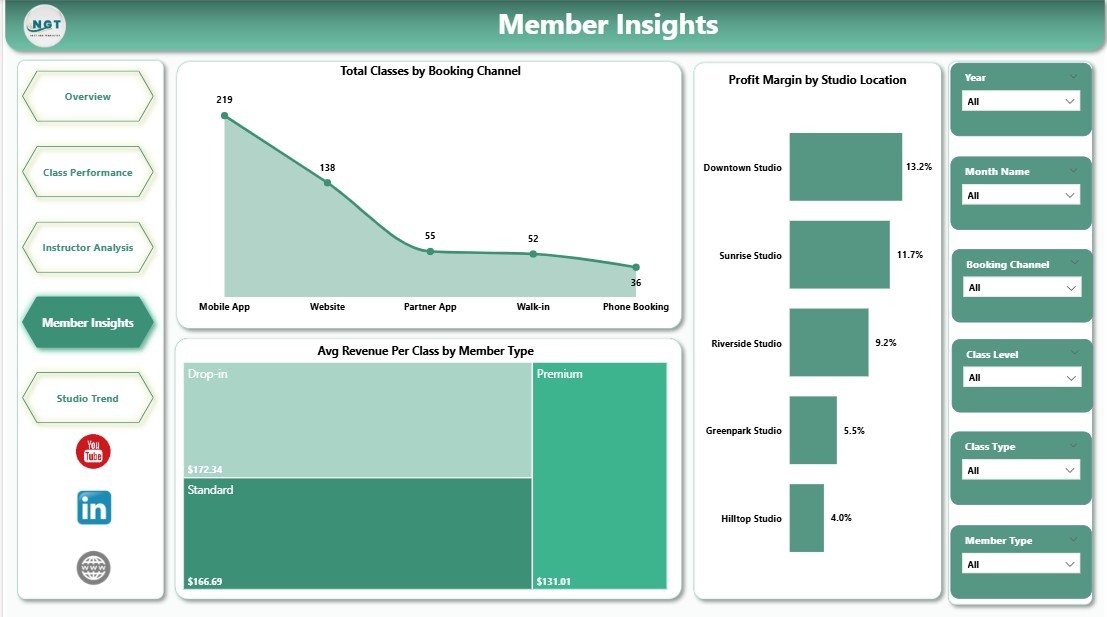
Member Insights
5 — Studio Trend
The Studio Trend page is the long-range view — perfect for board reviews and annual planning.
- Total Attendees by Month Name — month-over-month attendance trend.
- Total Revenue by Year — year-over-year revenue comparison.
- Total Capacity by Studio Location — utilization view for each location.
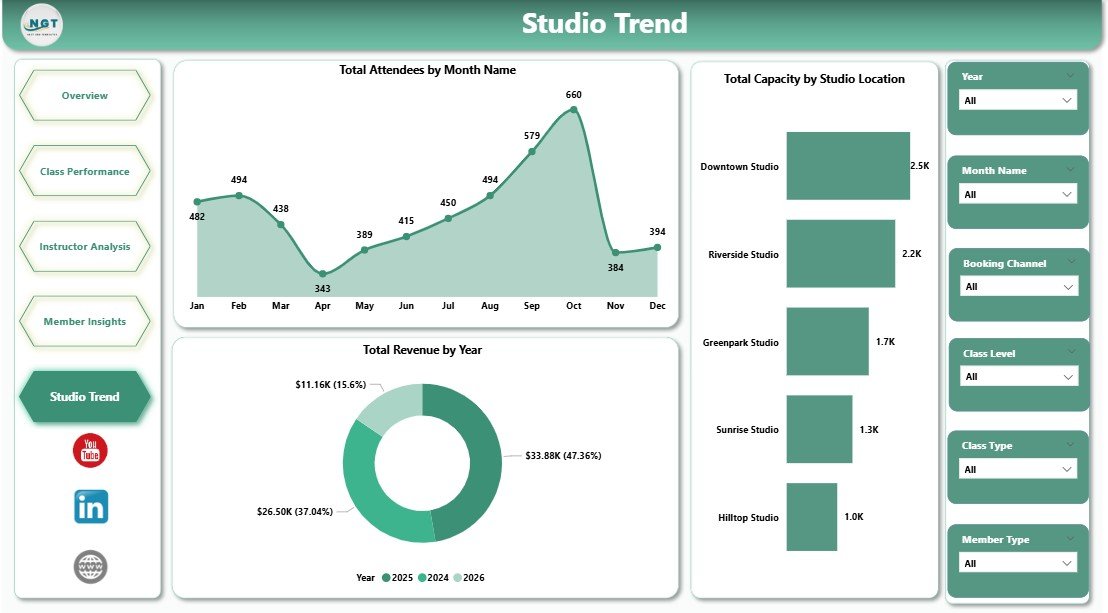
Studio Trend
Yoga Wellness Studio Dashboard vs. Tableau / Qlik vs. Mindbody / Glofox — Feature Comparison
| Feature | Yoga Wellness Studio Dashboard in Power BI | Tableau / Qlik Equivalent | Mindbody / Glofox / Vagaro |
|---|---|---|---|
| Cost | $17.99 one-time | $70 / user / month | $129–$499 / month per location |
| Platform | Power BI Desktop (free) | Tableau / Qlik Sense | Cloud SaaS booking + reporting |
| Setup time | Under 10 minutes ✅ | 2–5 days of data modeling | 1–4 weeks onboarding |
| Customizable visuals & DAX | Full edit access ✅ | ✅ | Limited — vendor-controlled |
| Multi-location slicer | Built-in ✅ | Build it yourself | ✅ (per-location subscription) |
| Instructor satisfaction analysis | Pre-built page ✅ | Build from scratch | Limited / paid add-on |
| Booking channel analysis | Pre-built visual ✅ | Build from scratch | ✅ |
| Year-1 cost at 5 users | $17.99 total ✅ | $4,200 | $1,548–$5,988 |
| Recurring fee | None ✅ | Yes | Yes |
For yoga and wellness studios that want full Power BI analytics on revenue, instructors, and members without paying for a Mindbody-tier reporting subscription, the Yoga Wellness Studio Dashboard in Power BI sits in the sweet spot.
Who Should Use This Template
✅ Perfect for:
- Yoga and wellness studio owners running 1–5 locations who want a one-screen revenue and cost view
- Studio managers who already export class logs from Mindbody, Glofox, Vagaro, or a custom booking system
- Operations leads comparing instructor cost-to-satisfaction
- Boutique fitness chains tracking profit margin per location across class types
❌ Not a fit if:
- You need a live booking engine — this is reporting-only, not a Mindbody replacement
- You’re an enterprise franchise needing row-level security, AAD integration, and audit logs across 50+ locations
- You don’t want to install Power BI Desktop (free from Microsoft)
Real-World Use Cases
Priya runs a 3-location yoga studio in Mumbai. She uses the Yoga Wellness Studio Dashboard in Power BI every Monday morning to compare revenue and profit margin across all three locations. The Class Performance page told her that Hot Yoga sessions had 40% higher revenue per class than Yin — so she added two more Hot Yoga slots per week and cut one underperforming Yin class.
Marcus manages a wellness chain in Austin. His Instructor Analysis page revealed that two of his most-booked instructors had the lowest satisfaction scores. He used the data to schedule shadowing sessions with top-rated instructors instead of cutting them — retention improved within a quarter without losing experienced staff.
Lena opened her first solo studio in Berlin. She uses the Member Insights page to compare booking channels every month — she discovered her partner-app channel was driving 60% of new sign-ups, so she renegotiated commission terms before her contract renewal and reduced channel cost by 18%.
Advantages of the Yoga Wellness Studio Dashboard in Power BI
🔹 One-time cost vs SaaS subscriptions — at $17.99, this is one weekend coffee budget compared to $129–$499/month for Mindbody-tier reporting.
🔹 Slicer-driven filtering replaces 5+ custom reports — instead of building separate reports for each location and class type, slicers filter the entire dashboard instantly.
🔹 Editable .pbix file means you can add KPIs your business uses (member churn, retention rate, lifetime value) in DAX without paying a consultant.
🔹 Compatible with any class log — Mindbody, Glofox, Vagaro, MarianaTek, or your custom booking platform’s CSV export.
🔹 Instructor and member-type analysis are usually paid add-ons in SaaS reporting — here they’re standard pages.
Opportunities for Improvement
The Yoga Wellness Studio Dashboard in Power BI is a reporting layer, not a booking engine — so it can’t replace Mindbody or Glofox for class registration, payments, and member check-in. Studios should keep their booking platform and use this dashboard alongside it, refreshing the data weekly or monthly. The template also doesn’t include built-in row-level security; multi-franchise networks needing per-location access controls will need to publish to Power BI Service and configure RLS using Power BI’s standard row-level security guidance.
Best Practices
🔹 Refresh the dataset weekly so trend charts stay current — most booking systems can auto-export to a shared OneDrive or Google Drive folder.
🔹 Use the Instructor Analysis page in 1:1 instructor reviews — not as a punitive tool, but as a data-backed conversation about workload and member feedback.
🔹 Save filtered views as bookmarks in Power BI for repeat questions (“show me last month’s Hot Yoga performance at the downtown location” becomes a one-click view).
🔹 Pair this Power BI dashboard with the Excel or Google Sheets companion for instructor self-service — many small studios prefer to give instructors read-only Excel access rather than Power BI logins.
Explore Relevant Templates
- Yoga & Wellness Studio Dashboard in Excel — same KPIs, Excel version (also available as a detailed blog post).
- Salon and Spa Dashboard in Power BI — sister template for spa, beauty, and wellness chains.
- B&B Dashboard in Power BI — same Power BI architecture for hospitality service businesses (blog walkthrough).
- Coaching Business Dashboard in Power BI — for solo coaches and instructor-led businesses.
- Fitness Studios KPI Dashboard in Excel — KPI-scorecard variant for fitness operations.
- Browse the full Power BI Dashboard collection on NextGenTemplates.
Frequently Asked Questions
What KPIs does the Yoga Wellness Studio Dashboard in Power BI track?
The Yoga Wellness Studio Dashboard in Power BI tracks 5 KPI cards on the Overview — Total Revenue, Total Studio Cost, Total Instructor Cost, Total Equipment Cost, and Total Attendees — plus 16 supporting charts across Class Performance, Instructor Analysis, Member Insights, and Studio Trend.
Do I need a paid Power BI subscription?
No. The Yoga Wellness Studio Dashboard in Power BI runs in Power BI Desktop (free from Microsoft). You only need a Power BI Pro license if you want to publish the report to Power BI Service for online sharing with team members.
How long does setup take?
Under 10 minutes for most studios. Open the .pbix file, repoint the data source to your class log export, match the column names to the template’s data model, and click Refresh. Every chart, slicer, and KPI card updates automatically — no DAX edits required for first-time use.
How does this compare to Mindbody or Glofox built-in reporting?
Mindbody and Glofox are full booking platforms with built-in reporting at $129–$499 per month per location. The Yoga Wellness Studio Dashboard in Power BI is a one-time $17.99 reporting layer that connects to any booking system’s data export — it’s the right choice when you want deeper analytics without paying enterprise SaaS pricing for reporting alone.
Can I customize visuals and add my own KPIs?
Yes. The .pbix file is fully editable in Power BI Desktop. You can change colors, add new DAX measures (member churn, lifetime value, retention rate), swap visuals, add pages, and connect additional data sources without restrictions or vendor lock-in.
Does it work with Mindbody, Glofox, Vagaro, or my custom booking system?
Yes. The Yoga Wellness Studio Dashboard in Power BI accepts any class log exported as CSV or Excel. Mindbody, Glofox, Vagaro, MarianaTek, and most custom booking systems all support data exports that can feed this template directly. Match the column names once and refresh thereafter.
About the Author
Built by PK — Microsoft Certified Professional with 15+ years of Excel, Google Sheets, and Power BI experience. Founder of NextGenTemplates, reaching 300K+ subscribers across YouTube channels (@PK-AnExcelExpert, @NextGenTemplates, @NeoTechNavigators). Every template is hand-built and tested before release.
Conclusion
The Yoga Wellness Studio Dashboard in Power BI gives yoga and wellness studio owners the operational analytics layer their booking platform doesn’t offer at any price they want to pay. Five pages, sixteen charts, slicer-driven filtering — and a single .pbix you can open in Power BI Desktop in under 10 minutes.
👉 Click here to Purchase the Yoga Wellness Studio Dashboard in Power BI on NextGenTemplates
✅ Instant download · One-time payment · No subscription · Lifetime access
🎥 Visit our YouTube channel for step-by-step tutorials: YouTube.com/@PK-AnExcelExpert
📅 Last updated: April 2026