The global peer-to-peer lending market grew to over $83 billion in 2024, and P2P platforms now manage thousands of active loans with dozens of performance indicators to track monthly. Without a structured KPI tracking system, lending managers spend 5-8 hours per month manually compiling performance reports from scattered spreadsheets — time that could go toward borrower risk assessment and portfolio optimization.
The Peer-to-Peer Lending KPI Dashboard in Excel solves this by consolidating all your lending KPIs into a single 7-worksheet template with month-over-month filtering, MTD and YTD comparisons against targets and previous year, and conditional formatting arrows that flag variance at a glance. It is a ready-to-use template that works on Excel for Windows, Mac, and Excel Online.
Click here to Purchase Peer-to-Peer Lending KPI Dashboard in Excel
Key Features of Peer-to-Peer Lending KPI Dashboard in Excel
This Excel KPI Dashboard tracks any lending performance metric you define — from loan origination volume and borrower default rates to net interest margins and investor return percentages. Here are the core capabilities:
- Month-Selectable Dashboard — A single dropdown on range D3 recalculates the entire dashboard for any selected month, showing MTD Actual, Target, and Previous Year numbers alongside their YTD equivalents.
- Conditional Formatting Arrows — Automatic up/down indicators show whether each KPI is performing above or below both Target and Previous Year benchmarks. No manual formatting needed.
- KPI Trend Analysis Page — Select any individual KPI from a dropdown to see its group classification, measurement unit, type (Lower the Better or Upper the Better), formula, definition, and separate MTD + YTD trend charts plotting Actual vs. Target vs. PY.
- Three Dedicated Input Sheets — Separate worksheets for Actual numbers, Target numbers, and Previous Year data keep your inputs organized. The first month of the fiscal year can be set on range E1 for flexible calendar alignment.
- Central KPI Definition Sheet — Define each KPI’s name, group, unit, formula, description, and LTB/UTB type in one place. The dashboard, trend page, and all calculations reference this sheet automatically.
- Home Navigation Page — Six buttons link directly to each worksheet for fast navigation, especially useful when presenting to stakeholders during review meetings.
Dashboard Pages Explanation
Click here to Purchase Peer-to-Peer Lending KPI Dashboard in Excel
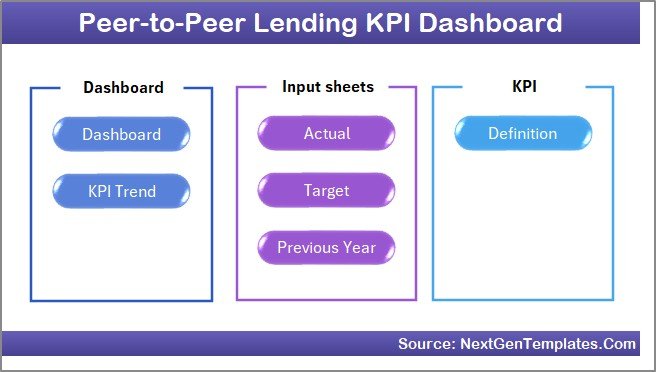
The Peer-to-Peer Lending KPI Dashboard in Excel includes 7 worksheets, each serving a specific function in the KPI tracking workflow:
1. Home Sheet
This is the navigation hub. It contains 6 clickable buttons that jump directly to the Dashboard, KPI Trend, Actual Input, Target Input, Previous Year, and KPI Definition sheets. It acts as a table of contents for the entire workbook.
 Home Page
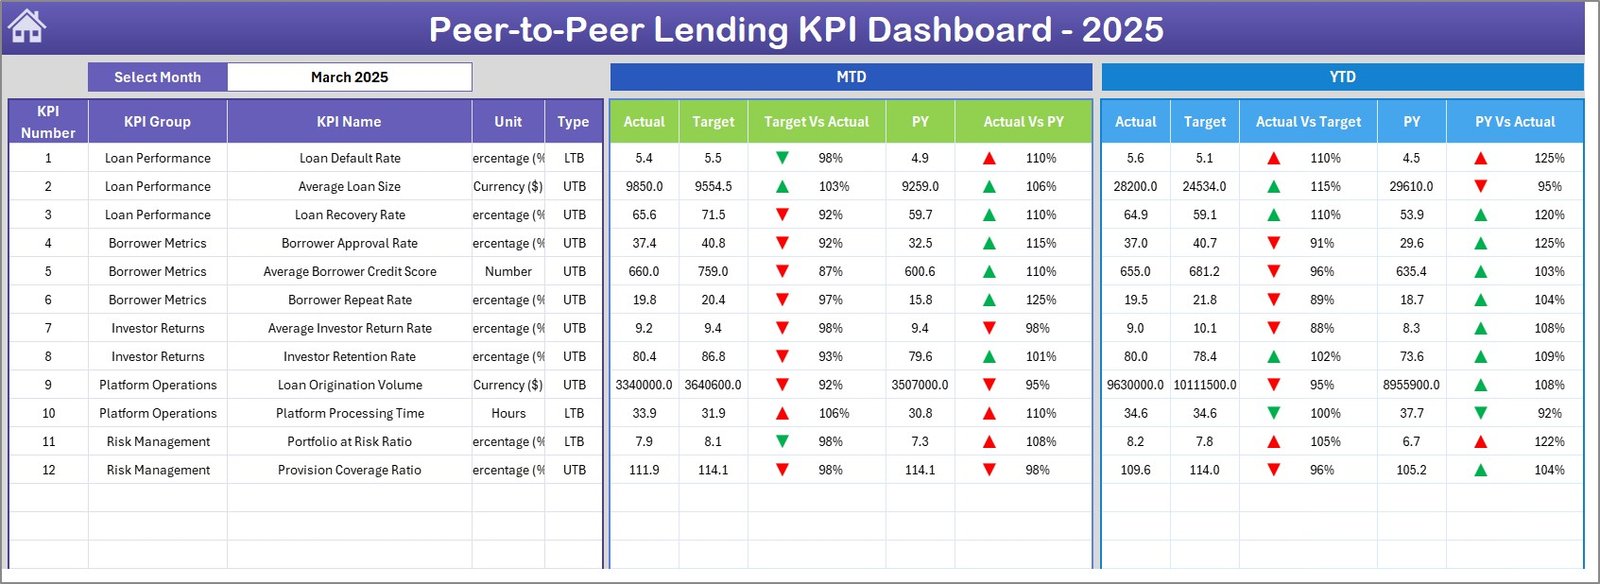
2. Dashboard Sheet
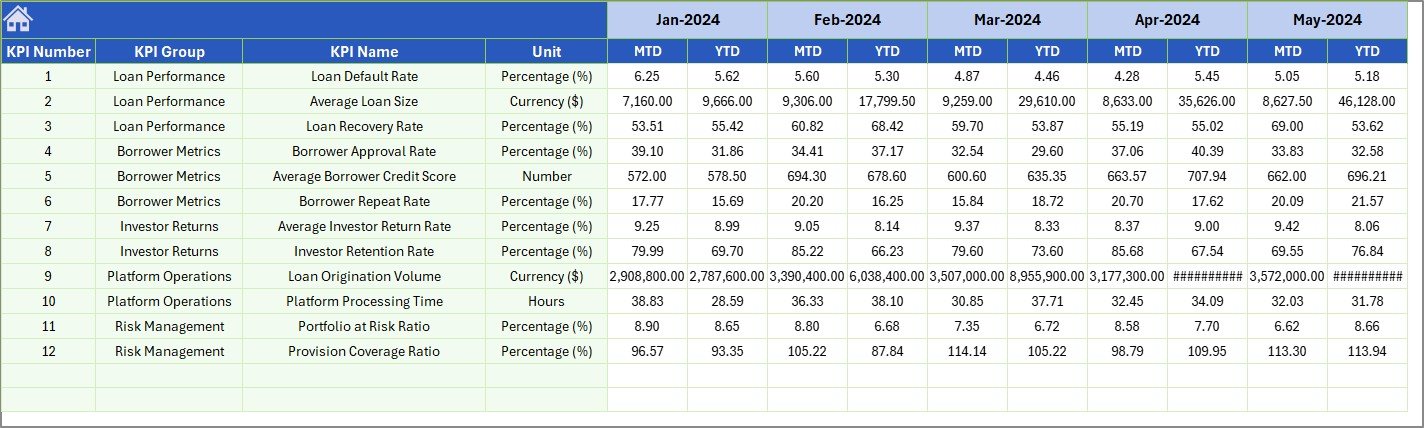
The primary analytics view. Select a month from the dropdown on range D3 and the sheet displays every KPI with MTD Actual, Target, Previous Year values and YTD Actual, Target, Previous Year values. Two variance columns — Target vs Actual and PY vs Actual — use conditional formatting arrows (green up, red down) to flag performance at a glance.
Peer-to-Peer Lending KPI Dashboard3. KPI Trend Sheet
Select any KPI from the dropdown on range C3. The sheet shows the KPI Group, Unit, Type (LTB or UTB), Formula, and Definition. Below that, two trend charts display MTD and YTD performance lines for Actual, Target, and Previous Year across all 12 months — ideal for spotting seasonal patterns in borrower behavior or investor activity.
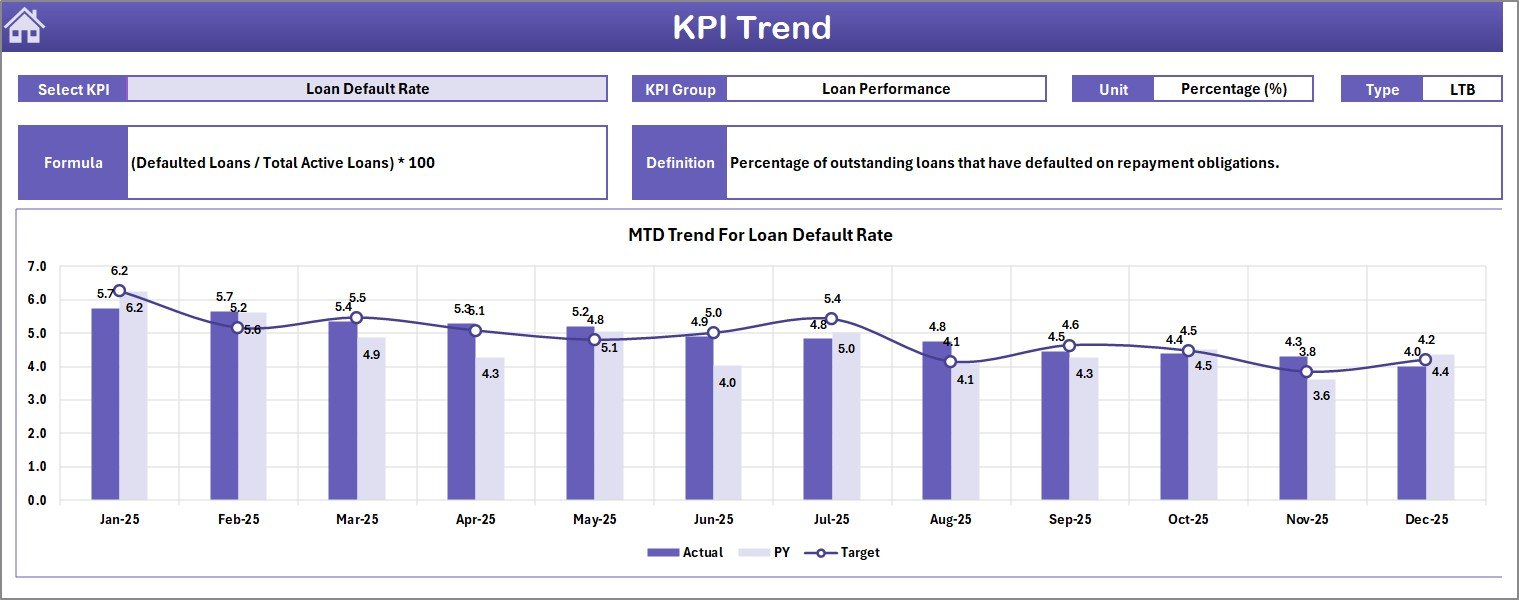 KPI Trend Sheet
4. Actual Numbers Input Sheet
Enter your real lending performance data here. Each KPI has a row, with columns for each month’s MTD and YTD values. Change the fiscal year start month on range E1 to align with your organization’s reporting period.
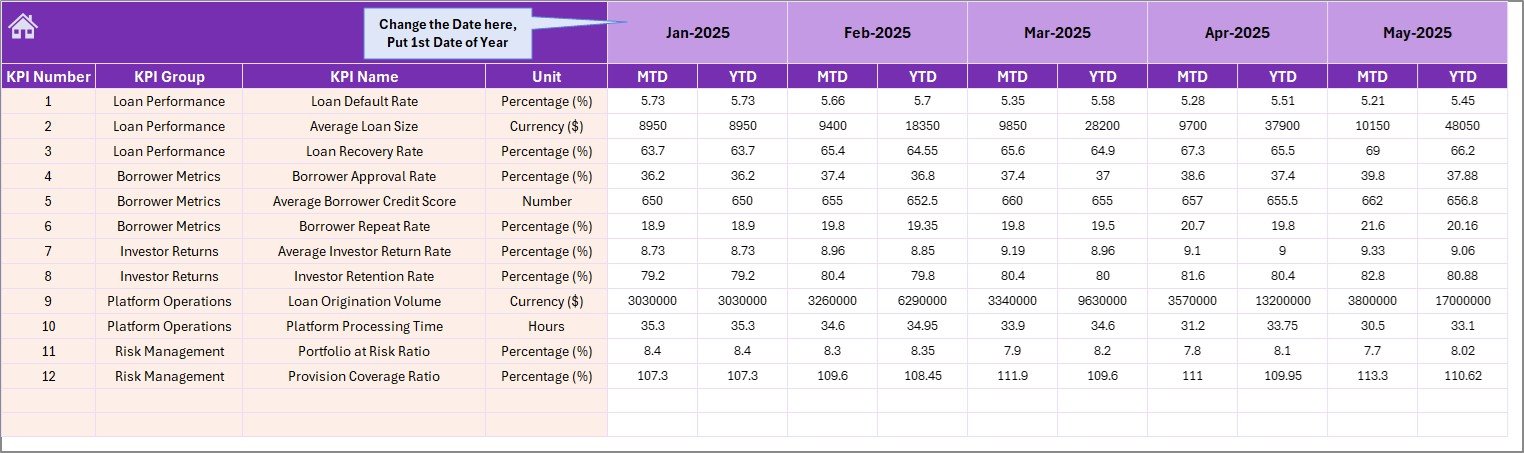 Actual Numbers Input Sheet
5. Target Number Input Sheet
Enter the planned targets for each KPI by month, both MTD and YTD. These targets feed directly into the Dashboard sheet’s variance calculations and the KPI Trend sheet’s target comparison lines.
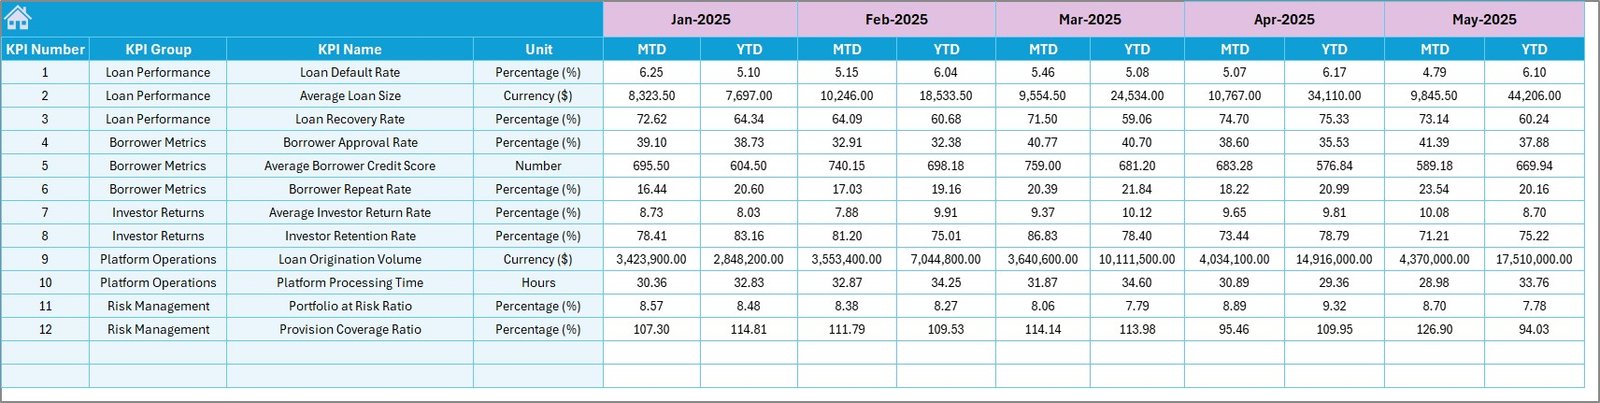 Target Number Input Sheet
6. Previous Year Number Sheet
Enter the same KPI data from the previous year. This sheet enables year-over-year comparison on the Dashboard and provides the PY trend line on the KPI Trend sheet. Structure mirrors the Actual sheet for consistency.
 Previous Year Number Input Sheet
7. KPI Definition Sheet
This is the configuration backbone. Enter each KPI’s Name, Group, Unit of measurement, Formula, detailed Definition, and Type — either LTB (Lower the Better, such as default rate) or UTB (Upper the Better, such as loan origination volume). Every other sheet in the workbook references this table.
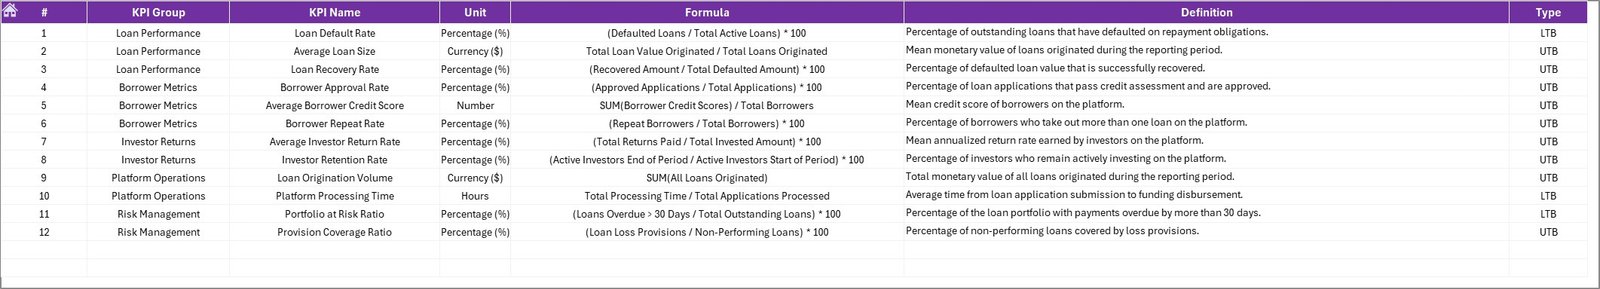 KPI Definition Sheet
Peer-to-Peer Lending KPI Dashboard vs. Google Sheets Equivalent vs. Paid SaaS — Feature Comparison
| Feature | Peer-to-Peer Lending KPI Dashboard in Excel | Google Sheets Lending Template | LendingClub / Prosper Analytics |
|---|---|---|---|
| Cost | $14.99 one-time | Free–$30 one-time | $50–200 / month |
| Platform | Microsoft Excel (desktop + web) | Google Sheets (browser) | Proprietary web app |
| Setup Time | Under 10 minutes | 15–30 minutes | 1–3 days onboarding |
| Real-Time Team Collaboration | Via SharePoint / OneDrive | ✅ Built-in | ✅ Built-in |
| Mobile Access | Excel mobile app | ✅ Google Sheets app | ✅ Responsive web |
| Customizable KPIs | ✅ Fully editable formulas + definitions | Limited formula support | Fixed KPI set |
| Offline Access | ✅ Full offline | Limited offline | ❌ Online only |
| Year-1 Cost (5 Users) | $14.99 total | $0–30 total | $3,000–12,000 |
| YoY + MTD/YTD Comparisons | ✅ Built-in with PY sheet | Manual setup | ✅ Automated |
For lending teams that want structured KPI tracking with year-over-year trends without paying monthly SaaS fees, the Peer-to-Peer Lending KPI Dashboard in Excel sits in the sweet spot.
Who Should Use This Template
Perfect for:
- P2P lending platform managers tracking loan origination, default rates, and investor returns across monthly cycles
- Finance teams at lending companies needing structured monthly and yearly KPI reviews
- Fintech consultants preparing client-facing lending performance reports
- Startup founders monitoring lending unit economics without paying for dedicated analytics platforms
Not a fit if:
- You need real-time API-integrated dashboards pulling live data from your lending platform
- Your organization requires automated regulatory compliance reporting with audit trails
- You work exclusively in Google Sheets — check the Banking KPI Scorecard in Google Sheets instead
Real-World Use Cases
Click here to Purchase Peer-to-Peer Lending KPI Dashboard in Excel
Ravi manages lending operations at a mid-sized P2P startup in Mumbai. He tracks monthly loan origination volume, borrower default rates, and net interest margins using this dashboard. Each month he updates the Actual sheet, and the Dashboard auto-generates the variance report he presents to the board — cutting 4 hours of manual spreadsheet work to 15 minutes. He explored other options like the Microfinance Institutions KPI Dashboard in Excel before choosing this one for its P2P-specific KPI flexibility.
Jessica is a fintech consultant advising three P2P platforms in the US. She duplicates this template for each client, customizes the KPI definitions to match each platform’s lending model, and delivers polished monthly reviews. The YTD trend charts help her clients spot seasonal patterns in borrower demand and adjust their risk appetite accordingly.
Thomas leads investor relations at a European P2P lending firm. He uses the Previous Year comparison feature to build year-over-year investor reports. The conditional formatting arrows give board members an instant visual read on which metrics are improving. He also uses the Crowdfunding Platforms KPI Dashboard in Excel for the firm’s crowdfunding vertical.
Advantages of Peer-to-Peer Lending KPI Dashboard in Excel
Click here to Purchase Peer-to-Peer Lending KPI Dashboard in Excel
- $14.99 one-time vs. $600–2,400/year SaaS costs — For a 5-person lending team, this template pays for itself within the first day compared to monthly analytics subscriptions.
- Full KPI customization — Unlike fixed-metric platforms, you define exactly which KPIs to track, how they’re calculated, and whether they’re LTB or UTB. The template adapts to your lending model, not the other way around.
- Three-way comparison (Actual vs. Target vs. PY) — Most free templates only compare actual to target. This dashboard adds year-over-year comparison as a built-in feature, giving deeper context for performance trends.
- Works offline and on any device — Excel runs locally on Windows and Mac without internet. Share via OneDrive or SharePoint when team collaboration is needed. Learn more about Excel formulas at Microsoft Excel Support.
- 10-minute setup — No coding, no integrations, no onboarding calls. Define KPIs, enter data, and the dashboard works immediately.
Opportunities for Improvement
- Manual data entry — This template requires you to input numbers manually each month. It does not pull data automatically from lending platforms or APIs. For teams processing thousands of loans daily, consider supplementing with a data pipeline that exports to Excel format.
- No multi-currency support — The template uses a single currency format. International P2P platforms operating across multiple currencies would need to standardize numbers before entry.
- Static charts — The trend charts update based on data but are standard Excel charts, not interactive dashboards with drill-down capabilities. For interactive analytics, explore the Fintech Dashboard in Power BI.
Best Practices
Click here to Purchase Peer-to-Peer Lending KPI Dashboard in Excel
- Update the Actual sheet on the same day each month — Consistency in data entry timing ensures accurate month-over-month trends and avoids partial-month distortions.
- Start with 8-12 KPIs — Avoid the temptation to track 30+ metrics. Focus on the indicators that directly impact loan performance, investor satisfaction, and operational efficiency.
- Use the LTB/UTB classification intentionally — Correctly flagging KPIs as Lower the Better (like default rate) or Upper the Better (like loan origination volume) ensures the conditional formatting arrows point in the right direction.
- Archive each year’s workbook — At year-end, save a copy of the completed dashboard and start fresh for the new year, moving current-year data to the Previous Year sheet.
- Present using the KPI Trend sheet — During board meetings or investor calls, use the individual KPI trend view to walk through each metric’s 12-month trajectory instead of showing the full dashboard grid.
Explore Relevant Templates
Looking for more finance and lending dashboard templates? Check these out:
- Microfinance Institutions KPI Dashboard in Excel — Same KPI framework adapted for microfinance lending operations.
- Crowdfunding Platforms KPI Dashboard in Excel — Track campaign performance and investor engagement metrics.
- Fintech Dashboard in Power BI — Interactive fintech analytics with drill-down visuals for larger datasets.
- Mortgage Lenders Dashboard in Power BI — Mortgage-specific analytics with Power BI interactivity.
- Banking KPI Scorecard in Google Sheets — Banking KPI tracking for Google Sheets users.
Frequently Asked Questions
Click here to Purchase Peer-to-Peer Lending KPI Dashboard in Excel
What KPIs does the Peer-to-Peer Lending KPI Dashboard track?
The Peer-to-Peer Lending KPI Dashboard in Excel tracks any lending KPI you define — loan origination volume, default rate, net interest margin, borrower acquisition cost, investor returns, and more. You configure all KPIs in the KPI Definition sheet with custom names, formulas, and LTB/UTB classification.
Can I customize the KPIs in this dashboard?
Yes. The KPI Definition sheet lets you add, remove, or rename any KPI. You define the group, unit, formula, definition, and type (Lower the Better or Upper the Better). The dashboard and trend charts update automatically based on your definitions.
How does this compare to paid lending analytics platforms?
Paid platforms like LendingClub Analytics charge $50–200 per month and lock you into fixed metrics. This Excel template costs $14.99 one-time, gives you full KPI customization, works offline, and handles MTD, YTD, and year-over-year tracking without recurring fees.
Does this template work with Excel for Mac?
Yes. The Peer-to-Peer Lending KPI Dashboard uses standard Excel formulas, conditional formatting, and charts — no VBA or macros required. It works on Excel for Windows, Mac, and Excel Online through OneDrive or SharePoint.
How long does setup take?
Initial setup takes under 10 minutes. Define your KPIs in the Definition sheet, enter your first month of targets and actuals, and the dashboard generates your lending performance view immediately. No coding or technical skills needed.
Can I set a custom fiscal year start month?
Yes. On the Actual Numbers Input sheet, range E1 lets you set the first month of your fiscal year. The dashboard adjusts all MTD and YTD calculations to align with your organization’s reporting calendar.
Is this template suitable for microfinance or mortgage lending?
The KPI structure is fully customizable, so it adapts to any lending model — P2P, microfinance, mortgage, or consumer lending. For specialized microfinance tracking, also check the Microfinance Institutions Dashboard in Excel.
About the Author
Built by PK — Microsoft Certified Professional with 15+ years of Excel, Google Sheets, and Power BI experience. Founder of NextGenTemplates, reaching 300K+ subscribers across YouTube channels. Every template is hand-built and tested before release.
Conclusion
The Peer-to-Peer Lending KPI Dashboard in Excel gives lending teams a structured, customizable way to track performance without monthly SaaS costs. With 7 worksheets covering navigation, analytics, trend analysis, data input (actual, target, and previous year), and KPI configuration — the template covers the full KPI management workflow in a single Excel file.
Click here to Purchase Peer-to-Peer Lending KPI Dashboard in Excel
✅ Instant download · One-time payment · No subscription
Visit our YouTube channel for step-by-step tutorials: Youtube.com/@PK-AnExcelExpert
📅 Last updated: April 2026