Managing operations efficiently requires clear visibility into performance metrics, quick decision-making, and accurate reporting. That’s where the Operations KPI Scorecard in Excel comes in. It transforms scattered data into an actionable dashboard that helps you monitor progress, identify gaps, and improve operational outcomes in real time.
This article explores everything you need to know about the Operations KPI Scorecard in Excel — from its features and structure to its benefits and best practices. Whether you are an operations manager, data analyst, or business owner, this guide will help you understand how to build, use, and optimize your KPI scorecard effectively.
Click to Purchases Operations KPI Scorecard in Excel
What Is an Operations KPI Scorecard in Excel?
An Operations KPI Scorecard in Excel is a structured tool that tracks and evaluates key performance indicators (KPIs) across various areas of business operations. It helps you visualize performance trends, compare results with targets, and analyze progress on a monthly or yearly basis.
Excel serves as an ideal platform for building such a scorecard because it offers flexibility, automation, and powerful visualization features without requiring expensive software. You can easily customize the scorecard to suit your organization’s needs — whether you want to track production efficiency, cost control, logistics performance, or service quality.
Why Operations Teams Need a KPI Scorecard
Operations teams deal with multiple moving parts — supply chains, production lines, quality checks, and workforce efficiency. Without a proper measurement system, it’s impossible to know which areas need improvement. A KPI scorecard offers a single view of operational health by consolidating all KPIs in one place.
Here’s why every operations team needs a KPI scorecard:
📊 Real-time visibility – Monitor performance trends daily, weekly, or monthly.
🎯 Target alignment – Ensure teams are meeting operational goals.
🕒 Time efficiency – Save time spent on manual reporting and analysis.
🚀 Performance improvement – Identify bottlenecks and address them quickly.
💡 Data-driven insights – Make informed decisions backed by accurate data.
In short, the scorecard turns operational data into actionable intelligence.
Structure of the Operations KPI Scorecard Template
The Operations KPI Scorecard in Excel is built with four main worksheet tabs — each serving a unique purpose. Together, they form a complete system for KPI tracking and performance evaluation.
Scorecard Sheet – The Main Dashboard

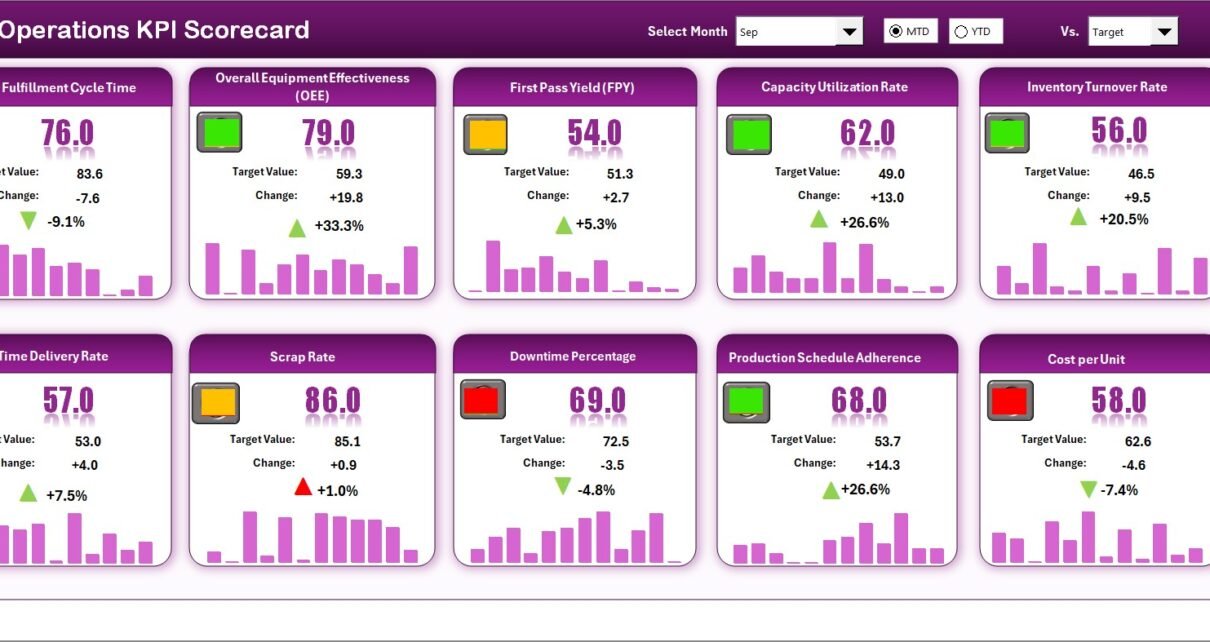
The Scorecard sheet is the core of this tool. It provides a dynamic and interactive dashboard that displays operational performance for the selected period.
Key features include:
🧭 Dropdown Menus: Choose between Month-to-Date (MTD) and Year-to-Date (YTD) views for detailed analysis.
⚖️ Actual vs Target Comparison: Evaluate real performance against planned targets.
🎨 Visual Indicators: Use color codes and icons to instantly understand performance status (e.g., green for achieved, red for missed).
📈 Comprehensive KPI Overview: Display key details such as KPI Name, Group, Unit, Type (UTB or LTB), and monthly comparisons.
This sheet helps you monitor all your KPIs in one place, ensuring no area goes unnoticed.
KPI Trend Sheet – Performance Tracking Over Time

The KPI Trend sheet enables detailed tracking of KPI behavior over time. It helps you understand whether performance is improving, declining, or remaining stable.
Click to Purchases Operations KPI Scorecard in Excel
Features of this sheet include:
🔽 Dropdown KPI Selection: Select any KPI name from the dropdown list (cell C3) to display its details.
🧩 KPI Details: The sheet shows KPI Group, Unit, Type (Lower the Better or Upper the Better), Formula, and Definition.
📊 MTD and YTD Charts: Visualize the monthly trends for Actual, Target, and Previous Year (PY) data.
🔍 Comparison Insights: Identify whether performance improvements are consistent or fluctuating across months.
This view provides trend analytics that guide continuous improvement and strategic decisions.
Input Data Sheet – Central Data Entry Hub

The Input Data Sheet is the foundation of your scorecard. It stores all KPI data — Actuals, Targets, and other metrics required for computation.
Key highlights:
✍️ Data Entry Made Easy: Enter KPI data for each month quickly and clearly.
🔄 Flexibility: Update values anytime new results become available.
🧾 Accuracy: Ensure the scorecard stays up-to-date, reflecting the latest operational performance.
💾 Data Validation: Use dropdowns and consistent units to maintain data integrity.
This sheet ensures that the performance scorecard always runs on reliable and current information.
KPI Definition Sheet – Your KPI Knowledge Base

The KPI Definition sheet acts as the master list of KPIs. It defines every metric used in your scorecard.
It includes columns for:
-
KPI Name
-
KPI Group
-
Unit
-
Formula
-
KPI Definition
This sheet guarantees consistency in understanding and calculating KPIs across departments.
Key KPIs You Can Track Using the Operations Scorecard
The flexibility of Excel allows you to track a wide variety of KPIs depending on your industry and goals. Below are some commonly used operational KPIs:
📦 Production KPIs
-
Production Volume
-
Machine Downtime %
-
First Pass Yield (FPY)
-
Capacity Utilization Rate
🚛 Supply Chain KPIs
-
On-Time Delivery %
-
Order Fulfillment Cycle Time
-
Inventory Turnover Ratio
-
Supplier Lead Time
🧰 Maintenance KPIs
-
Mean Time Between Failures (MTBF)
-
Maintenance Cost per Unit
-
Preventive Maintenance Compliance
💸 Cost and Efficiency KPIs
-
Cost per Unit Produced
-
Operational Expense Ratio
-
Energy Consumption per Output
👥 Workforce KPIs
-
Employee Productivity Index
-
Training Hours per Employee
-
Absenteeism Rate
Each KPI connects operational activity with measurable results, enabling better control over performance.
How the Scorecard Improves Operational Decision-Making
Click to Purchases Operations KPI Scorecard in Excel
The true power of the Operations KPI Scorecard lies in how it transforms raw data into actionable insights.
-
📈 Instant Clarity: Managers can see whether performance meets expectations within seconds.
-
📉 Problem Detection: The system highlights underperforming KPIs so teams can take corrective action early.
-
🧮 Accurate Forecasting: Historical data trends help predict future outcomes.
-
🧑💼 Strategic Alignment: Ensures operational goals align with overall business objectives.
-
💬 Performance Communication: Simplifies reporting to senior management and stakeholders.
When used consistently, the scorecard becomes a vital tool for achieving operational excellence.
How to Use the Operations KPI Scorecard in Excel
Follow these simple steps to start using your scorecard effectively:
-
Open the Excel file.
Navigate through the Home or Scorecard sheet to understand its layout. -
Go to the KPI Definition Sheet.
List all the KPIs you want to track, along with their formulas and definitions. -
Enter Data in the Input Data Sheet.
Add monthly Actuals, Targets, and Previous Year values. -
Review the Scorecard Sheet.
Use dropdowns to select your preferred month or time range. Instantly see Actual vs Target comparisons with visual indicators. -
Analyze Trends.
Switch to the KPI Trend sheet to view performance charts and interpret the direction of each KPI.
By following these steps, you’ll be able to maintain a live operational scorecard that updates automatically as new data comes in.
Advantages of Using an Operations KPI Scorecard in Excel
Implementing an Operations KPI Scorecard brings several measurable benefits to your organization.
✅ 1. Centralized Performance Tracking
You get one unified view of all operational KPIs, eliminating the need for multiple disconnected reports.
✅ 2. Real-Time Insights
Instant updates help you identify issues before they escalate, keeping your operations efficient.
✅ 3. Visual Decision Support
Charts, color codes, and dashboards make data interpretation quick and intuitive.
✅ 4. Cost-Effective Solution
Unlike expensive BI tools, Excel offers a powerful yet affordable alternative with familiar features.
✅ 5. Customization Flexibility
You can easily modify KPIs, charts, and layouts according to your operational structure.
✅ 6. Enhanced Collaboration
Departments can input and view their own KPIs, improving cross-team communication and accountability.
These advantages make the scorecard an indispensable tool for any organization seeking operational excellence.
Common Challenges in Operations Performance Management
While KPI scorecards make tracking easier, some common issues can limit their effectiveness.
Understanding these challenges helps you avoid mistakes:
-
Data Inconsistency: Inaccurate or delayed entries can distort performance results.
-
KPI Overload: Tracking too many KPIs can overwhelm users and reduce focus.
-
Lack of Ownership: If teams don’t understand KPI relevance, they may ignore updates.
-
Poor Visualization: Without clear visuals, interpreting data becomes difficult.
-
Limited Automation: Manual updates may slow down analysis.
The good news is — all these issues can be resolved through best practices.
Best Practices for the Operations KPI Scorecard in Excel
To get maximum value from your scorecard, follow these proven best practices:
🔹 1. Define Clear KPIs
Select KPIs that truly reflect business performance. Avoid vanity metrics that don’t lead to actionable insights.
🔹 2. Maintain Data Accuracy
Regularly review and validate data entries to ensure reliability.
🔹 3. Update the Scorecard Consistently
Schedule regular updates (weekly or monthly) so your scorecard always reflects current performance.
🔹 4. Use Conditional Formatting Wisely
Highlight critical values (like missed targets) with clear visual cues — green for success, red for failure, yellow for warning.
🔹 5. Keep the Dashboard Clean
Avoid clutter. Use concise charts and relevant data only.
🔹 6. Align KPIs with Organizational Goals
Make sure every KPI contributes to strategic objectives — from reducing costs to improving service quality.
🔹 7. Enable Data Protection
Protect formulas and key cells to prevent accidental edits by users.
By applying these best practices, your scorecard will remain accurate, insightful, and easy to manage.
Real-World Example of an Operations KPI Scorecard
Imagine a manufacturing company using the Operations KPI Scorecard in Excel.
They track KPIs like Production Output, Defect Rate, Energy Usage, and Delivery Timeliness.
-
The Scorecard sheet instantly shows which metrics meet or miss targets.
-
The KPI Trend sheet displays a steady improvement in energy efficiency.
-
The Input Data sheet keeps monthly data updated by team leads.
-
The KPI Definition sheet ensures consistent understanding of each metric.
Within three months, the company identifies and corrects a recurring downtime issue, improving production efficiency by 15%.
This simple Excel tool directly contributes to operational excellence.
Tips to Customize the Scorecard for Your Organization
You can personalize the scorecard to fit your organization’s needs:
-
Add department-wise slicers (e.g., Production, Logistics, Quality).
-
Include pivot charts for advanced visualization.
-
Use Excel macros or VBA for automated updates.
-
Add trend arrows or KPI ranking indicators.
-
Integrate with Power BI for deeper analytics later.
Excel’s flexibility allows endless customization — making this scorecard suitable for any industry.
Conclusion
The Operations KPI Scorecard in Excel is more than just a reporting tool — it’s a complete performance management system. It empowers organizations to track progress, analyze results, and make informed decisions with ease.
By combining structured data, visual analysis, and customizable features, this scorecard helps operations teams maintain clarity, accountability, and continuous improvement. Whether you manage a manufacturing unit, service operation, or logistics network, this Excel-based tool ensures that every metric aligns with your strategic goals.
Start building your Operations KPI Scorecard today — and take the first step toward smarter, data-driven operations.
❓ Frequently Asked Questions (FAQs)
1. What is an Operations KPI Scorecard?
It’s an Excel-based tool that tracks and visualizes key performance indicators (KPIs) to monitor and improve operational performance.
2. How is it different from a dashboard?
A scorecard focuses on comparing actual results with targets, while a dashboard provides visual summaries and trends. Both complement each other in performance management.
3. Can I add my own KPIs to this scorecard?
Yes, you can customize KPI names, formulas, and groups directly in the KPI Definition sheet.
4. How often should I update the scorecard?
Ideally, update it monthly or whenever new operational data becomes available.
5. Is this template suitable for all industries?
Absolutely. Whether you work in manufacturing, logistics, services, or finance, the scorecard can adapt to any operational structure.
6. Does it require Excel macros or coding?
No, this scorecard works without complex coding. However, you can enhance it with VBA automation if needed.
7. Can it integrate with Power BI or Google Sheets?
Yes, you can link Excel data to Power BI or import it into Google Sheets for extended analytics and collaboration.
Visit our YouTube channel to learn step-by-step video tutorials