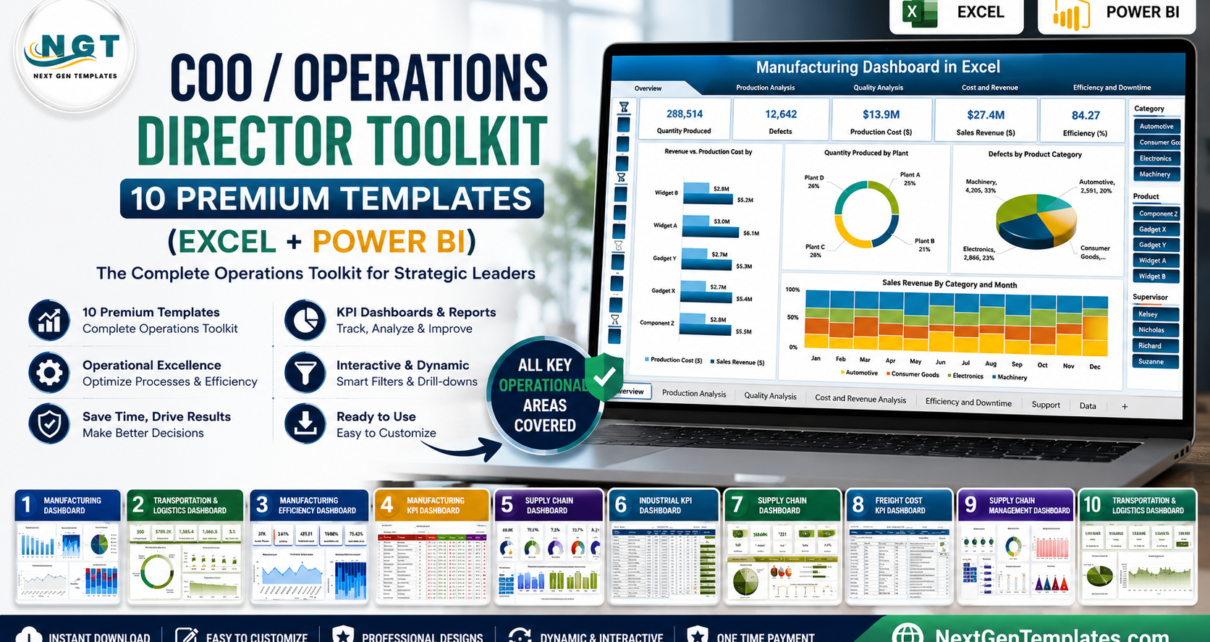
If you run operations — as a COO Operations Director Toolkit, or the plant, supply chain and logistics leaders reporting into them — your problem is rarely a lack of data. It’s that the data lives in a dozen disconnected spreadsheets. The COO / Operations Director Toolkit fixes that by bundling 10 premium dashboards across Excel and Power BI into one coordinated package covering production, supply chain, logistics, freight and operational KPIs. Bought individually these templates cost $154.90; as a toolkit they’re just $86.99 — a 44% saving of $67.91.
Explore the full catalogs any time: Excel dashboards, Excel KPI dashboards, and Power BI templates.
🚀 Get the COO / Operations Director Toolkit — 10 Templates, One Price
$154.90 $86.99 • Save $67.91 (44% off)
🔑 Key Features of the COO / Operations Director Toolkit
This isn’t a random grab-bag of spreadsheets — it’s a curated operations stack. Across the 10 templates you get full production coverage (OEE, throughput, cycle time, First Pass Yield, scrap, MTBF and MTTR), end-to-end supply chain and logistics visibility (supplier and inventory analytics, carrier scorecards, route analysis and freight cost control), and board-ready KPI scorecards with traffic-light status views for leadership reviews.
The toolkit spans two platforms on purpose: nine native Excel workbooks for offline, per-plant, no-licence use, plus a Power BI report for enterprise-grade, refreshable, multi-site sharing. Every template is plug-and-play — paste your data and each chart, slicer, KPI card and scorecard updates automatically. There are no macros, no add-ins and no subscriptions; it’s a one-time purchase with lifetime access.
📦 What’s Included in the Toolkit
Here are all ten templates, each hand-picked to give an operations leader complete visibility across the value chain.
1. Manufacturing Dashboard in Excel
A 7-page production command centre tracking OEE, throughput, downtime, quality and inventory across shifts, machines and lines. This is the anchor of the toolkit for anyone running a factory floor. View template →

2. Transportation & Logistics Dashboard in Excel
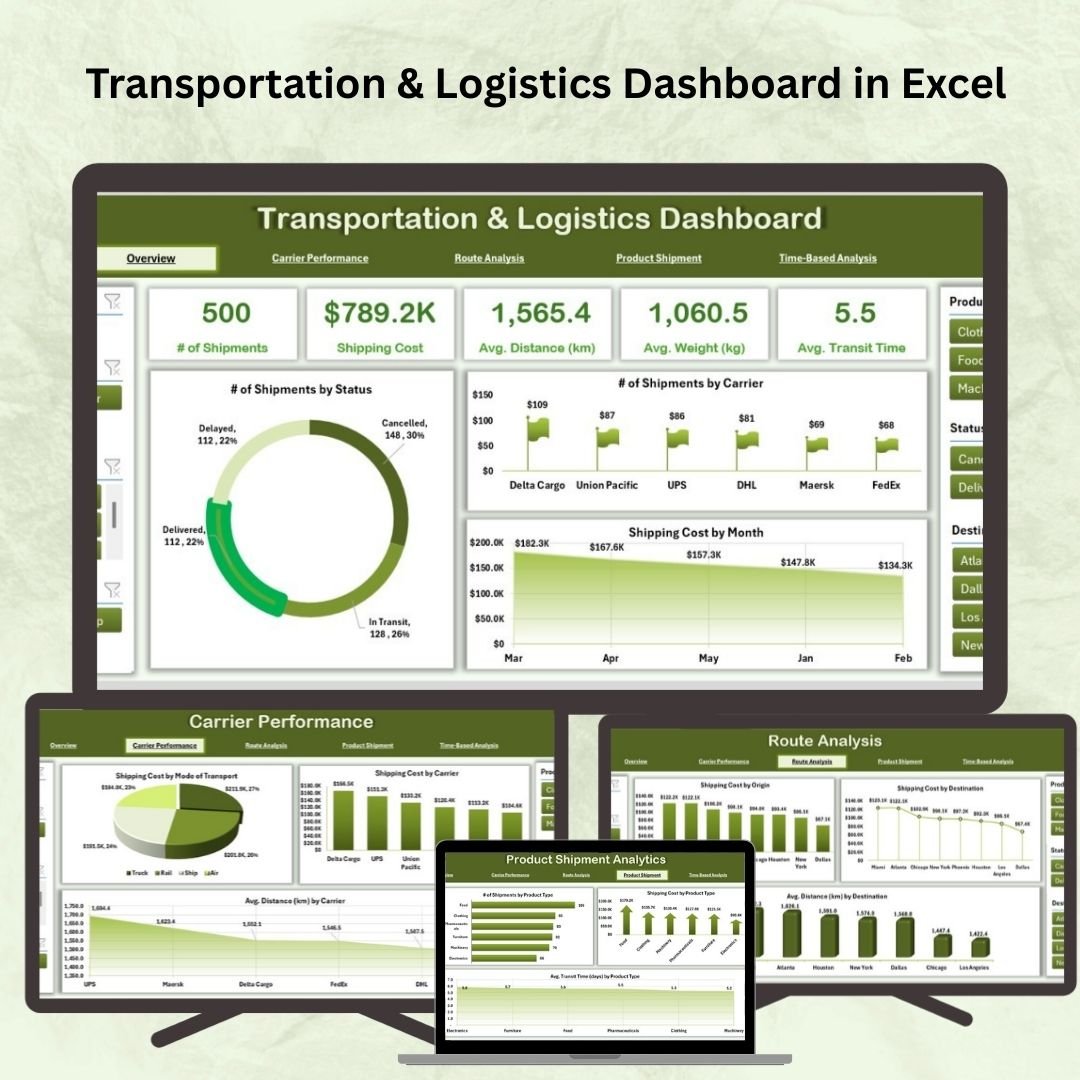
Five analytical pages covering carrier performance, route analysis, product shipments and delivery cost trends — built on PivotTables and slicers for instant filtering. View template →
3. Manufacturing Efficiency Dashboard in Power BI
The enterprise piece of the toolkit: a Power BI report for OEE and efficiency analysis with scheduled refresh and clean multi-plant sharing across teams. View template →

4. Manufacturing KPI Dashboard
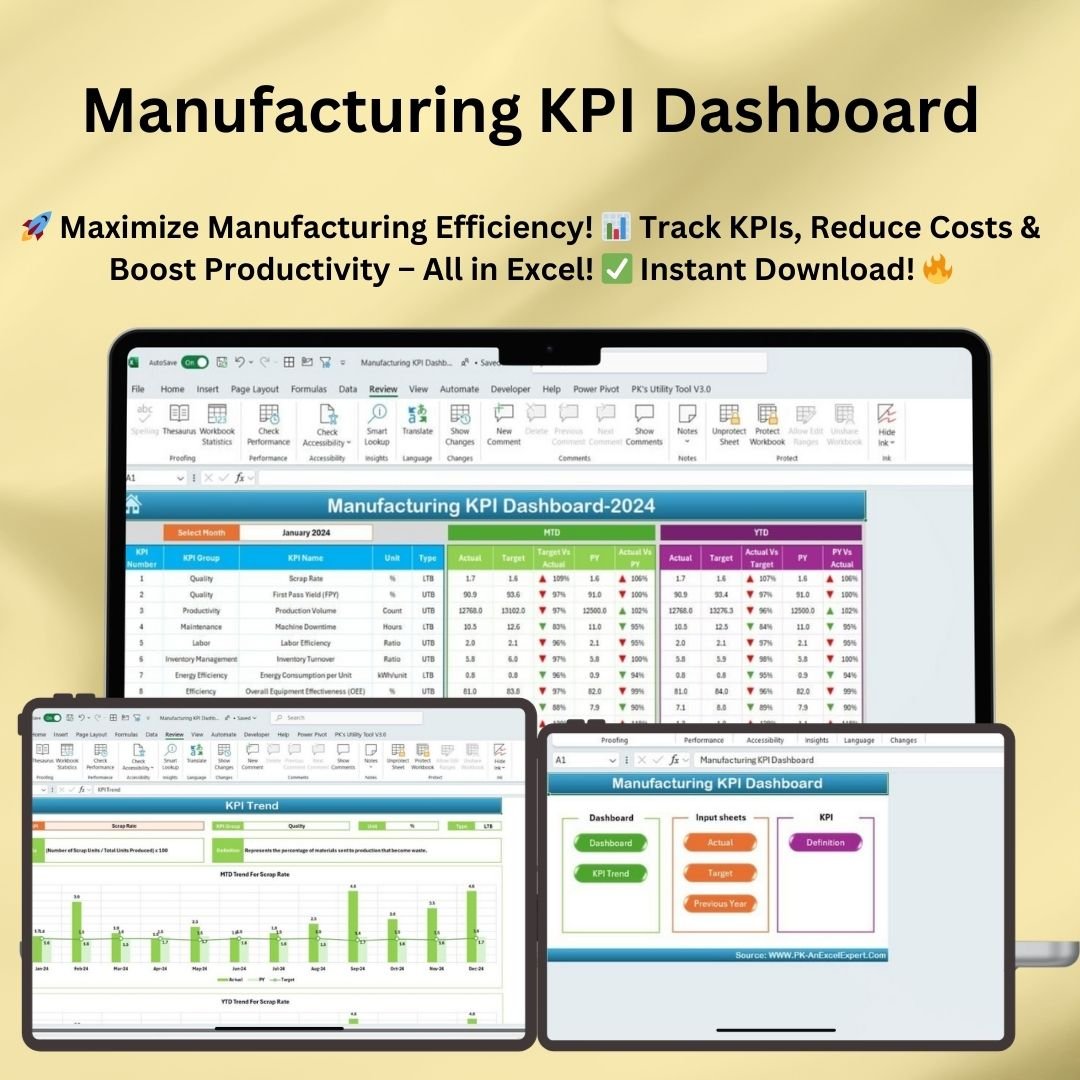
A focused Excel KPI view for fast, day-to-day production monitoring — ideal for morning standups and shift handovers. View template →
5. Supply Chain Management Dashboard in Excel
Supplier, inventory and procurement analytics that keep the whole chain in sync — from purchase order to fulfilment. View template →

6. Industrial Manufacturing KPI Dashboard in Excel
Heavy-industry KPI tracking for plants running continuous or large-scale operations, with metrics tuned for industrial throughput. View template →

7. Supply Chain Dashboard in Excel
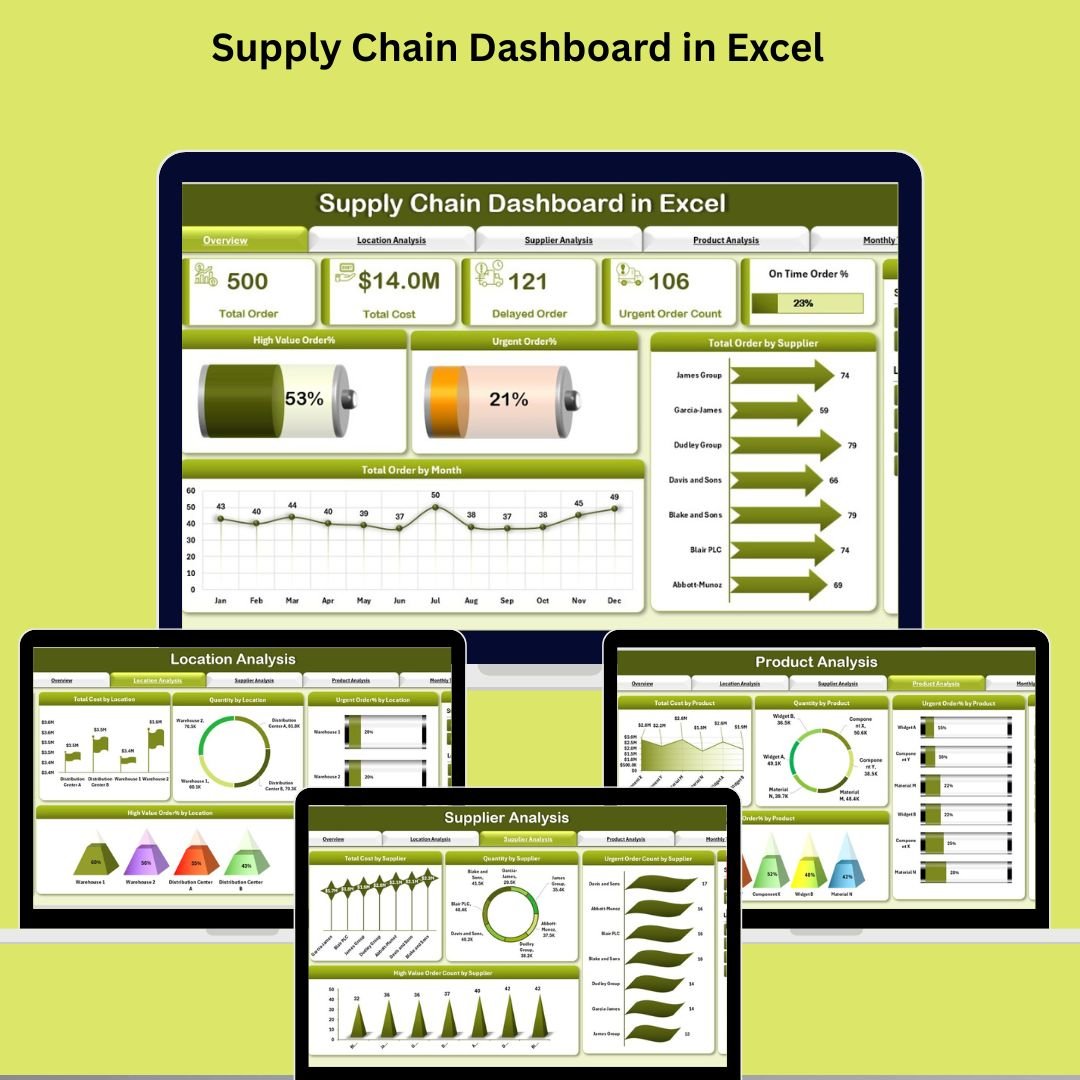
A streamlined supply chain view for demand, fulfilment and cost visibility — lighter than the full management dashboard for quick reads. View template →
8. Freight Cost KPI Dashboard in Excel
Control transportation spend with freight cost-per-unit, lane and carrier analysis — the fastest way to find where logistics money leaks. View template →

9. Manufacturing KPI Scorecard in Excel
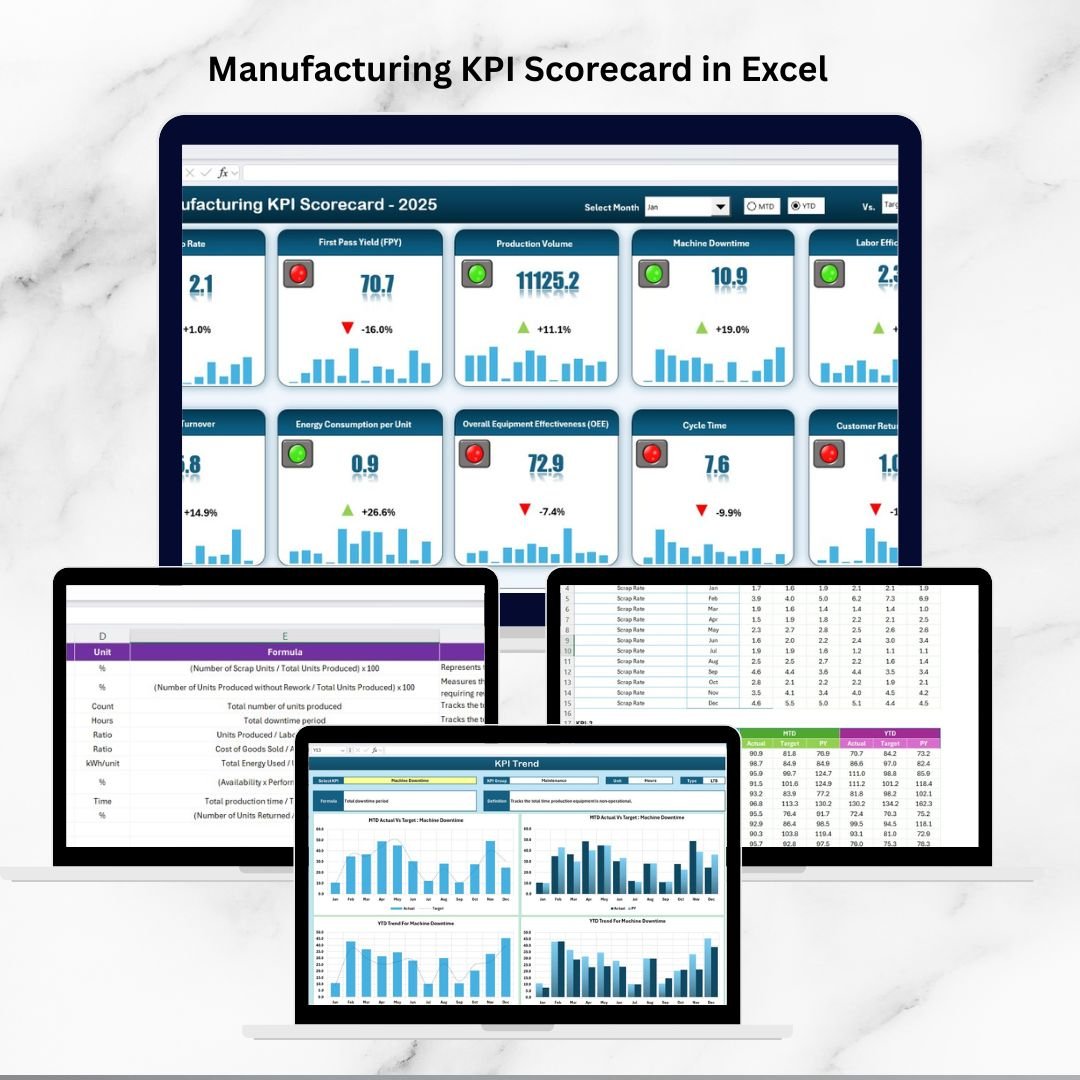
A traffic-light scorecard comparing actuals versus targets — the single view most COOs put in front of the leadership team every month. View template →
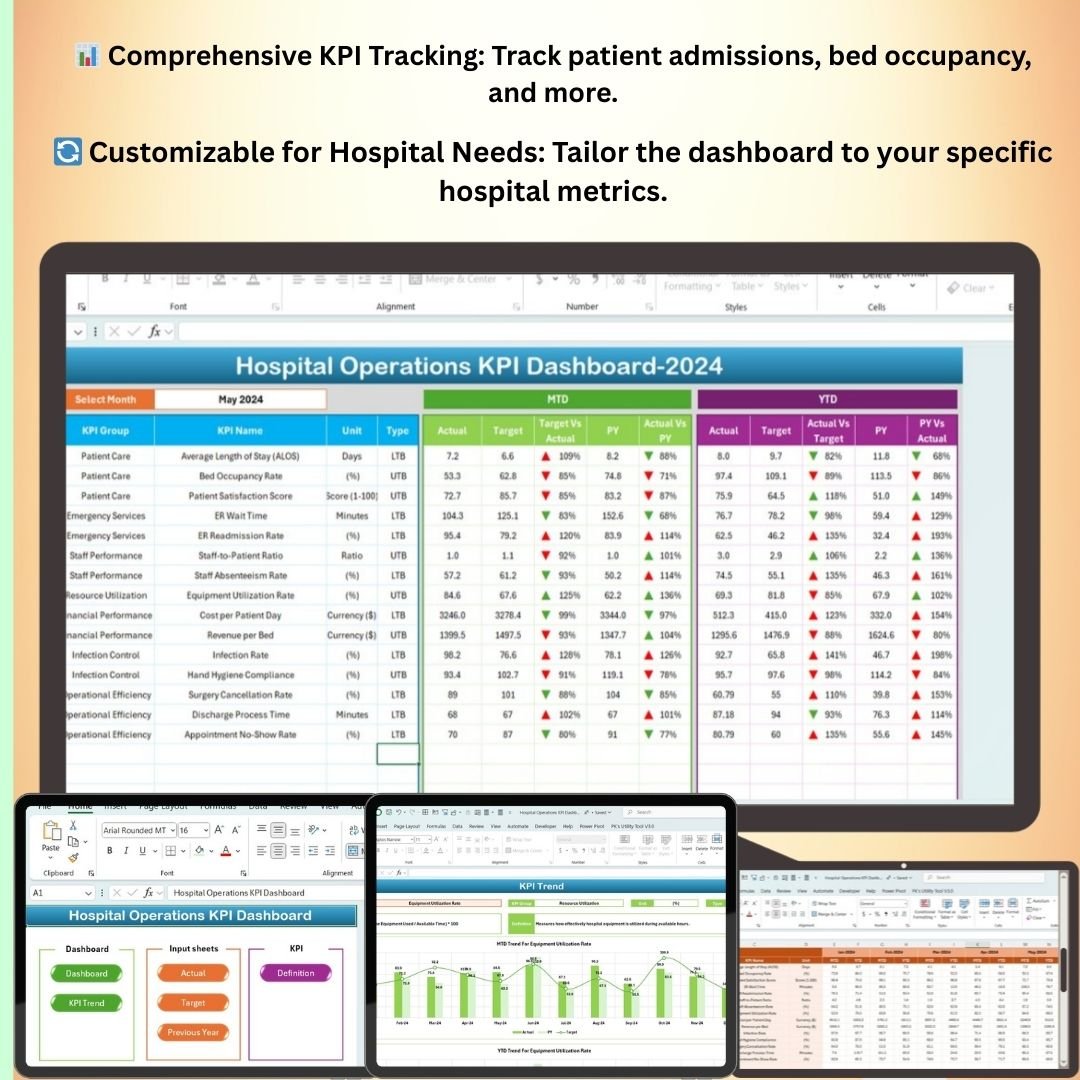
10. Hospital Operations KPI Dashboard in Excel
Operational KPI tracking for healthcare facilities — included because operations leadership increasingly spans service industries and multi-vertical groups. View template →
💡 Smart Comparison — Individual vs Bundle
| # | Template | Platform | Individual Price |
|---|---|---|---|
| 1 | Manufacturing Dashboard in Excel | Excel | $17.99 |
| 2 | Transportation & Logistics Dashboard in Excel | Excel | $17.99 |
| 3 | Manufacturing Efficiency Dashboard in Power BI | Power BI | $17.99 |
| 4 | Manufacturing KPI Dashboard | Excel | $12.99 |
| 5 | Supply Chain Management Dashboard in Excel | Excel | $17.99 |
| 6 | Industrial Manufacturing KPI Dashboard in Excel | Excel | $12.99 |
| 7 | Supply Chain Dashboard in Excel | Excel | $17.99 |
| 8 | Freight Cost KPI Dashboard in Excel | Excel | $12.99 |
| 9 | Manufacturing KPI Scorecard in Excel | Excel | $12.99 |
| 10 | Hospital Operations KPI Dashboard in Excel | Excel | $12.99 |
| Individual Total | $154.90 | ||
| Bundle Price — Save 44% | $86.99 | ||
✅ Why Buy the Toolkit Instead of Individual Templates
The obvious advantage is price — you save $67.91, effectively getting four of the ten templates for free. But the strategic advantages matter more. First, consistency: all ten dashboards share the same design language and data-entry logic, so your team learns one pattern and reuses it everywhere. Second, coverage: production, supply chain, logistics, freight and operational scorecards in one purchase means no gaps when a new question comes up in a review. Third, platform flexibility: keep sensitive plant data offline in Excel, and push the shareable, refreshable view to Power BI for the wider organisation — without paying twice.
🛠️ Best Practices for Deploying the Toolkit
Start with the scorecard. Load the Manufacturing KPI Scorecard first and agree your red/amber/green targets with the leadership team — that becomes your single source of truth. Next, wire up the operational dashboards (manufacturing, supply chain, logistics, freight) with the same master dataset so numbers reconcile across views. Then reserve the Power BI Manufacturing Efficiency report for anything that needs scheduled refresh or org-wide distribution. Keep one owner per dashboard, refresh on a fixed cadence (daily for production, weekly for supply chain and freight), and review the scorecard monthly. Because every template is fully editable, rebrand the colours once and apply them across the set for a consistent executive look.
📚 Explore More Templates
Browse related collections on NextGenTemplates: Manufacturing Excel templates, Excel KPI dashboards, Power BI dashboards, and the full Excel dashboard library.
❓ Frequently Asked Questions
What is the COO / Operations Director Toolkit?
It’s a bundle of 10 premium dashboards — nine in Excel and one in Power BI — covering manufacturing, supply chain, logistics, freight and operational KPIs. It’s designed for COOs, Operations Directors and the leaders reporting to them who need cross-functional visibility in one coordinated set.
How much do I save with the bundle?
The ten templates cost $154.90 when purchased individually. The toolkit is $86.99, so you save $67.91 — a 44% discount.
Do I need Power BI to use the toolkit?
No. Nine of the ten templates are native Excel and work offline with no add-ins. Only the Manufacturing Efficiency Dashboard requires Power BI (Desktop is free), and it’s optional — you can use the Excel dashboards on their own.
Are there any macros or subscriptions?
No macros and no subscriptions. The Excel templates use native PivotTables, slicers and formulas. It’s a one-time purchase with lifetime access and unlimited downloads.
Can I customise the dashboards with my own branding?
Yes. Every template is fully editable — change colours, rename lines and machines, adjust KPI targets and extend date ranges without breaking any formulas.
Who is the toolkit best suited for?
Chief Operating Officers, Operations and Plant Directors, supply chain and logistics managers, continuous-improvement teams, multi-vertical operators and consultants who want client-ready deliverables without the custom build time.
🎯 Ready to Streamline Your Operations Reporting?
Get all 10 templates for $86.99 — save $67.91 (44% off)
For step-by-step video tutorials on Excel and Power BI dashboards, visit our YouTube channel: YouTube.com/@PKAnExcelExpert.