Wedding Budget Dashboard in Power BI is a ready-to-use, interactive Power BI dashboard template designed for couples, wedding planners, and event coordinators who want to manage their wedding finances visually using Microsoft Power BI. This dashboard includes 5 interactive pages covering Overview, Budget Analysis, Vendor Tracker, Payment Overview, and Guest & Ratings — featuring 5 KPI cards, dynamic charts, slicers, and detailed analytics across categories, priorities, vendors, payment methods, and wedding phases. Whether you are planning a small intimate ceremony or a grand celebration, this Power BI template helps you track every dollar from estimated costs to actual spending, vendor payments, and guest satisfaction — all in one centralized, interactive dashboard.
If you are looking for the best Power BI Dashboard Templates for wedding planning and event management, this Wedding Budget Dashboard in Power BI is one of the most comprehensive options available from NextGenTemplates.
Key Features of Wedding Budget Dashboard in Power BI
The Wedding Budget Dashboard in Power BI includes 5 interactive dashboard pages, 5 high-level KPI summary cards, and multiple dynamic charts that provide a 360-degree view of your wedding finances. The Overview page displays Total Estimated Cost, Total Actual Cost, Total Deposit Paid, Over Budget Items, and Budget Variance as KPI cards, along with charts for Avg Satisfaction Rating by Priority, Payment Completion Rate, Budget Adherence by Priority, Total Actual Cost by Month Name, and Over Budget Items by Priority. Built-in slicers allow instant filtering by category, priority, vendor, payment method, or wedding phase.
The template is powered by DAX calculations and dynamic Power BI visuals, making it significantly more interactive than traditional Excel-based wedding budget trackers. Cross-filtering between charts means clicking on any visual element instantly updates all related charts on the same page — delivering real-time drill-down capability without any manual effort.
For those who prefer Microsoft Excel, the same wedding budget tracking experience is available in the Wedding Budget Dashboard in Excel, and for a browser-based option requiring no software installation, check out the Wedding Budget Dashboard in HTML.
Dashboard Pages Explanation
1 — Overview Page
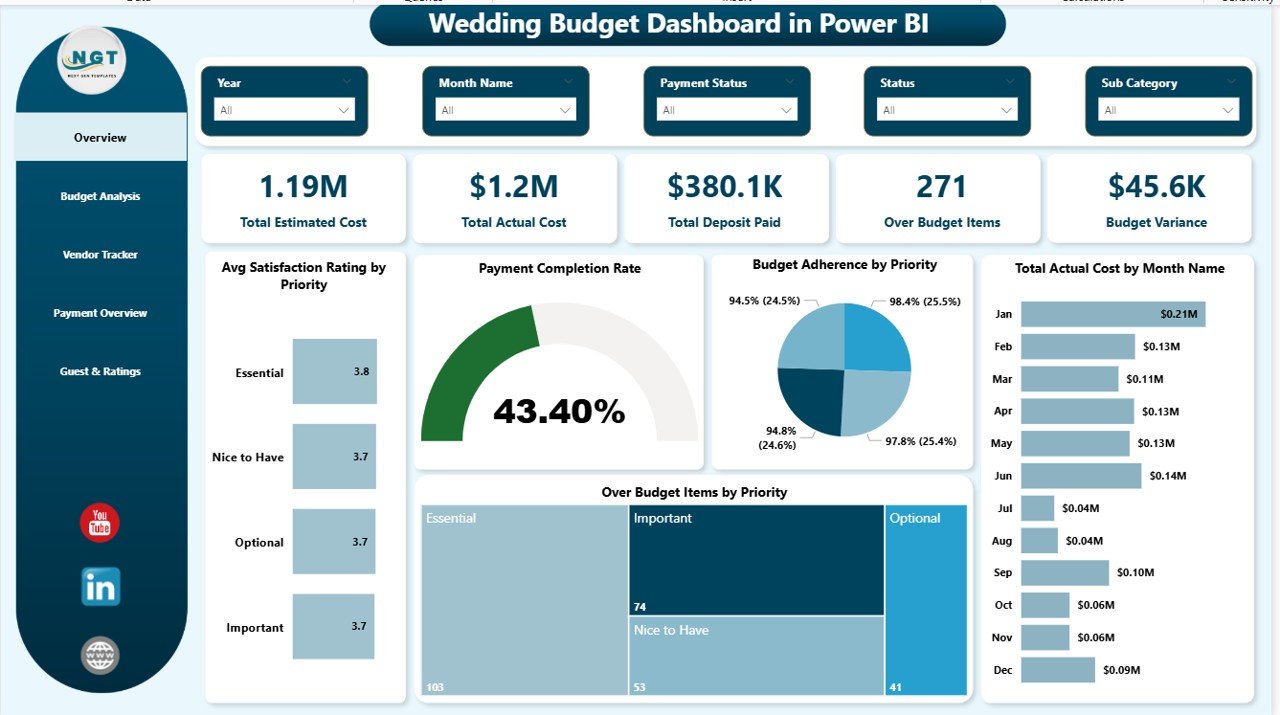
The Overview page serves as your wedding budget command center. At the top, 5 KPI cards display Total Estimated Cost, Total Actual Cost, Total Deposit Paid, Over Budget Items, and Budget Variance — giving you an instant financial snapshot. Below the cards, five key visualizations provide deeper insights: Avg Satisfaction Rating by Priority reveals how well different priority categories are performing, Payment Completion Rate shows the percentage of payments completed across all items, Budget Adherence by Priority highlights which priority levels are staying within budget, Total Actual Cost by Month Name tracks how your spending distributes across the planning timeline, and Over Budget Items by Priority identifies exactly where overspending is concentrated. Multiple slicer controls are available so you can apply filters and see the filtered dashboard quickly across all dimensions.
Wedding Budget Dashboard in Power BI
2 — Budget Analysis
The Budget Analysis page provides a deep dive into your wedding spending patterns across different dimensions. It includes charts for Total Estimated Cost and Total Actual Cost by Wedding Phase, allowing you to compare planned vs actual spending across Pre-Wedding, Ceremony, Reception, and Post-Wedding phases. Budget Adherence by Priority shows which priority categories (High, Medium, Low) are staying within their allocated budgets. Total Actual Cost by Category breaks down spending across all wedding expense categories like Venue, Catering, Photography, Entertainment, Decorations, and more. Total Actual Cost by Priority provides a consolidated view of spending distribution across priority levels.
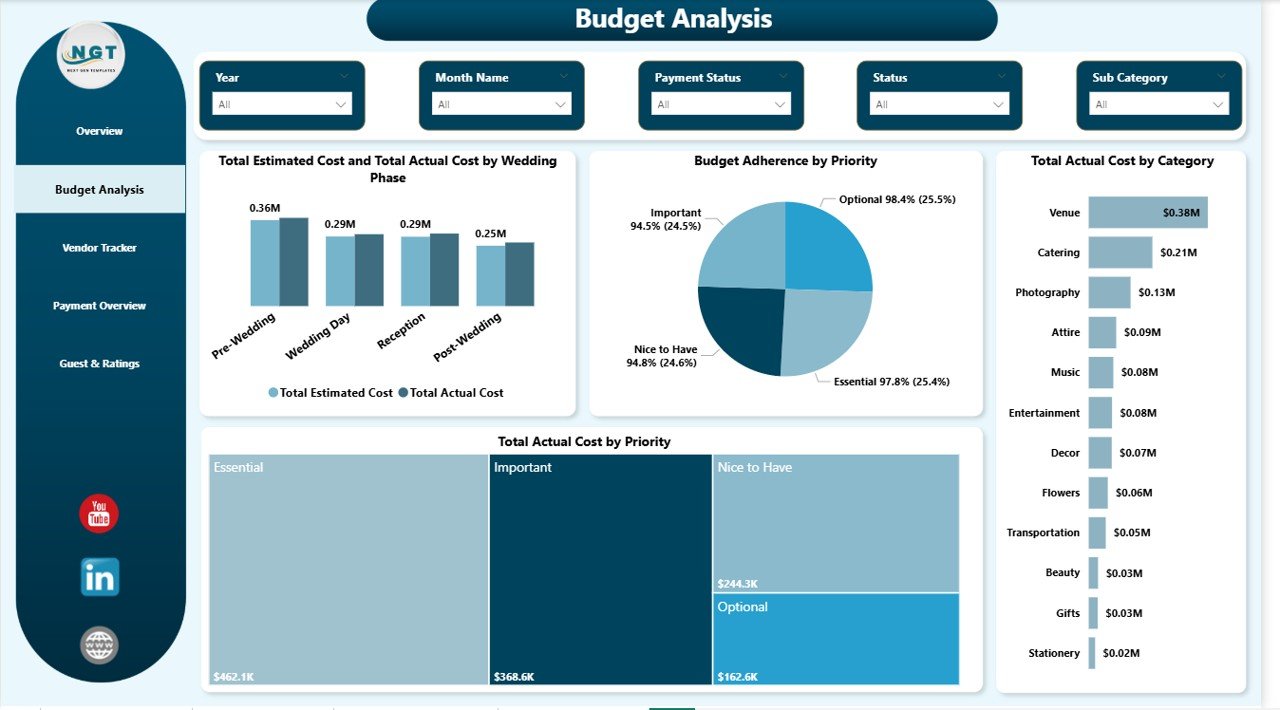
Budget Analysis
3 — Vendor Tracker
The Vendor Tracker page focuses on vendor-related financial analysis. It displays Total Actual Cost and Total Deposit Paid by Payment Method, helping you understand how expenses are distributed across Credit Card, Bank Transfer, Cash, and Check payments. Over Budget Items by Priority identifies which priority categories have the most vendors exceeding their budget. Total Deposit Paid and Total Actual Cost by Payment Status compares paid, pending, and partial payment amounts. Total Actual Cost by Payment Method provides a clear view of which payment channels carry the highest expense volume.
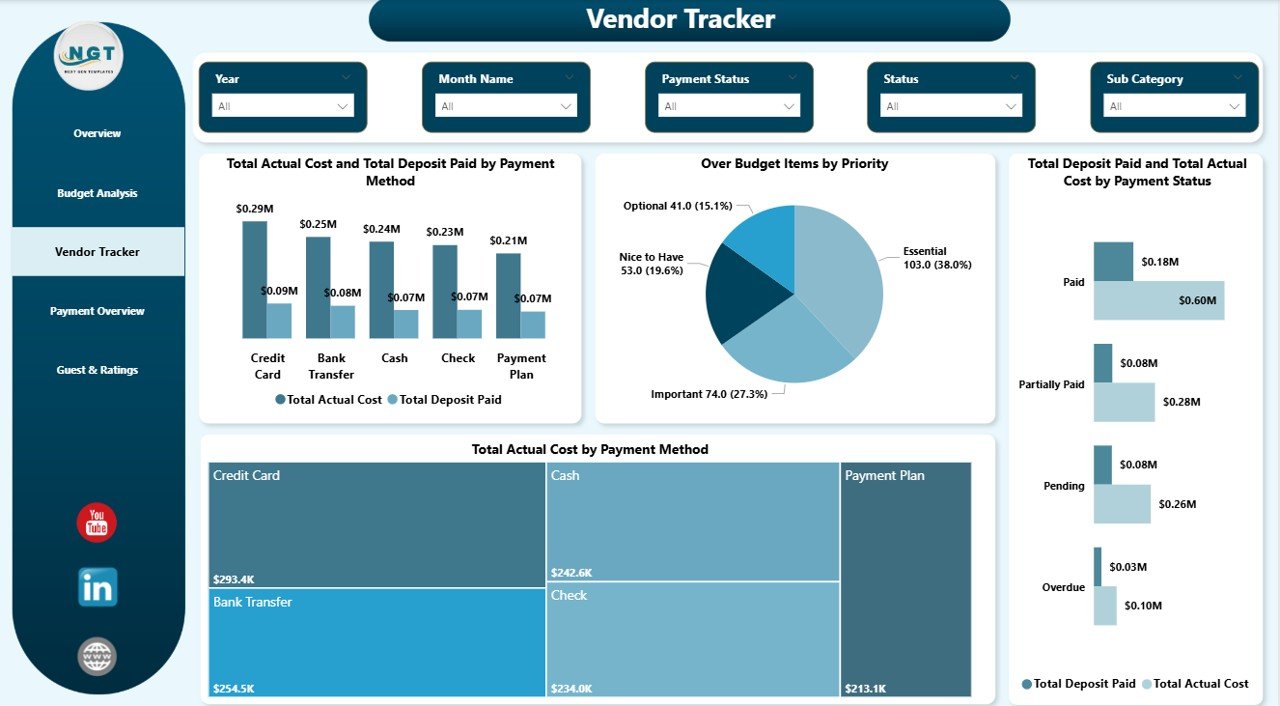
Vendor Tracker
4 — Payment Overview
The Payment Overview page tracks payment timelines and financial breakdowns across your wedding budget. It includes Total Deposit Paid by Month Name to reveal monthly deposit patterns and payment scheduling trends. Over Budget Items by Status shows how many items are over budget based on their current payment status (Paid, Pending, Partial). Budget Adherence by Payment Method evaluates which payment methods maintain better budget discipline. Total Expenses by Payment Method provides an aggregate spending view across all payment channels.
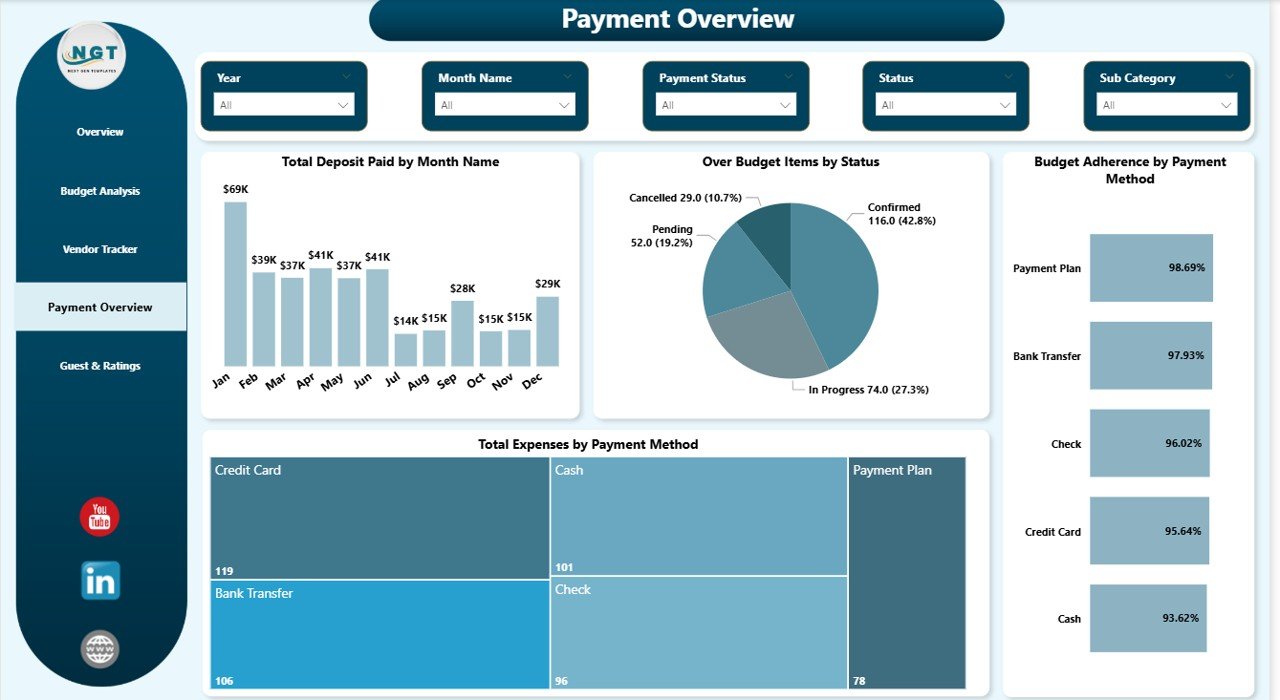
Payment Overview
5 — Guest & Ratings
The Guest & Ratings page helps you understand the relationship between guest counts, spending, and satisfaction. Total Guest Impact by Category shows how guest numbers affect spending in different categories like Catering, Venue, and Entertainment. Total Guest Impact by Wedding Phase breaks down guest influence across Pre-Wedding, Ceremony, Reception, and Post-Wedding phases. Avg Satisfaction Rating by Wedding Phase reveals which phases deliver the highest satisfaction scores. Total Expenses by Payment Method provides additional financial context alongside the guest and satisfaction metrics.
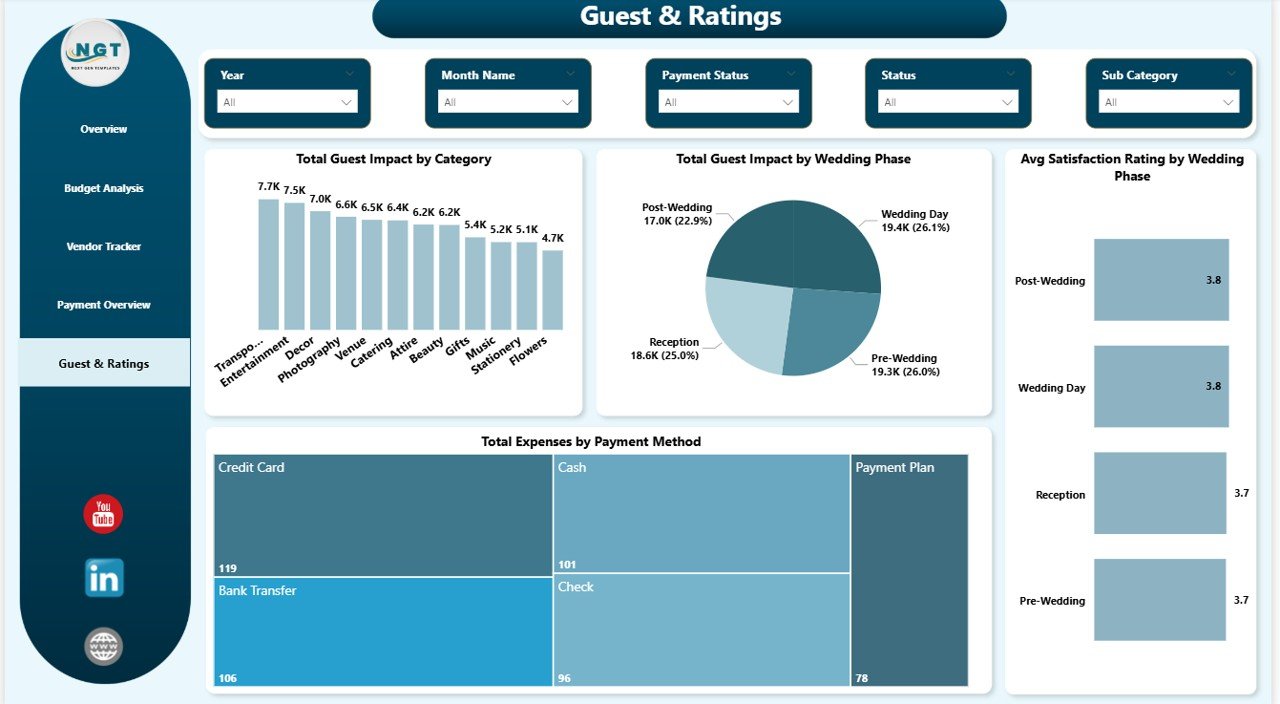
Guest & Ratings
Advantages of Wedding Budget Dashboard in Power BI
The Wedding Budget Dashboard in Power BI offers several advantages over traditional wedding budget spreadsheets. First, Power BI’s cross-filtering capability means every chart is interconnected — clicking on a specific category in one visual instantly filters all other visuals on the page. This creates a truly interactive analysis experience that static spreadsheets cannot match. Second, the DAX-powered calculations automatically compute budget variance, payment completion rates, and budget adherence percentages without any manual formulas. Third, the ability to publish to Power BI Service means you can share your wedding budget dashboard with family members, your wedding planner, or co-planners through a simple web link — enabling collaborative budget monitoring in real time.
Opportunities for Improvement
While the template covers the core wedding budget tracking needs comprehensively, there are opportunities to extend its functionality further. You could add a dedicated Vendor Comparison page that plots vendor cost vs satisfaction ratings in a scatter chart for easier vendor evaluation. A Timeline page with Gantt-style visuals showing task deadlines alongside payment due dates would help with scheduling. Integration with a live Excel or Google Sheets data source would enable automatic data refresh without manual updates. Additionally, adding conditional formatting rules to highlight items that exceed budget thresholds by more than 10% or 20% would provide even faster identification of critical overspending areas.
Best Practices for Using the Wedding Budget Dashboard
To get the most out of this dashboard, enter your budget data as early in the planning process as possible — ideally when you first establish estimated costs for each category. Update actual costs and deposit amounts as payments are made throughout the planning process. Use the slicers regularly to focus on specific wedding phases or priority categories during planning meetings. Review the Budget Analysis page monthly to catch overspending trends early. Share the dashboard with your wedding planner or co-planner through Power BI Service for collaborative decision-making. Compare the Guest & Ratings insights with your Budget Analysis to understand how guest count decisions impact your overall spending patterns.
Explore Relevant Templates
If you found this Wedding Budget Dashboard in Power BI useful, you may also want to explore these related templates from NextGenTemplates:
Wedding Budget Dashboard in Excel — Track the same wedding budget KPIs using Excel pivot tables and slicers for a desktop-based experience with no Power BI required.
Wedding Budget Dashboard in HTML — A browser-based version with interactive charts, searchable data view, and CSV export — no software installation needed.
Event Planning KPI Scorecard in Excel — Track event revenue, costs, ROI, attendance, and vendor performance with a structured KPI scorecard template.
Event Management Analysis Dashboard in Excel — A comprehensive 5-page event tracking dashboard for budgets, attendance, and regional performance analysis.
Frequently Asked Questions
What KPIs does the Wedding Budget Dashboard in Power BI track?
The Wedding Budget Dashboard in Power BI tracks 5 key performance indicators: Total Estimated Cost, Total Actual Cost, Total Deposit Paid, Over Budget Items, and Budget Variance. It provides detailed analysis across 5 interactive pages covering budget adherence, vendor payments, deposit tracking, guest impact, and satisfaction ratings by wedding phase and category.
Do I need Power BI Pro to use this template?
No. This template works with the free Power BI Desktop application from Microsoft. Power BI Pro is only needed if you want to publish and share the dashboard online through Power BI Service for collaborative viewing.
How do I replace the sample data with my own wedding budget?
Open the .pbix file in Power BI Desktop, navigate to the data tables, and replace the sample records with your actual wedding expense data. Then click Refresh to update all charts and KPI cards automatically.
What is the best Power BI template for tracking wedding expenses?
The Wedding Budget Dashboard in Power BI from NextGenTemplates is one of the most comprehensive options for wedding expense tracking. It includes 5 interactive pages with KPI cards, budget adherence analysis, vendor tracking, payment overview, and guest impact insights — all with dynamic cross-filtering and DAX-powered calculations.
Can professional wedding planners use this dashboard for client management?
Yes. Wedding planners can use this template for each client project by duplicating the file. The professional design and interactive visuals make it an excellent tool for presenting budget reports and financial insights to clients during planning meetings.
How is this Power BI dashboard different from the Excel version?
The Power BI version provides cross-filtering between charts, DAX-powered automatic calculations, the ability to publish online for collaborative viewing, and more advanced visual interactivity. The Excel version uses pivot tables and slicers and works entirely offline within Microsoft Excel.
Conclusion
The Wedding Budget Dashboard in Power BI transforms wedding budget management from scattered spreadsheets into a professional, interactive analytics experience. With 5 dedicated dashboard pages, 5 KPI cards, dynamic charts, built-in slicers, and DAX-powered calculations, you gain complete visibility into every aspect of your wedding finances — from estimated vs actual costs to vendor payments, deposit tracking, and guest satisfaction analysis. Whether you are a couple planning your dream wedding or a professional wedding planner managing multiple client budgets, this template provides the data-driven insights you need to stay on budget and deliver a perfect celebration.
Click here to Purchase the Wedding Budget Dashboard in Power BI
Visit our YouTube channel for step-by-step video tutorials: Youtube.com/@PK-AnExcelExpert