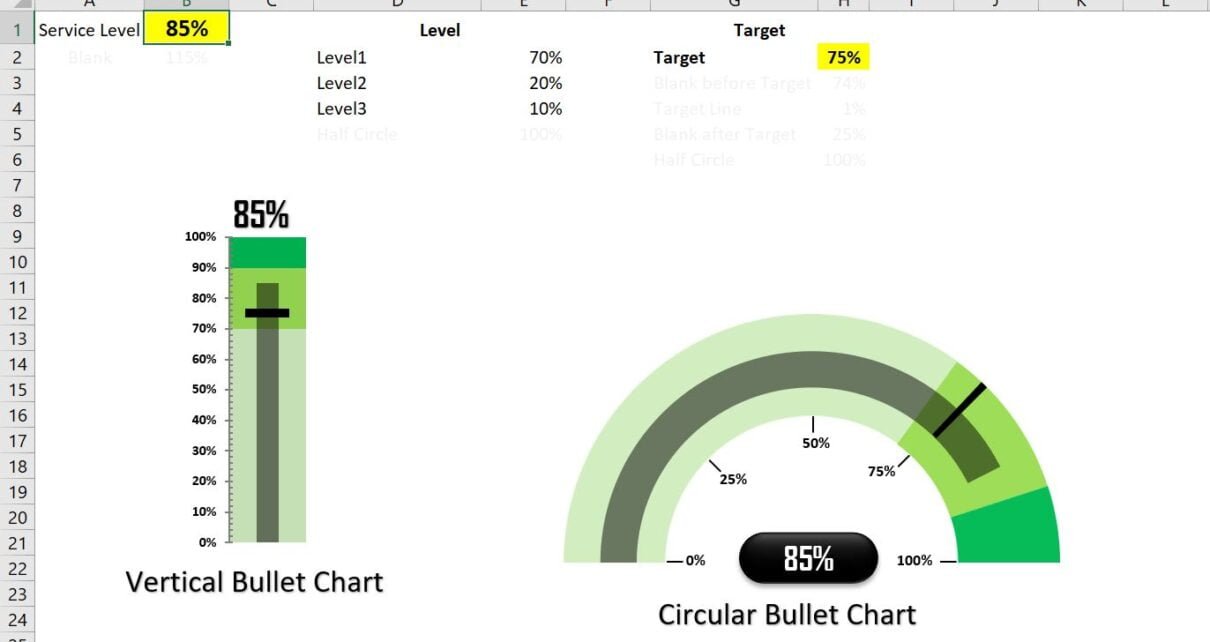
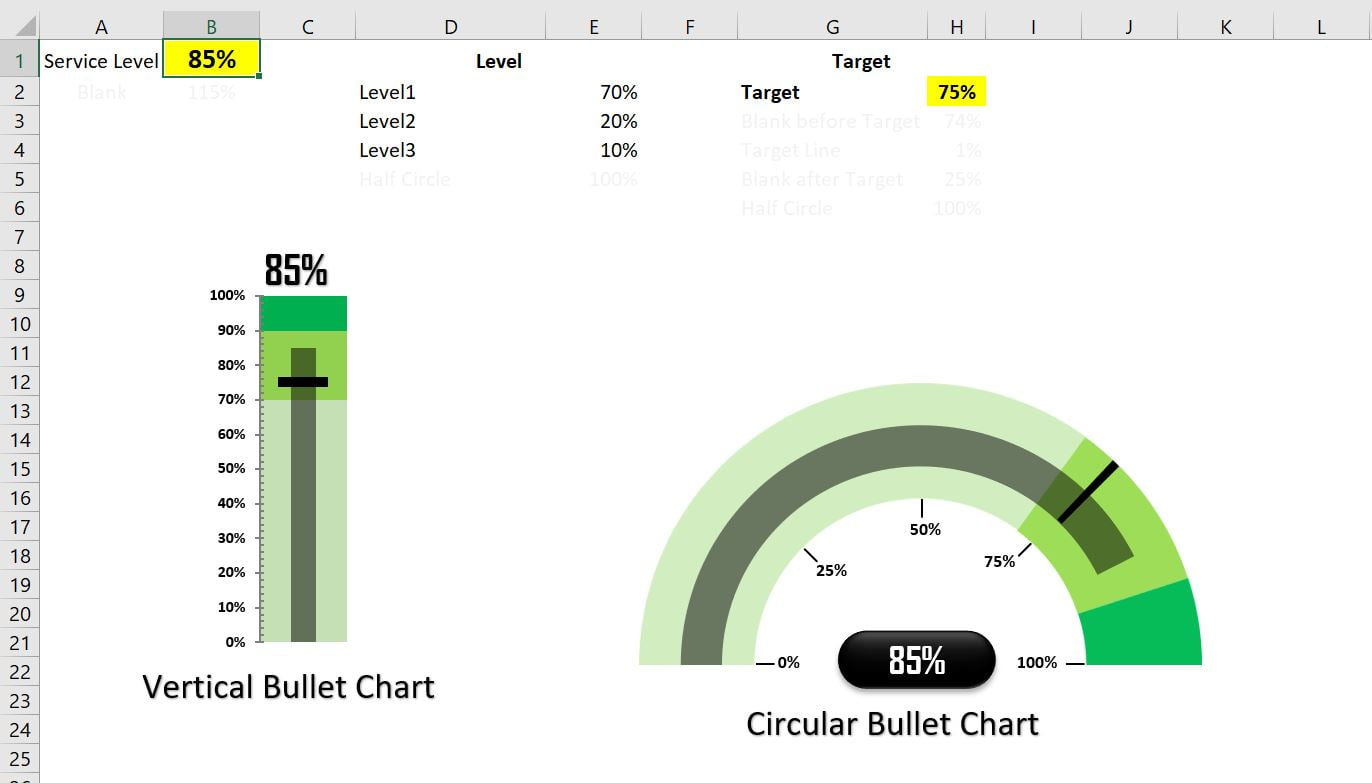
In this article, we have created Vertical and Circular Bullet chart in Excel with 3 levels of color. We have displayed the Target point also in this chart. You can use this chart to display the KPI metric like Service Level, Quality Score or Gross Margin etc. This chart is useful to show Target Vs Actual value.
What is Bullet Chart in Excel?
A Bullet Chart is a powerful visualization designed by dashboard expert Stephen Few. You can efficiently represents performance against a target while conserving screen space. This is very useful to show the Targe Vs Actual performance.
Click to buy Vertical and Circular Bullet Chart in Excel
Visit our YouTube channel to learn step-by-step video tutorials
Watch the step by step video tutorial:
Click to buy Vertical and Circular Bullet Chart in Excel