When it comes to tracking sales performance, a dynamic and interactive chart is often the best way to go. In this article, we’ll show you how to create a Target vs Actual Sales Dynamic Chart in Excel using column charts and some customization. This chart will allow you to see the sales performance of different employees and provide an easy-to-understand analysis of their sales. With the help of this chart, you will be able to make data-driven decisions about your sales team and improve their performance.
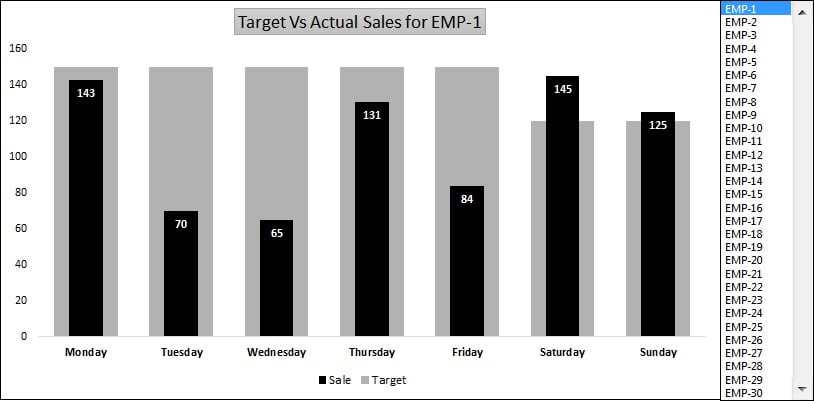
Target Vs Actual Sales Dynamic Chart
Click to buy Target Vs Actual Sales Dynamic Chart
Step 1: Assembling the Sales Data
To create a dynamic chart that compares targets and actual sales in Excel, you’ll first need to gather your sales data. In this scenario, you’ll use a weekly sales report for a single employee. The data set will consist of the date, the employee’s target sales, and their actual sales for each day of the week.
Here’s how to create the data set:
Launch a new workbook in Excel. Type the headers for your data set in the first row: “Date,” “Employee Name,” “Target Sales,” and “Actual Sales.”
Input the sales data for each day of the week in the rows below the headers. Make sure to include the employee’s name in each row to properly associate the data with the correct employee.
Repeat this process for each employee in your sales team.
Step 2: Incorporating an Interactive List Box
In your quest to visualize sales performance in Excel, the next move is to bring in a List Box. This versatile form control allows you to effortlessly pick an employee and observe their sales figures with ease. The List Box, essentially a drop-down list, showcases a series of items, in this particular case, the names of individuals in your sales team.
Here’s a guide to adding a List Box:
- Navigate to the Developer tab on the ribbon and press “Insert.”
- In the “Forms” area, strike the “List Box (Form Control)” button.
- Draw the List Box within your worksheet.
- Right-click on the List Box and opt for “Format Control.”
- In the Format Control dialogue box, move to the “Control” tab.
- Enter the range of cells containing your employees’ names in the “Input range” field.
- Press “OK” to close the Format Control dialogue box.
Step 3: Crafting the Sales Performance Chart
It’s finally time to put together the chart that showcases the sales performance of each employee. This example utilizes a column chart, but you can also customize it to suit your requirements. The chart can be made more dynamic, providing an interactive experience.
Visit our YouTube channel to learn step-by-step video tutorials
Watch step by step video tutorial .
Click to buy Target Vs Actual Sales Dynamic Chart
To sum it up, the Target vs Actual Sales Dynamic Chart in Excel is a must-have tool in evaluating sales performance and making informed sales strategy decisions. The ability to display sales data for numerous employees provides a quick and efficient way to compare performance and pinpoint areas for improvement. Whether for personal or professional use, this chart proves to be a formidable tool in tracking sales performance and making data-driven decisions.
Click to buy Target Vs Actual Sales Dynamic Chart