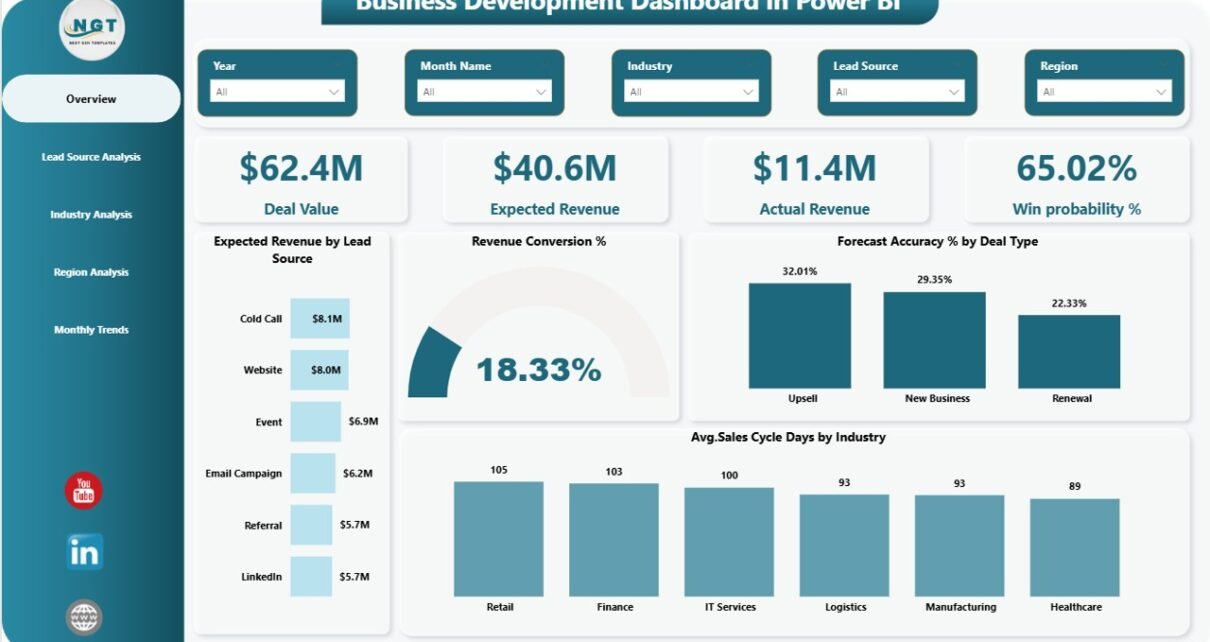
Understanding the sales process is crucial for improving conversion rates and optimizing sales strategies. The Sales Funnel Dashboard in Excel provides a comprehensive tool to track leads, opportunities, conversions, and
PKComments Off on Retail and E-commerce Growth Metrics KPI Dashboard in Excel
In today’s digital economy, retail and e-commerce businesses face intense competition. To grow and succeed, they must monitor performance closely and make quick, informed decisions. That’s where a Retail and
In the retail industry, having a clear overview of sales, inventory, and performance metrics is essential for making informed decisions and driving business growth. The Retail Dashboard in Power BI
PKComments Off on Sales and Marketing Stakeholder Reporting KPI Dashboard in Excel
In today’s fast-paced business world, stakeholders need clear, visual, and actionable insights. That’s where a Sales and Marketing Stakeholder Reporting KPI Dashboard in Excel becomes a game changer. If you’re
PKComments Off on Ecommerce Conversion Rate KPI Dashboard in Excel
The world of eCommerce is rapidly evolving, with online businesses constantly looking for ways to optimize their sales and conversion rates. To stay ahead in the game, businesses need to
PKComments Off on Sales and Marketing Resource Allocation KPI Dashboard in Excel
In today's competitive business world, optimizing your sales and marketing resources is no longer optional—it's essential. Every decision, campaign, or investment must align with measurable outcomes. That's where the Sales
PKComments Off on Sales and Marketing Operations KPI Dashboard in Excel
In today's data-driven world, tracking your sales and marketing operations is not just an option—it's a necessity. Businesses that monitor key performance indicators (KPIs) regularly are more likely to make
PKComments Off on Water sales KPI Dashboard in Excel
In the competitive world of water sales, managing performance effectively and efficiently is crucial. Whether you're a water supplier, utility manager, or sales team leader, tracking key metrics helps you
PKComments Off on Revenue Growth KPI Dashboard in Excel
In today’s competitive business landscape, tracking revenue growth is crucial for making informed decisions and ensuring financial stability. A Revenue Growth KPI Dashboard in Excel provides an efficient and data-driven
PKComments Off on Luxury Goods KPI Dashboard in Power BI
The luxury goods industry is characterized by high-end products, affluent customers, and a competitive market. To remain competitive, brands in this space need to continuously monitor their performance, track key
This website uses cookies to improve your user experience, analyze site traffic and serve targeted ads in accordance with our Privacy PolicyACCEPT
Privacy & Cookies Policy
Privacy Overview
This website uses cookies to improve your experience while you navigate through the website. Out of these cookies, the cookies that are categorized as necessary are stored on your browser as they are essential for the working of basic functionalities of the website. We also use third-party cookies that help us analyze and understand how you use this website. These cookies will be stored in your browser only with your consent. You also have the option to opt-out of these cookies. But opting out of some of these cookies may have an effect on your browsing experience.
Necessary cookies are absolutely essential for the website to function properly. This category only includes cookies that ensures basic functionalities and security features of the website. These cookies do not store any personal information.
Any cookies that may not be particularly necessary for the website to function and is used specifically to collect user personal data via analytics, ads, other embedded contents are termed as non-necessary cookies. It is mandatory to procure user consent prior to running these cookies on your website.