Data analysis is integral to understanding and improving business processes. Among the plethora of data analysis tools available, Excel charts hold a distinctive place. They are incredibly versatile, offering countless options to visualize data, and they can be as simple or as intricate as you require. This article will demonstrate a creative use of Excel charts: the Animated Car Chart. This type of chart is an engaging way to display team-wise productivity.
What is an Animated Car Chart?
An Animated Car Chart is a unique application of Excel bar charts to visualize data dynamically. In essence, it represents productivity rates using car symbols that ‘move’ in an animated fashion, giving a lively touch to your data presentation.
Advantages of Using Animated Car Charts in Excel
- Engaging and Visual: The main advantage of an Animated Car Chart is its visual appeal. The animation grabs attention, making it a fantastic tool for presentations.
- Ease of Understanding: Animated charts make it easier for viewers to comprehend data as they provide visual representation of numerical information.
- Versatile Application: While our focus here is on team-wise productivity, Animated Car Charts can represent a broad range of data sets. Any data that can be charted over time can benefit from animation.
How to Create an Animated Car Chart in Excel
Creating an animated car chart in Excel involves a combination of using a bar chart and a simple Visual Basic for Applications (VBA) code. The chart represents team productivity, and the VBA code powers the animation of the cars.
Watch the step-by-step video tutorial:
Click to buy Animated Car Chart in Excel
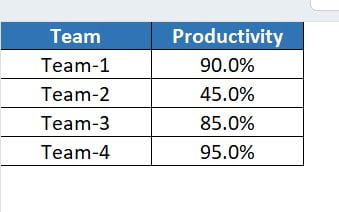
Step 1: Prepare Your Data
Here’s an example of the type of data you can use for this chart:
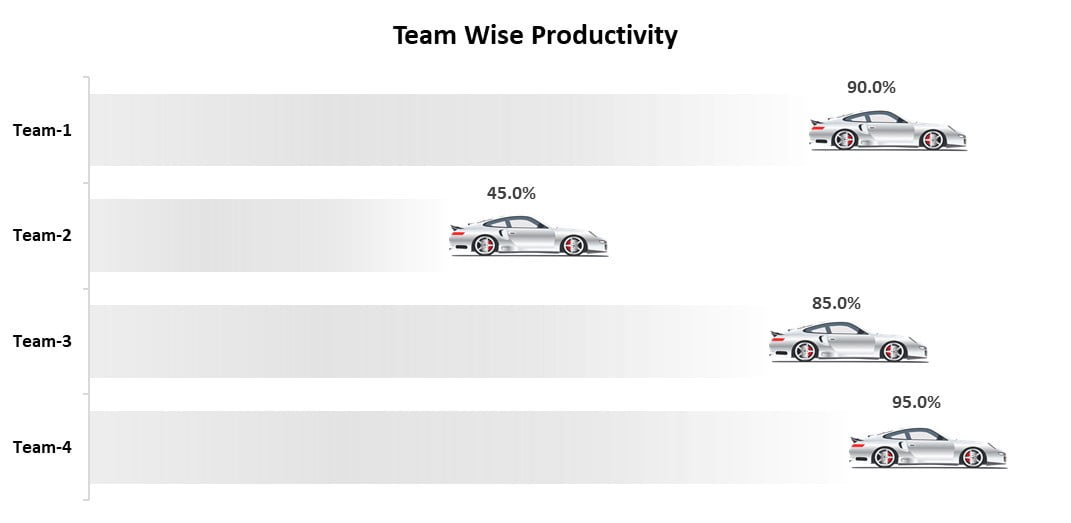
Step 2: Create the chart
At this stage, we create a Stacked bar chart using the data above. We have added a char image in the chart.
Click to buy Animated Car Chart in Excel
Step 3: Insert the VBA Code for Animation
Next, we input the VBA code for the animation.
Private Sub Worksheet_Activate()

Dim sh As Worksheet
Set sh = ThisWorkbook.Sheets("Animated Car Chart")

Dim i, n As Integer


For i = 2 To sh.Range("A" & Application.Rows.Count).End(xlUp).Row

For n = 0 To sh.Range("B" & i).Value * 100
VBA.DoEvents
sh.Range("C" & i).Value = n / 100
Next n

Next i


End Sub

Private Sub Worksheet_Change(ByVal Target As Range)

Dim sh As Worksheet
Set sh = ThisWorkbook.Sheets("Animated Car Chart")

Dim n As Integer

If Target.Column = 2 Then

If Target.Row > 1 And Target.Row <= 5 Then

For n = 0 To sh.Range("B" & Target.Row).Value * 100
VBA.DoEvents
sh.Range("C" & Target.Row).Value = n / 100
Next n

If sh.Range("B" & Target.Row).Value <> sh.Range("C" & Target.Row).Value Then
sh.Range("C" & Target.Row).Value = sh.Range("B" & Target.Row).Value
End If

End If

End If
End Sub
This VBA code allows each car (representing each team) to animate according to their respective productivity percentage.
Opportunities for Improvement in the Animated Car Chart
While the Animated Car Chart is visually engaging and a fun way to present data, there are always areas for improvement. Here are a few suggestions:
- Customizable car symbols: Currently, we use a simple car symbol to represent each team. Making this customizable could allow the symbol to better represent the team or data.
- Additional animation options: The VBA code could be adapted to provide additional animation effects, such as acceleration or deceleration based on changes in data.
- Integration with live data feeds: Linking the chart to live data feeds could allow for real-time data visualization.
Best Practices for Creating Animated Car Charts in Excel
- Keep it Simple: While the option to animate exists, the main aim is to make the data easy to understand. So, avoid overly complicated animations.
- Verify Your Data: Ensure your data is accurate before creating the chart. Incorrect data will lead to misleading charts.
- Test Your VBA Code: Make sure to test your VBA code to ensure that the animations work as intended.
- Customize Thoughtfully: While personalization is a great feature, avoid changes that make the chart harder to understand.
Frequently Asked Questions
- Is the Animated Car Chart only suitable for representing productivity data? Interestingly, the Animated Car Chart is not confined to just productivity data. In fact, it can adapt to any set of data that evolves over a period, thus making it a versatile tool.
- Are there other animation options available? Yes, indeed. By tweaking the VBA code, you can experiment with a variety of animations. However, it’s vital to remember that clarity should be your top priority, so don’t let your animations complicate the data presentation.
- What if the VBA code doesn’t work? If, for some reason, you find your VBA code isn’t working as expected, it’s advisable to double-check it for any potential errors. Alternatively, you might find it beneficial to seek assistance from someone with more experience in VBA.
- What can I do to make my Animated Car Chart more engaging? There are several ways to enhance your Animated Car Chart’s appeal. For example, you could customize the car symbols, or even add different animation effects to make your chart more dynamic.
Conclusion
In conclusion, crafting an Animated Car Chart in Excel presents an innovative way to present your data. With its blend of simplicity, visual appeal, and engagement, it serves as a compelling tool in the arena of data visualization.
Undoubtedly, the process might require a bit of a learning curve, especially when it comes to handling VBA codes. Yet, the results can be remarkably rewarding, transforming your data into a lively, easily digestible format.
More importantly, there’s ample room to experiment with the Animated Car Chart. Whether it’s customizing the symbols or varying the animation effects, the key is to balance creativity with clarity. In this way, you can ensure that your Animated Car Chart not only captures attention but also effectively communicates your data.
Visit our YouTube channel to learn step-by-step video tutorials
Click to buy Animated Car Chart in Excel