New: NextGenTemplates Academy - video courses on Excel formulas with AI and Pivot Tables & dashboards. Early-bird: 20% off with code EARLYBIRD20 - first 20 orders only. See the courses →
  • Learn Excel (Free Course)
    • 1. Shortcut Keys
    • 2. Fill & Flash Fill
    • 3. Find & Replace
    • 4. Sort & Filter
    • 5. Formulas & Functions
    • 6. Data Validation
    • 7. Conditional Formatting
    • 8. Basic Charts
    • 9. Advanced Charts
    • 10. Pivot Tables
    • 11. Excel Dashboards
    • 12. VBA Course
    • 13. Excel Formulas with AI
  • Templates
  • Tutorials
    • Charts and Visualization
    • VBA
    • Excel Tips and Tricks
    • Excel Dashboards
    • Power Pivot & DAX
  • Power BI
  • Template Store
    • Ready to Use Templates
  • Courses
  • Academy
    • Excel + AI Mastery: 100 Formulas
    • Excel Pivot Tables & Dashboards
  • About Us
  • Contact Us

PK: An Excel Expert

Transforming Data into Decisions

Tag: Informative Chart

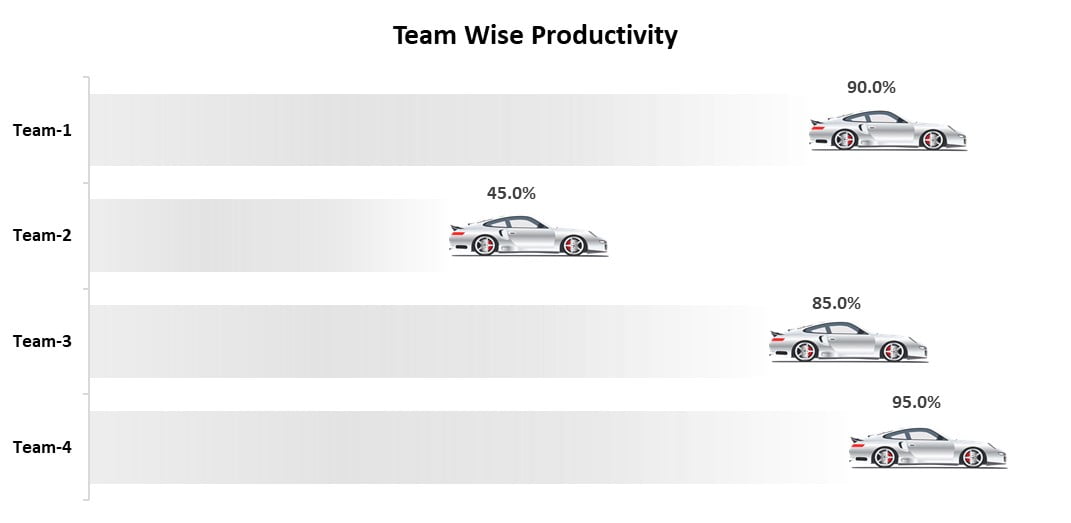
Animated Car chart
Charts and Visualization

Animated Car Chart in Excel

June 16, 2023March 1, 2025 PKComments Off on Animated Car Chart in Excel
Data analysis is integral to understanding and improving business processes. Among the plethora of data analysis tools available, Excel charts hold a distinctive place. They are incredibly versatile, offering countless
Read More
Progress Bar Chart in Excel
Charts and Visualization

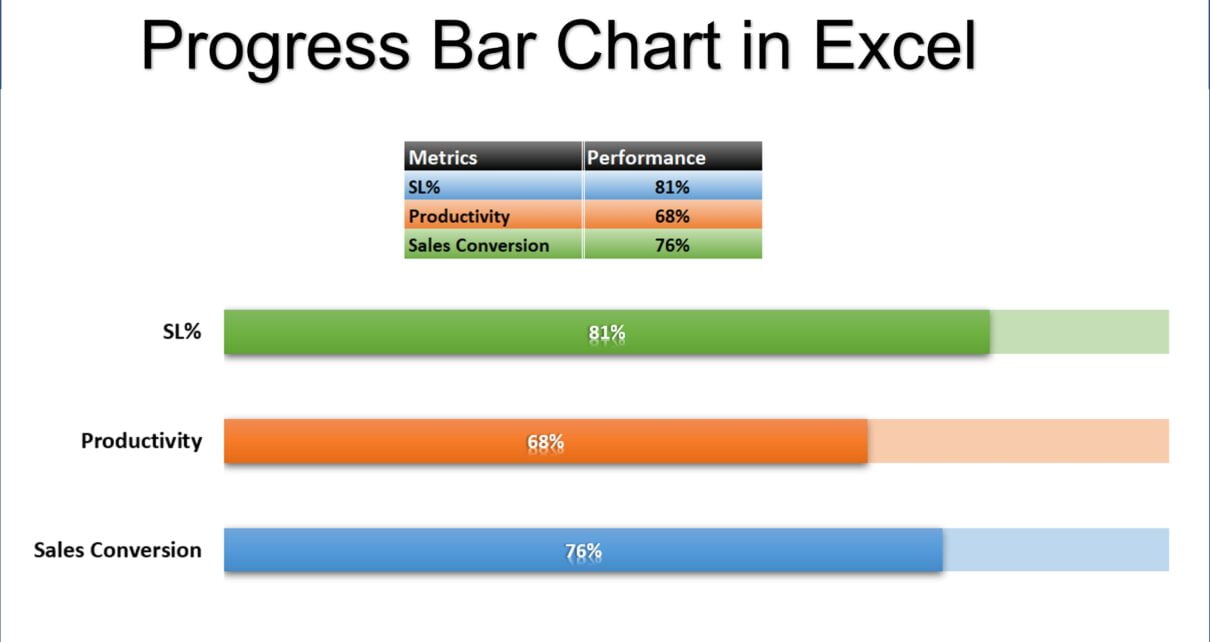
Progress Bar Chart in Excel

February 22, 2022March 3, 2025 PKComments Off on Progress Bar Chart in Excel
Progress Bar Chart in Excel Progress Bar Chart in Excel is very useful chart to show the completion% or other % metrics. In this example, we have displayed the Service
Read More
Dynamic Circle Chart in Excel
Charts and Visualization

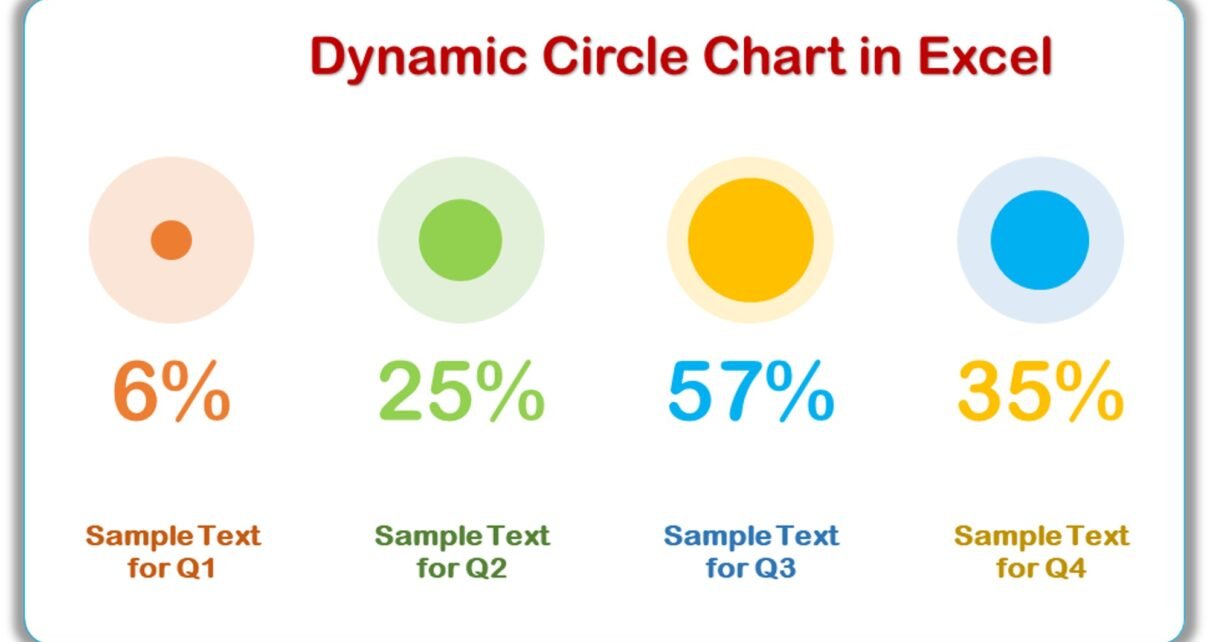
Dynamic Circle Chart in Excel

February 6, 2022March 4, 2025 PKComments Off on Dynamic Circle Chart in Excel
In this article, we have created Dynamic Circle Chart in Excel. We have used Bubble Charts to create this dynamic chart. You can use this chart in your Presentation. Dynamic
Read More
Pie of Pie Chart
Charts and Visualization

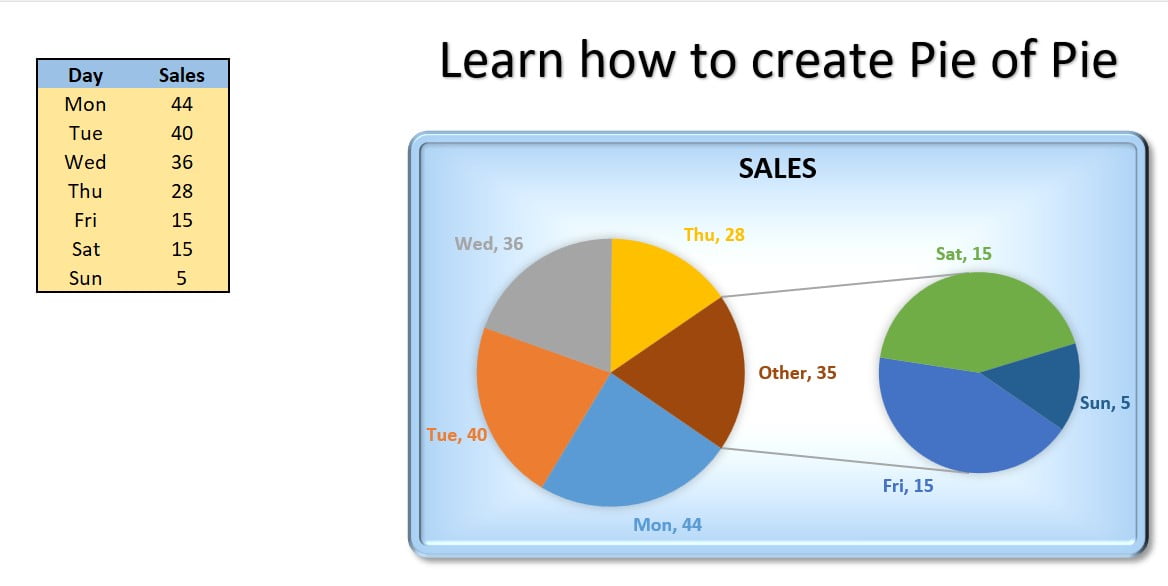
Pie of Pie Chart in Excel

January 22, 2022October 10, 2026 PKComments Off on Pie of Pie Chart in Excel
Pie of Pie Chart is useful once data have 3 to 4 big slices in the Pie chart and multiple small slices. We can group small slices as one slice "Other"
Read More
Smart Chart with Condition Formatting
Power Pivot Charts and Visualization

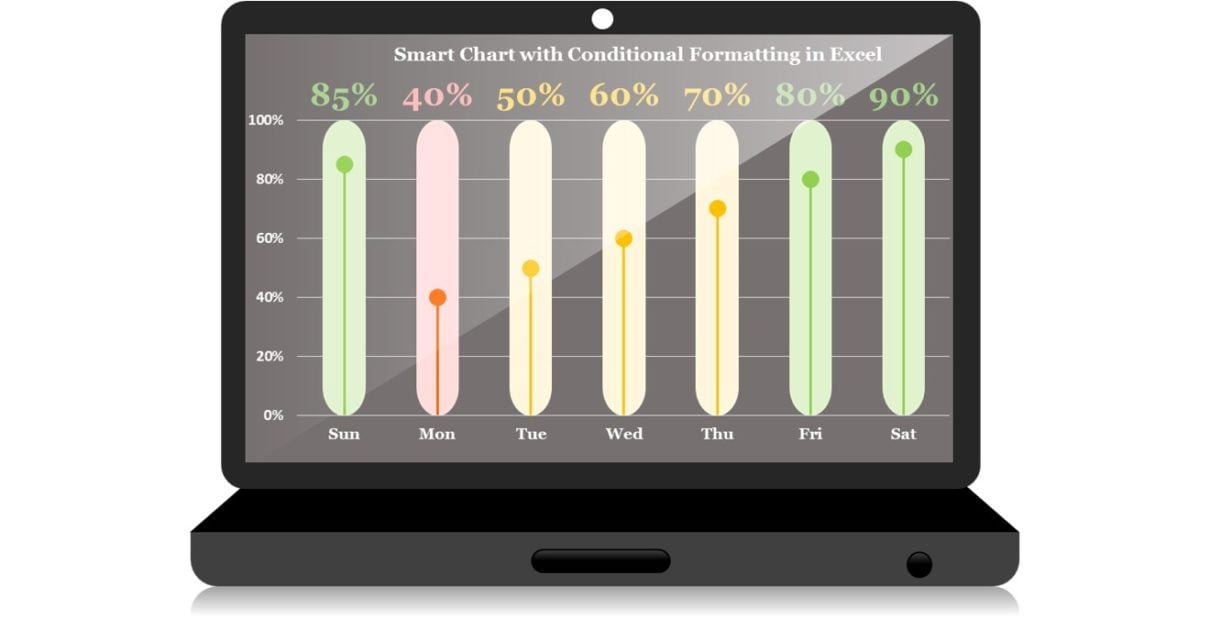
Smart Chart with Laptop Shape in Excel

May 3, 2020March 3, 2025 PKComments Off on Smart Chart with Laptop Shape in Excel
In this article, we have created a beautiful and smart chart with Conditional formatting in Microsoft Excel. We have create a laptop shape also using Excel shapes. We have placed
Read More
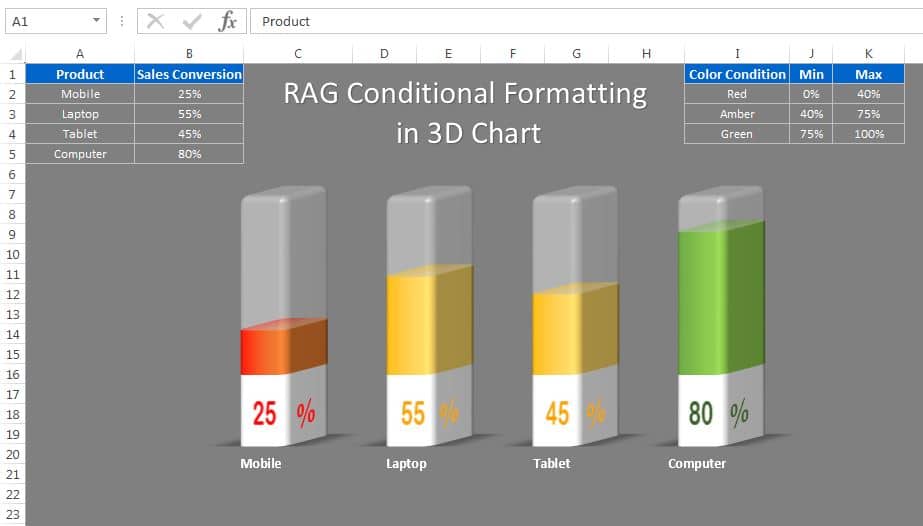
RAG Conditional Formatting in 3D Chart
Charts and Visualization

RAG Conditional Formatting in 3D Chart

March 10, 2020March 5, 2025 PKComments Off on RAG Conditional Formatting in 3D Chart
In this article, we have created a beautiful 3D chart to display the Sales conversion for different products. We have used RAG (Red, Amber and Green) Conditional Formatting in this
Read More
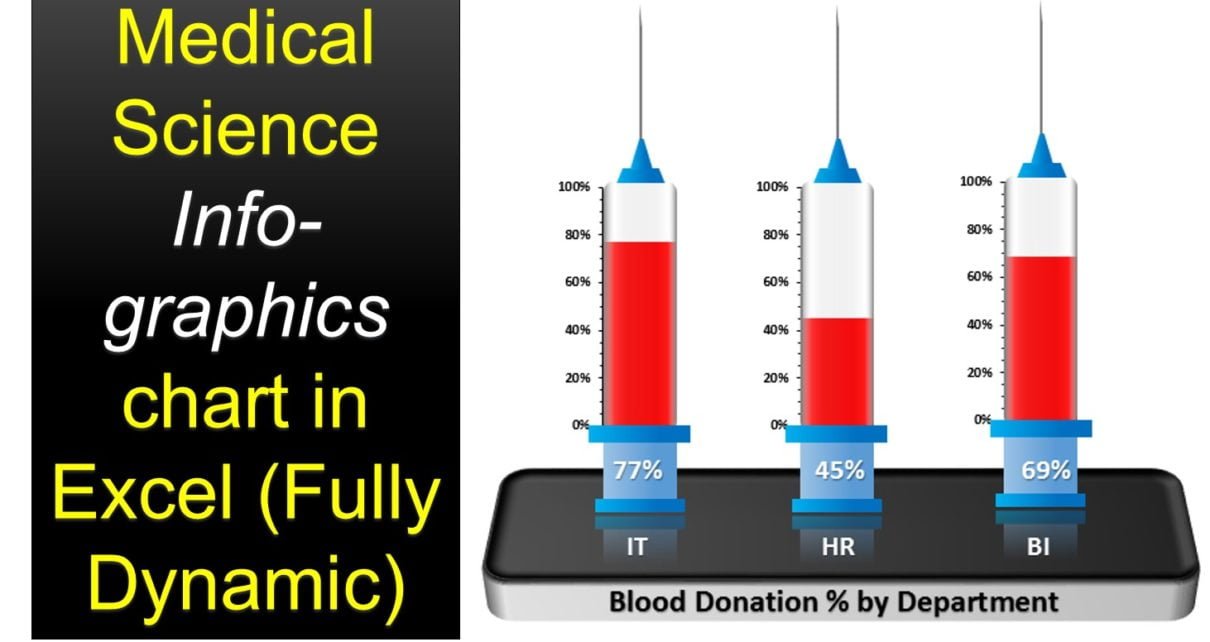
Medical Science Info-graphic Chart
Charts and Visualization

Medical Science Info-graphic Chart in Excel

February 23, 2020March 3, 2025 PKComments Off on Medical Science Info-graphic Chart in Excel
In this article, we have created a beautiful Medical Science info-graphic chart in Excel. We have displayed department wise blood donation% using this info-graphic in excel only. We have not
Read More
Drill Down in Pivot Chart with Power Pivot Hierarchy in Excel
Power Pivot Charts and Visualization

Drill Down in Pivot Chart with Power Pivot Hierarchy in Excel

January 6, 2020October 9, 2026 PKComments Off on Drill Down in Pivot Chart with Power Pivot Hierarchy in Excel
A drill down in a Pivot Chart lets you start with a big-picture chart and double-click any slice to see what is inside it, level by level. In this tutorial
Read More
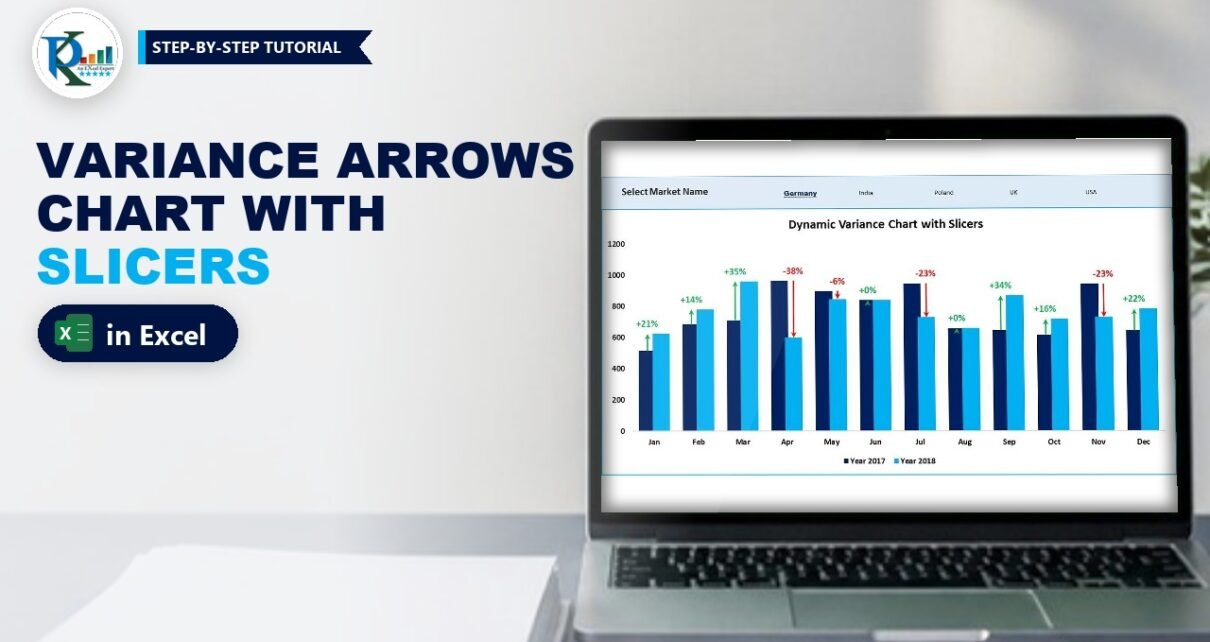
Dynamic Variance Arrows Chart with Slicers in Excel
Charts and Visualization

Dynamic Variance Arrows Chart with Slicers in Excel

August 29, 2019October 9, 2026 PKComments Off on Dynamic Variance Arrows Chart with Slicers in Excel
A dynamic variance arrows chart with slicers compares this year with last year month by month, draws a green up arrow or a red down arrow over each pair of
Read More
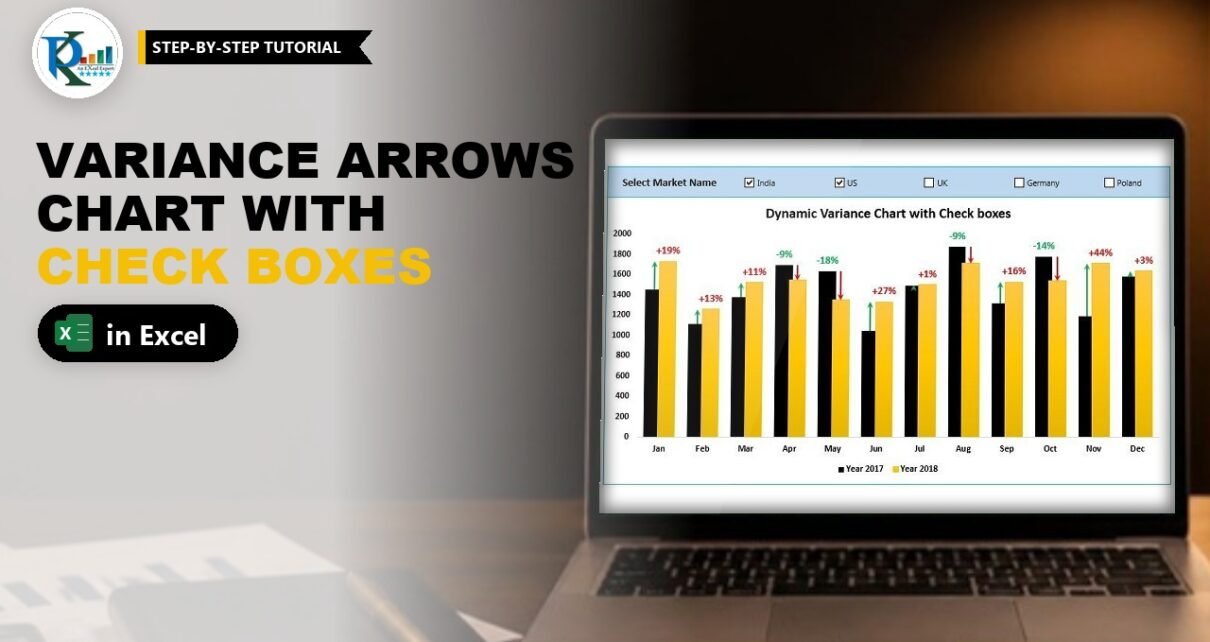
Dynamic Variance Arrows Chart with Check Boxes in Excel
Charts and Visualization

Dynamic Variance Arrows Chart with Check Boxes in Excel

August 27, 2019October 9, 2026 PKComments Off on Dynamic Variance Arrows Chart with Check Boxes in Excel
A dynamic variance arrows chart with check boxes shows this year against last year for every month and puts a green up arrow or a red down arrow on top
Read More

Posts pagination

1 2 Next
  • Learn Excel (Free Course)
    • 1. Shortcut Keys
    • 2. Fill & Flash Fill
    • 3. Find & Replace
    • 4. Sort & Filter
    • 5. Formulas & Functions
    • 6. Data Validation
    • 7. Conditional Formatting
    • 8. Basic Charts
    • 9. Advanced Charts
    • 10. Pivot Tables
    • 11. Excel Dashboards
    • 12. VBA Course
    • 13. Excel Formulas with AI
  • Templates
  • Tutorials
    • Charts and Visualization
    • VBA
    • Excel Tips and Tricks
    • Excel Dashboards
    • Power Pivot & DAX
  • Power BI
  • Template Store
    • Ready to Use Templates
  • Courses
  • Academy
    • Excel + AI Mastery: 100 Formulas
    • Excel Pivot Tables & Dashboards
  • About Us
  • Contact Us
Copyright © 2023 PK-AnExcelExpert.com - Privacy Policy