Podcast production economics have flipped. Downloads are no longer the only metric that matters — revenue per listener, cost per episode, completion rate, and subscriber velocity are what separate a growing show from one silently bleeding cash. The Podcast Analytics Dashboard in Excel is a ready-to-use template that pulls all of those signals into 5 interactive pages and 5 headline KPIs, so any podcaster, network operator, or agency can answer the “is this show profitable?” question in under 10 minutes per week.
According to Edison Research’s Infinite Dial, over 135 million Americans are monthly podcast listeners — yet fewer than 5% of independent podcasters track revenue and production cost side by side. This template closes that gap inside a plain Excel workbook.
Podcast Analytics Dashboard
Introduction to the Podcast Analytics Dashboard in Excel
The Podcast Analytics Dashboard in Excel is a pivot-driven Excel workbook that consolidates podcast-level performance data into 5 analytical pages plus a Data Sheet and a hidden Support Sheet. It is designed for podcasters, network operators, agencies, and in-house content marketing teams who need download, revenue, audience, and profitability analysis in one file — without paying $40–$300 per month for a SaaS podcast analytics platform.
Key Features of the Podcast Analytics Dashboard in Excel
🔹 5 interactive report pages covering Overview, Audience Insights, Revenue Analysis, Performance Trend, and Content Analysis.
🔹 5 headline KPI cards — Total Downloads, Total Revenue, Total Unique Listeners, Net Profit, and Total Subscribers — all update live when filters change.
🔹 20+ analytical charts across the five pages, each bound to a pivot table on the Support Sheet for dynamic refresh.
🔹 Multi-dimension slicers on platform, category, podcast name, host, season, and month for instant drill-down without formulas.
🔹 Revenue vs. production cost visibility by platform and by podcast — exposes unprofitable shows immediately.
🔹 No VBA, no macros — built with native Excel pivots, slicers, and charts. Works in Excel 2016, 2019, Microsoft 365, and Excel Online.
Dashboard Pages Explanation
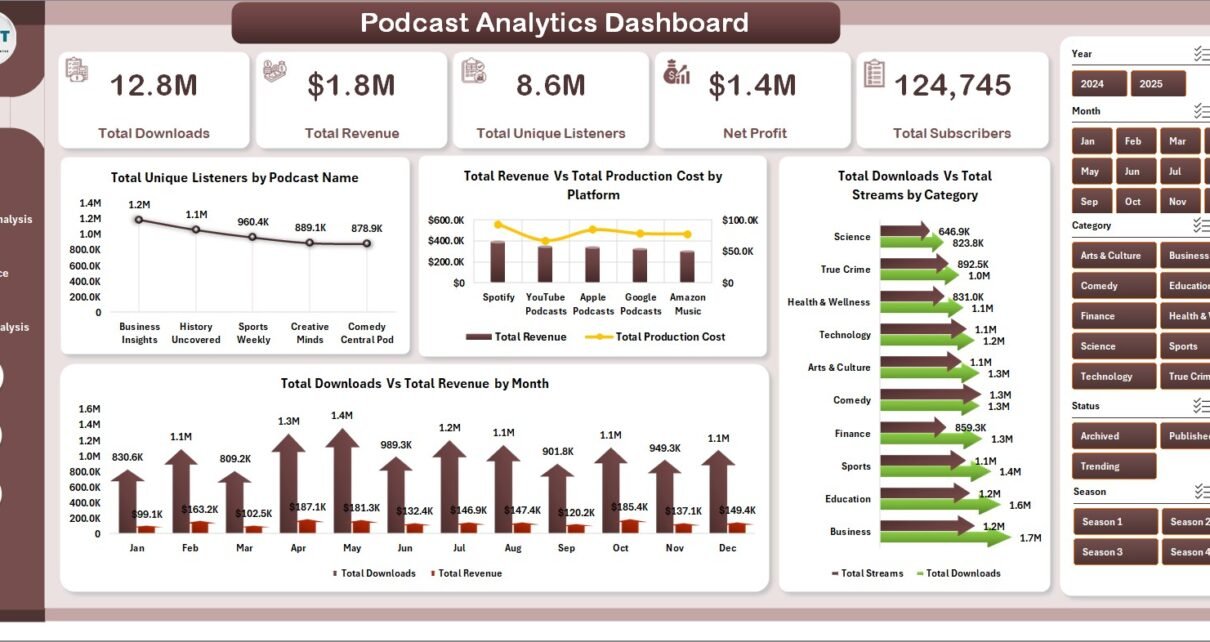
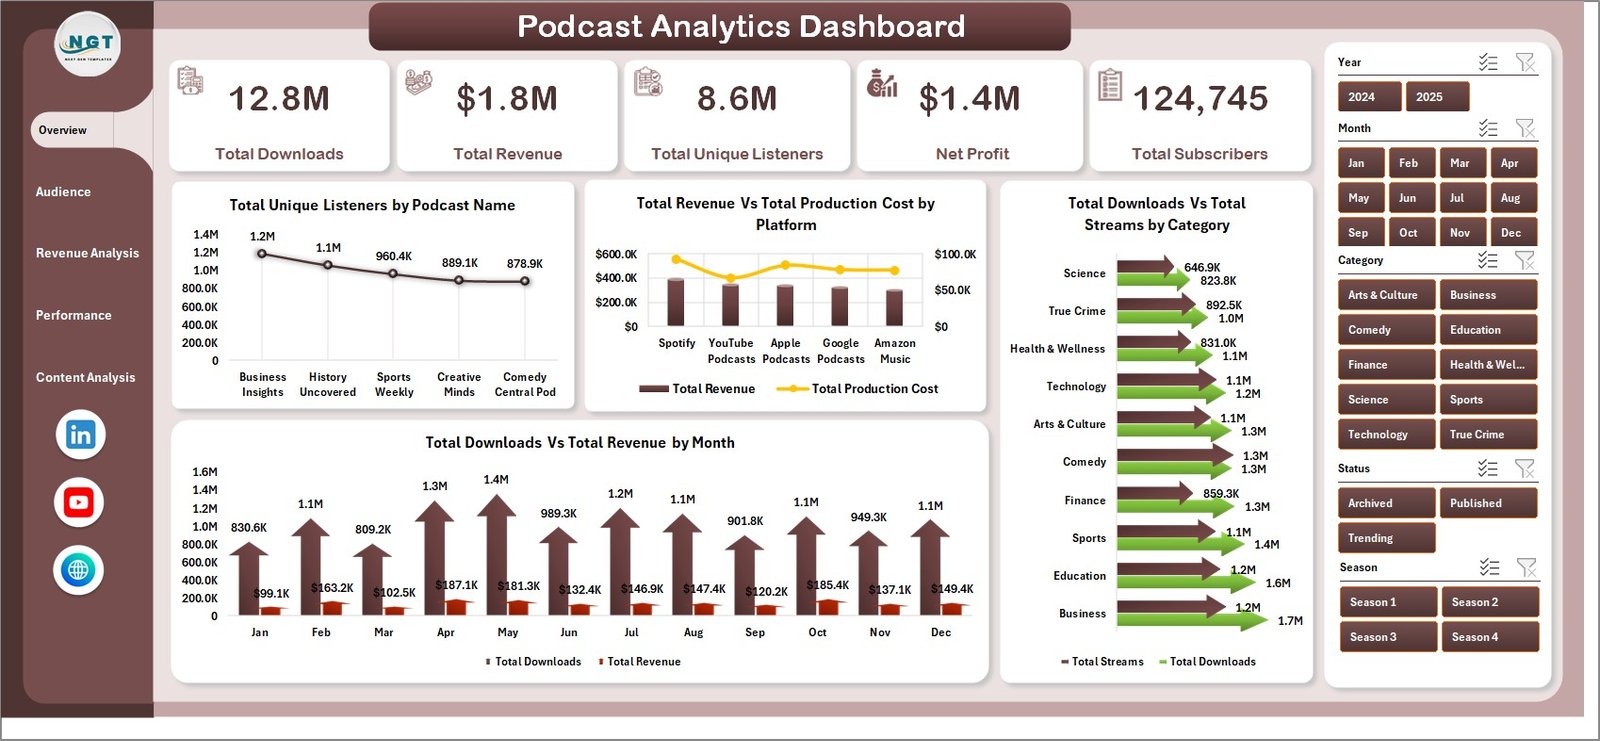
1. Overview Page
The landing page shows 5 KPI cards at the top — Total Downloads, Total Revenue, Total Unique Listeners, Net Profit, and Total Subscribers — followed by 4 summary charts:
🔹 Total Unique Listeners by Podcast Name — reveals which shows attract the biggest distinct audience.
🔹 Total Revenue Vs Total Production Cost by Platform — shows which distribution platforms are profitable vs. which ones burn budget.
🔹 Total Downloads Vs Total Streams by Category — contrasts download-first vs. stream-first consumption per category.
🔹 Total Downloads Vs Total Revenue by Month — a dual-series trend proving whether audience growth is converting into revenue growth.
Audience Insights
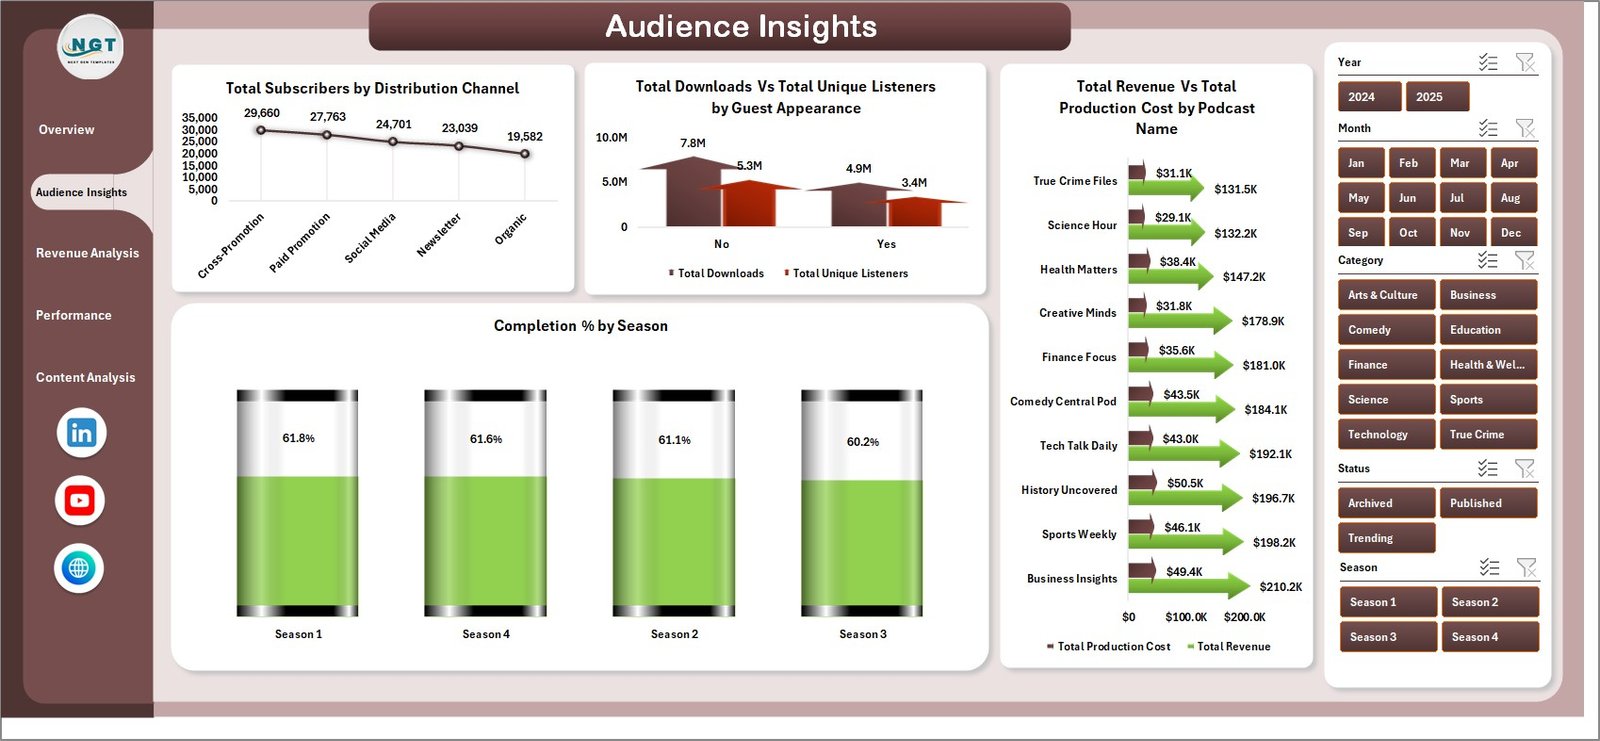
2. Audience Insights
Four analyses that profile the listener base: Total Subscribers by Distribution Channel, Total Downloads Vs Total Unique Listeners by Guest Appearance, Total Revenue Vs Total Production Cost by Podcast Name, and Completion Percentage by Season. Together, these quantify the real lift each guest delivers and expose format fatigue at the season level.
Revenue Analysis
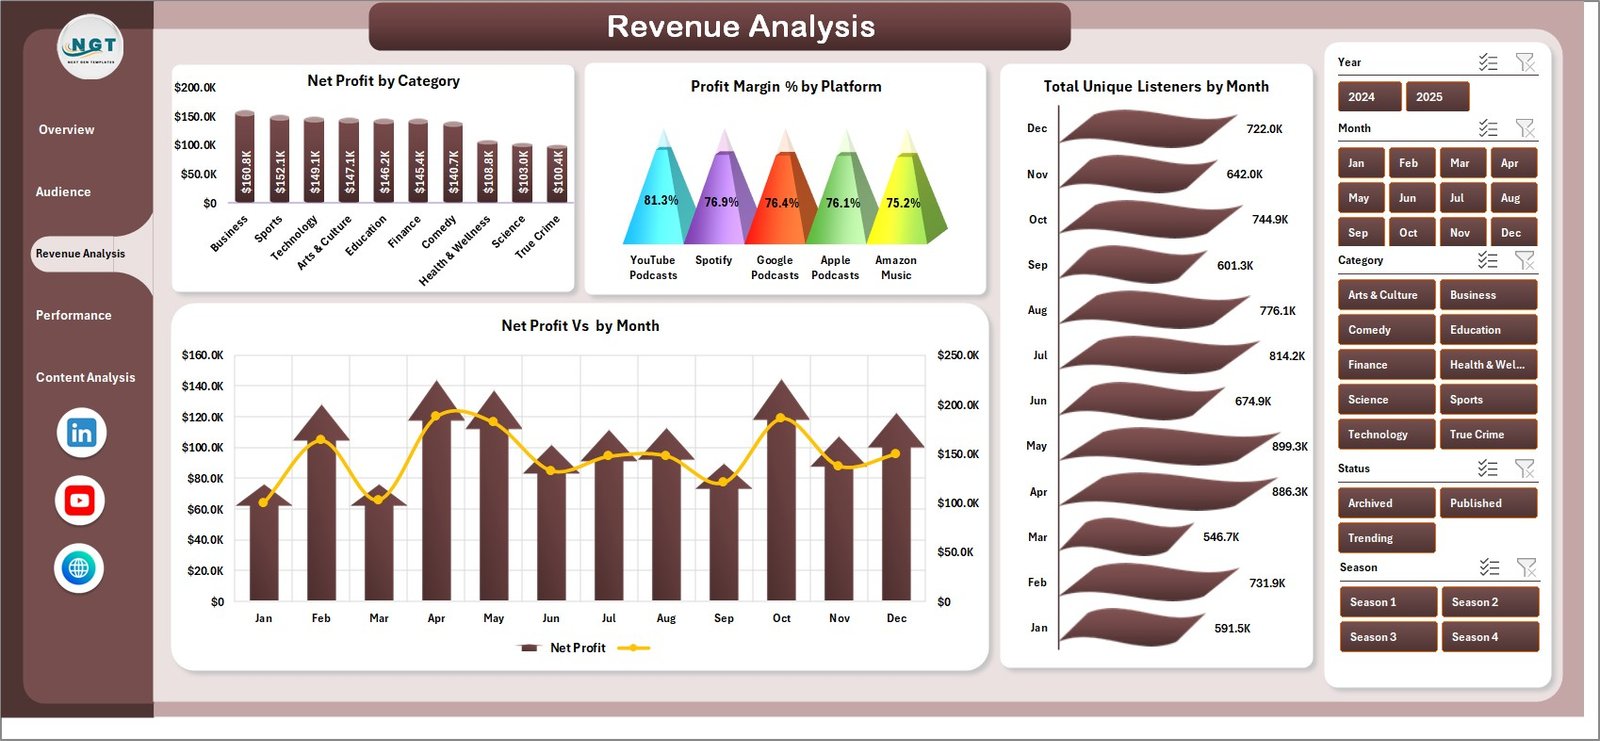
3. Revenue Analysis
Four monetization-focused charts: Net Profit by Category, Profit Margin Percentage by Platform, Total Unique Listeners by Month, and Net Profit by Month. This page answers the single most important question for paid podcast operations — is the monetization curve scaling in step with the audience curve?
Performance Trend
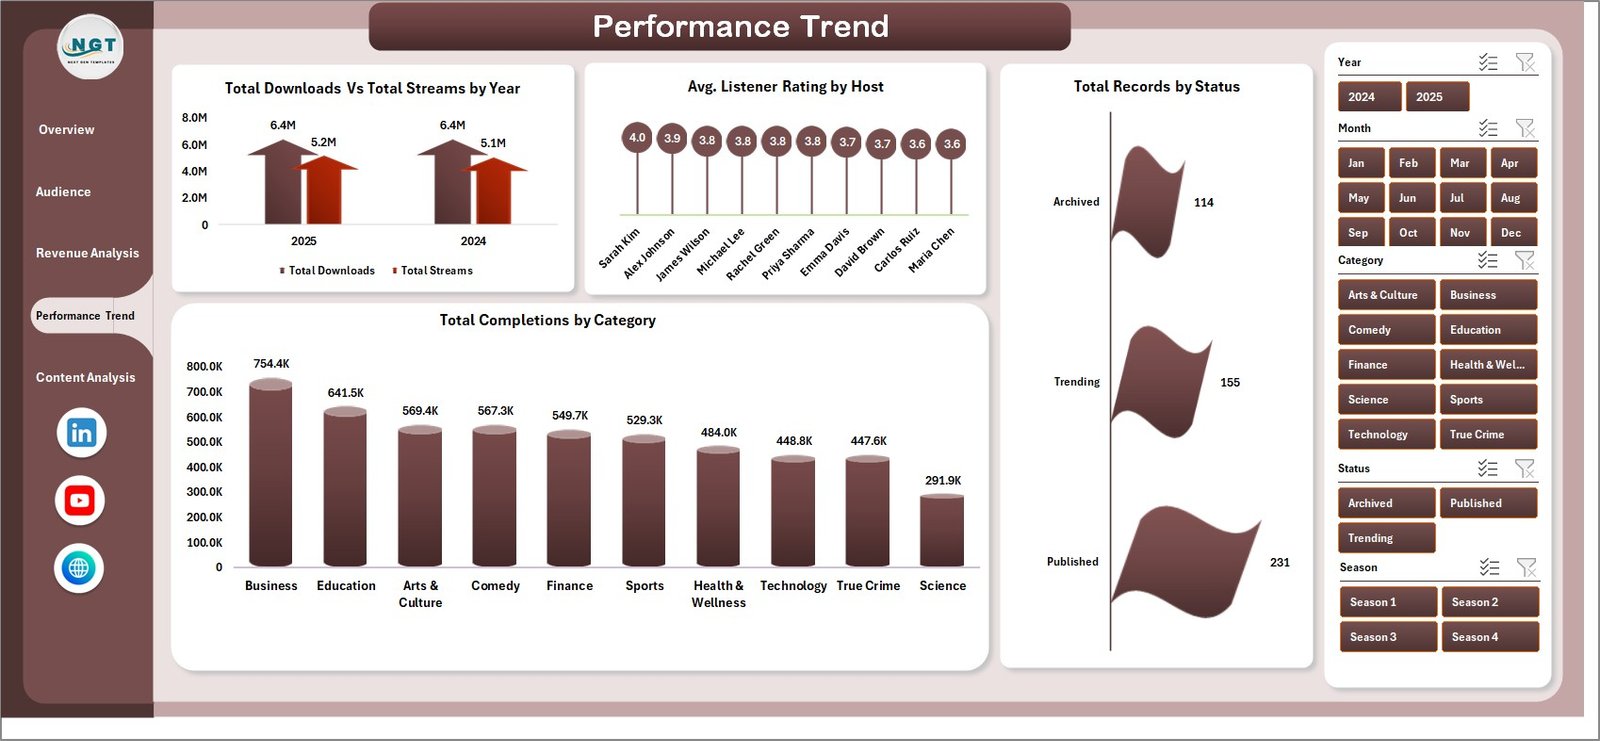
4. Performance Trend
Long-term operational review with Total Downloads Vs Total Streams by Year, Avg Listener Rating by Host, Total Records by Status, and Total Completions by Category. This page is where yearly planning, host evaluation, and category greenlighting decisions happen.
Content Analysis
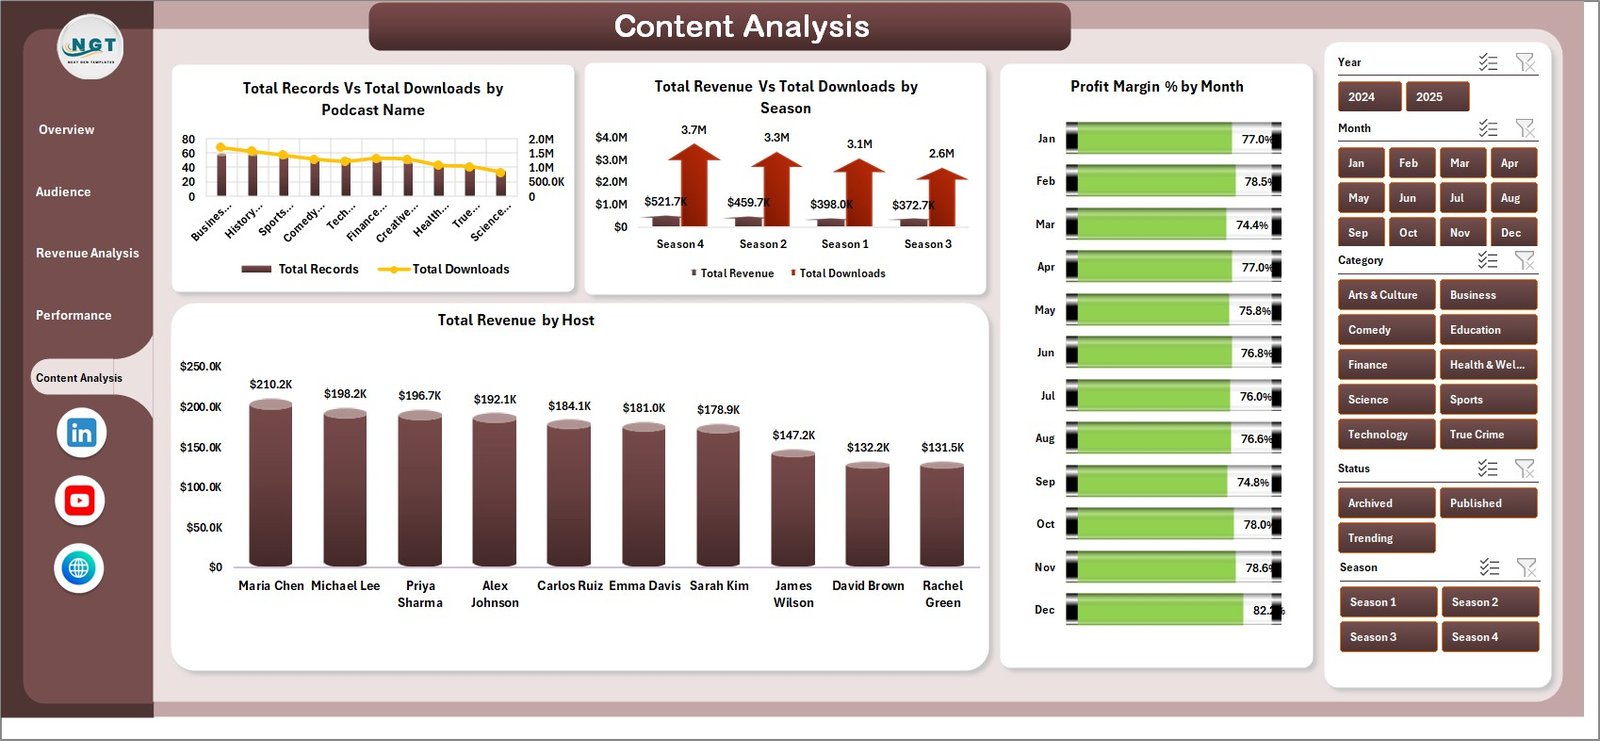
5. Content Analysis
Four editorial-focused views: Total Records Vs Total Downloads by Podcast Name, Total Revenue Vs Total Downloads by Season, Profit Margin Percentage by Month, and Total Revenue by Host. Links content output volume directly to commercial outcomes.
Data Sheet tab
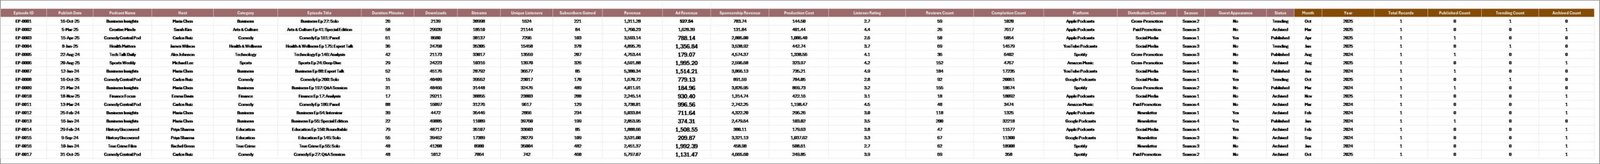
6. Data Sheet Tab
The structured input surface. Columns include platform, category, podcast name, host, season, downloads, streams, revenue, production cost, listener rating, completions, subscribers, unique listeners, month, year, and status. Paste your own podcast host export here in the same format and every downstream visual updates.
Support sheet tab
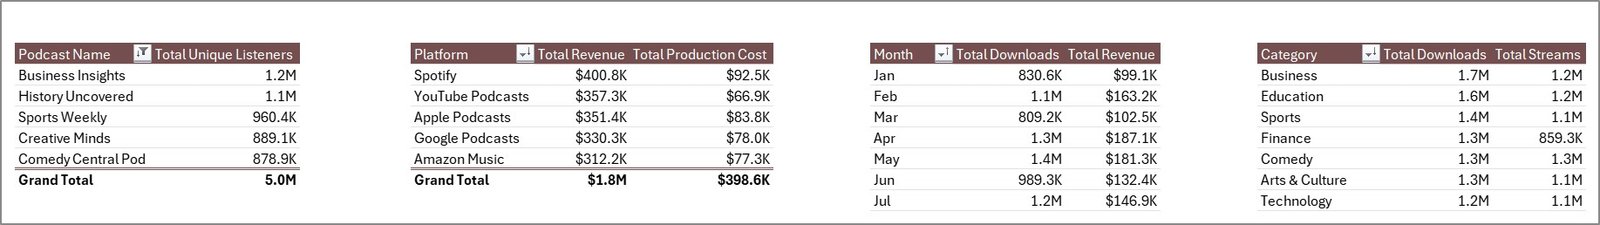
7. Support Sheet
This is the hidden pivot table layer. Every chart on every page is driven by a pivot that lives here. After pasting new data, click Data → Refresh All and every pivot, chart, and KPI card updates in seconds. Microsoft’s official pivot refresh documentation covers the exact behavior.
Who Should Use This Template
Perfect for:
- Independent podcasters with 1–10 shows
- Podcast networks managing multiple hosts and seasons
- Agency account managers building monthly client reports
- Content marketing leads inside B2B companies running a branded podcast
- Finance controllers tying podcast P&L into company Excel workflows
Not a fit if:
- You need IAB-certified real-time feed tracking (use Podtrac)
- You don’t have Microsoft Excel — consider a Google Sheets alternative
- You want fully automated API ingestion instead of paste-and-refresh
Real-World Use Cases
Maya runs a 3-show indie podcast network. Every Monday she pastes the prior week’s Spotify and Apple exports into the Data Sheet, clicks Refresh All, and reviews which show drove the highest Net Profit, which host pulled the best Avg Listener Rating, and which guest appearance spiked downloads — a 15-minute routine that replaced a $99/month SaaS subscription.
Rahul leads content marketing at a 200-person B2B SaaS company. His branded podcast runs on both Spotify and YouTube. He uses the Total Revenue Vs Total Production Cost by Platform chart to show his CMO that the YouTube podcast arm is delivering a 3.2x profit margin advantage over Spotify-only distribution — data that’s driving next quarter’s budget reallocation.
Elena manages 12 client podcasts at a creative agency. She duplicates the workbook per client, feeds each one its own export, and uses the Completion Percentage by Season and Profit Margin Percentage by Platform charts in her quarterly retention conversations. Client churn dropped noticeably after she started showing profitability data in review meetings.
Advantages of the Podcast Analytics Dashboard in Excel
🔹 One-time $17.99 vs. recurring $40–$300/month SaaS bills.
🔹 Full data ownership — your listener and revenue data stays in your OneDrive or local drive.
🔹 Runs offline — no vendor uptime dependency for monthly client reports.
🔹 Fully customizable — add rows, add KPIs, add entire pages without asking a vendor.
🔹 Native Excel means zero learning curve for finance and marketing teams that already live in Excel.
🔹 Explore more Excel Dashboard Templates and the wider Power BI Dashboards catalog on NextGenTemplates.
Opportunities for Improvement
🔹 No automated API ingestion. You paste data in manually — a real podcast SaaS will ingest from Spotify/Apple via API.
🔹 No real-time dashboards. Data is as fresh as your last paste; for intraday refresh, a Power BI model with scheduled refresh is better — see the Podcast Platforms Dashboard in Power BI.
🔹 Single-user local file unless hosted on OneDrive with co-authoring; multi-user live editing is smoother in the Google Sheets version.
Best Practices
🔹 Standardize column headers before pasting — match the Data Sheet schema exactly or pivots will break.
🔹 Refresh All weekly rather than daily — podcast downloads stabilize 72 hours after publish, so weekly cadence gives cleaner trend lines.
🔹 Hide the Support Sheet before sharing the workbook with clients or executives.
🔹 Save a fresh copy per client if you’re an agency — don’t overwrite last month’s data.
🔹 Use slicer Report Connections to link new custom charts to existing filters — see the Content Creator Revenue Dashboard tutorial for step-by-step screenshots.
Explore Relevant Templates
🔹 Content Creator Revenue Dashboard in Excel — Track YouTube, podcast, sponsorship, and course revenue side by side.
🔹 Audio Streaming Services Dashboard in Excel — Complements this template with Spotify and Apple Music streaming metrics.
🔹 Podcast Platforms Dashboard in Power BI — The Power BI variant for teams preferring Power BI.
🔹 Content Creator Revenue Dashboard in Power BI — Cross-platform creator revenue analytics in Power BI.
🔹 Purchase the template directly: Podcast Analytics Dashboard in Excel.
Frequently Asked Questions
What KPIs does the Podcast Analytics Dashboard in Excel track?
The Podcast Analytics Dashboard in Excel tracks 5 headline KPIs — Total Downloads, Total Revenue, Total Unique Listeners, Net Profit, and Total Subscribers — plus 20+ supporting analyses across platform, category, podcast name, host, season, and month dimensions.
How long does the Podcast Analytics Dashboard in Excel take to set up?
Setup typically takes under 10 minutes. Replace the sample rows on the Data Sheet with your own podcast export in the same column format, click Refresh All on the Data ribbon, and every chart and KPI updates automatically. No formulas to edit.
How does the Podcast Analytics Dashboard in Excel compare to Chartable or Podtrac?
The Podcast Analytics Dashboard in Excel is a $17.99 one-time purchase with full local data ownership and fully editable charts. Chartable and Podtrac are subscription SaaS platforms at $40–$300 per month that offer real-time feed tracking but lock your data inside their platform.
Can I import data directly from Spotify for Podcasters or Apple Podcasts Connect?
Yes — both platforms let you download CSV exports from their analytics dashboards. Paste the export into the Podcast Analytics Dashboard in Excel Data Sheet matching the existing column order, then click Refresh All. There is no live API connection; it is a paste-and-refresh workflow.
Does the Podcast Analytics Dashboard in Excel use macros or VBA?
No. The Podcast Analytics Dashboard in Excel is 100% native Excel — pivot tables, slicers, and standard charts. It opens cleanly in Excel 2016, Excel 2019, Microsoft 365, and Excel Online without any macro security warnings.
Can I add my own custom charts and KPIs?
Yes. All pivot tables live on the unprotected Support Sheet. You can build new pivots from the same Data Sheet, drop additional charts onto any page, and connect them to the existing slicers via right-click → Report Connections. The workbook is fully editable.
Can I track podcast ad revenue and sponsorship deals separately in this template?
Yes. The Revenue column in the Data Sheet accepts any revenue type — ads, sponsorships, Patreon, tips — and the Category column can segment them (ads, sponsorship, subscription). The Revenue Analysis page will then break out Net Profit by Category automatically.
About the Author
Built by PK — Microsoft Certified Professional with 15+ years of Excel, Google Sheets, and Power BI experience. Founder of NextGenTemplates, reaching 300K+ subscribers across YouTube channels. Every template is hand-built and tested before release.
Conclusion
The Podcast Analytics Dashboard in Excel turns a scattered podcast export file into a professional, filter-driven analytics cockpit in under 10 minutes. 5 KPIs, 5 pages, 20+ charts, and a pivot-driven architecture mean you get real profitability insight without learning a new SaaS tool or paying a monthly subscription.
👉 Click here to Purchase the Podcast Analytics Dashboard in Excel
✅ Instant download · One-time payment · No subscription · Lifetime access
🎥 Visit our YouTube channel for step-by-step tutorials: Youtube.com/@PK-AnExcelExpert