Photography studios face a unique data challenge: bookings flow from multiple channels, revenue depends on service type and package, and photographer performance varies dramatically — yet most studios track all of this in scattered spreadsheets. The Photography Business Dashboard in Power BI solves this by consolidating 5 KPI cards and 15 charts across 5 interactive pages, giving studio owners and operations managers a single source of truth for booking performance, service analytics, photographer benchmarking, and profitability by region and city. Setup takes under 10 minutes in Power BI Desktop — free to download from Microsoft.
🌍 Join 8,400+ teams in 40+ countries using NextGenTemplates to replace paid SaaS subscriptions with one-time-purchase Power BI, Excel, Google Sheets, and HTML templates.
✅ Instant download · One-time payment · No subscription · No per-user fees · Lifetime access
Key Features of Photography Business Dashboard in Power BI
5 KPI Summary Cards on the Overview Page — Total Bookings, Total Revenue, Total Cost, Net Profit, and Average Satisfaction Score appear at the top of the Overview page. These five metrics give photography studio owners an at-a-glance health check before diving into page-level analysis. The Photography Business Dashboard in Power BI calculates all five automatically when data is refreshed — no manual formulas or pivot adjustments needed.
15 Pre-Built Interactive Charts — Spread across 5 dedicated analysis pages, the dashboard delivers 3 charts per page covering booking channels, payment status, service types, photographer revenue-per-hour, cancellation rates, and regional profitability. Every chart responds instantly to slicer selections.
Dynamic Slicers for Filtered Views — Each page includes slicers that let you filter by booking channel, package type, region, service type, client type, or payment status. The entire page refreshes in seconds — no formulas to edit, no manual pivoting required.
Photographer Performance Benchmarking — The dedicated Photographer page tracks Revenue per Hour, Total Photos Delivered, and Cancellation Rate by Package Type for every photographer on your team. This is the core data needed to identify top performers and optimize scheduling decisions.
Multi-Dimensional Profitability Analysis — The Profitability page breaks down Net Profit by Region, City, and Service Type simultaneously. Studio owners can pinpoint exactly which geographies and service lines generate the highest margins — and redirect resources accordingly.
Dashboard Pages Explanation
Page 1 — Overview
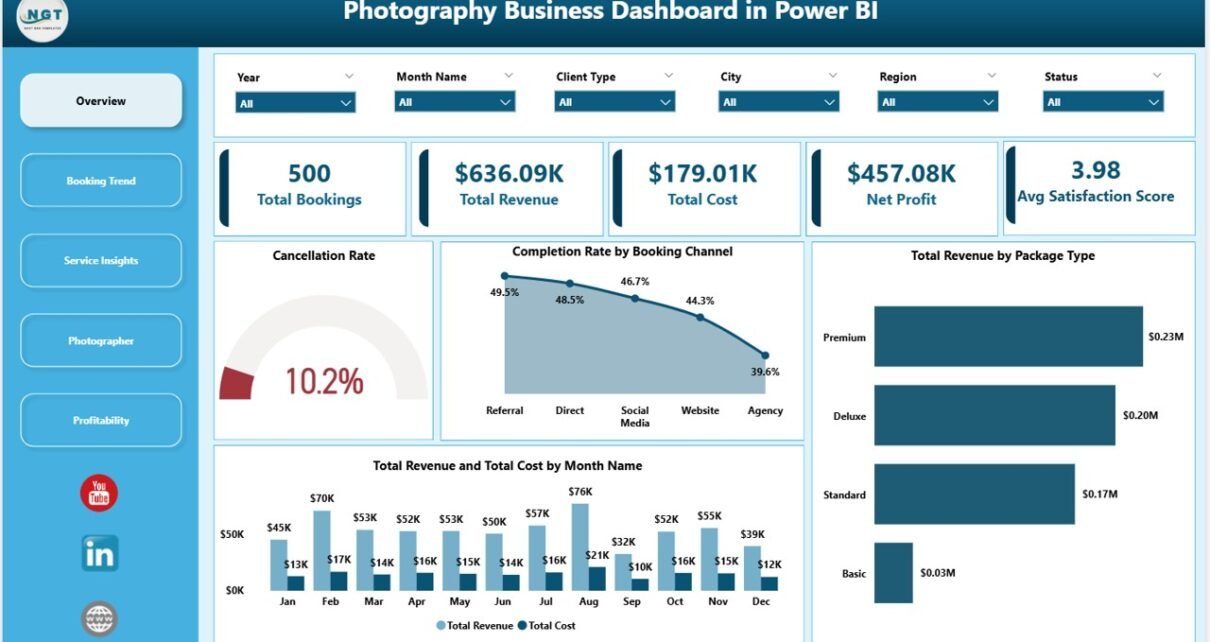
The Overview page anchors the entire Photography Business Dashboard in Power BI. At the top, five KPI cards display Total Bookings, Total Revenue, Total Cost, Net Profit, and Average Satisfaction Score — the headline numbers for any reporting period. Below, four visuals provide operational context: Cancellation Rate (gauge or percentage card), Completion Rate by Booking Channel (showing which channels deliver the most completed shoots), Total Revenue by Package Type (comparing Basic, Standard, and Premium revenue contribution), and Total Revenue and Total Cost by Month Name (a trend line revealing seasonal patterns across the calendar year). Slicers on this page allow instant filtering across all four visuals simultaneously.
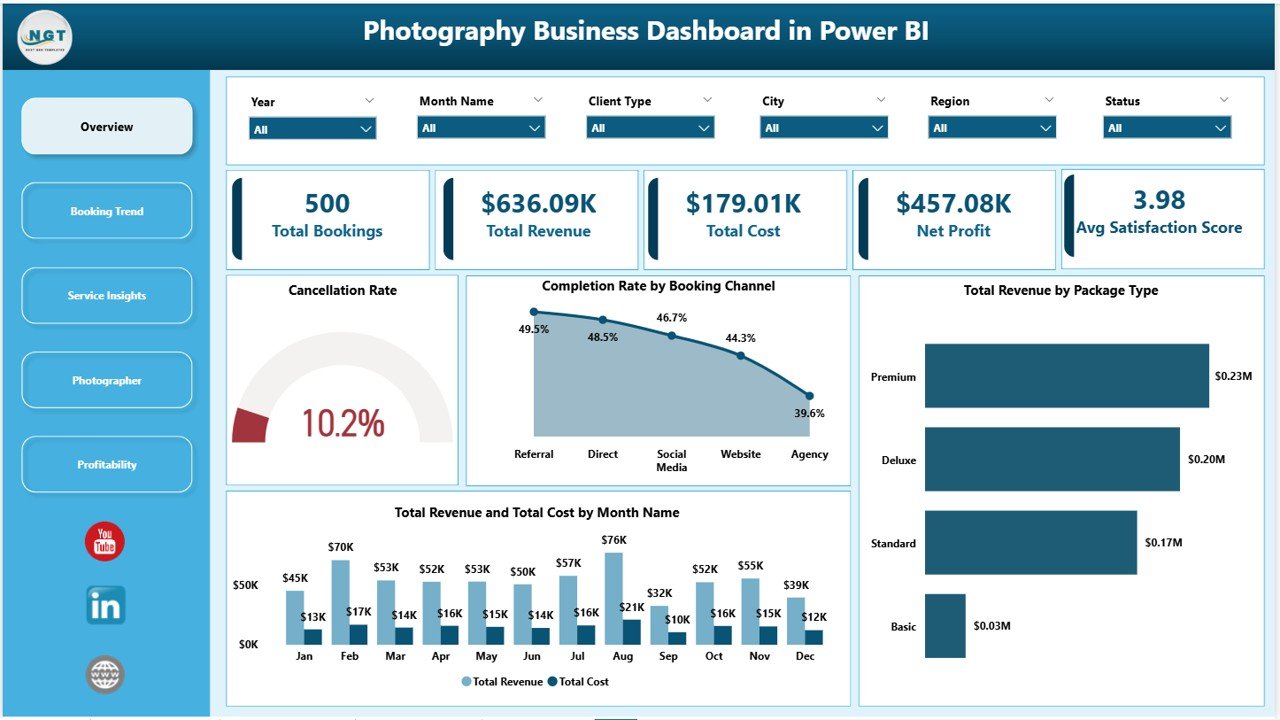
Photography Business Dashboard in Power BI – Overview Page
Page 2 — Booking Trend
The Booking Trend page drills into the booking pipeline with three focused analyses. Total Bookings by Payment Status reveals whether paid, pending, or refunded bookings dominate the mix — a critical input for cash flow forecasting. Total Revenue by Booking Channel shows which acquisition channels (Instagram, referrals, website, walk-in) generate the most revenue, enabling smarter marketing spend. Profit Margin by Region surfaces geographic performance disparities that are invisible in aggregate reporting.
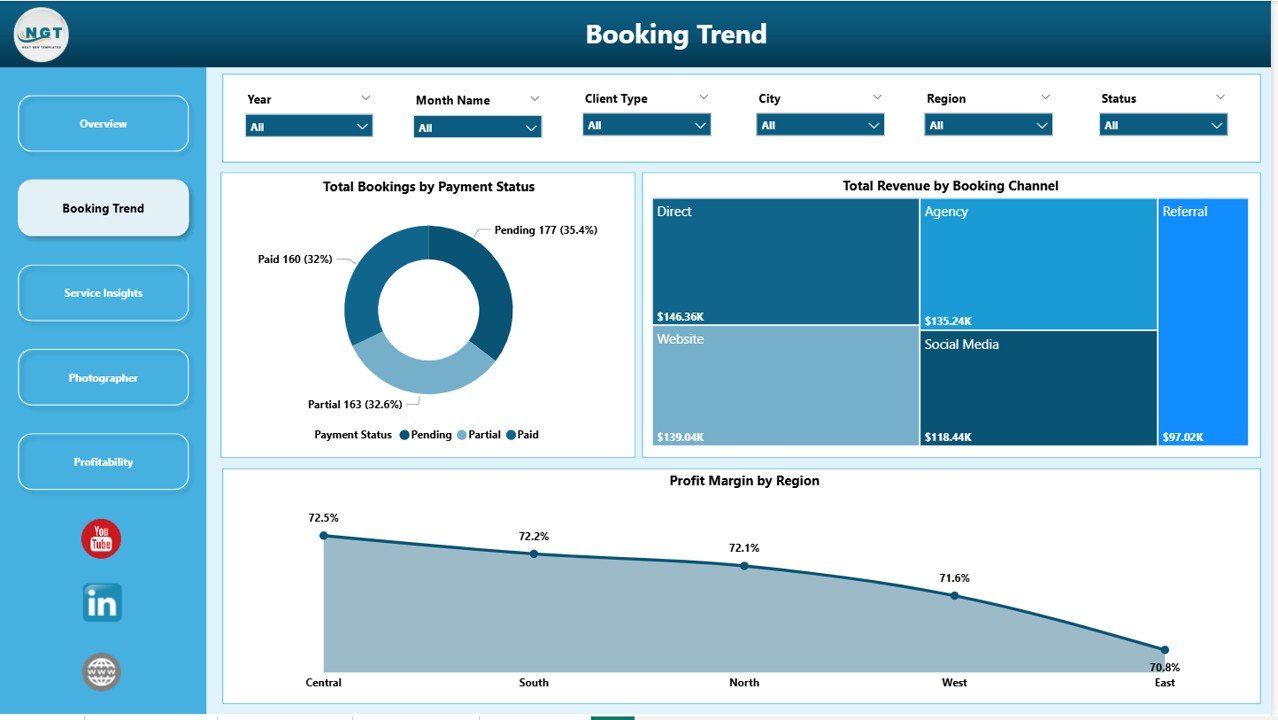
Photography Business Dashboard in Power BI – Booking Trend Page
Page 3 — Service Insights
The Service Insights page answers the most common photography business question: which services should we grow, and which should we reduce? Profit Margin by Client Type compares corporate, individual, and agency client segments. Total Bookings by Service Type shows whether weddings, portraits, commercial, events, or newborn shoots dominate volume. Total Revenue and Total Cost by Service Type completes the picture by revealing which service lines generate the widest spread between revenue and cost — your true profit drivers.
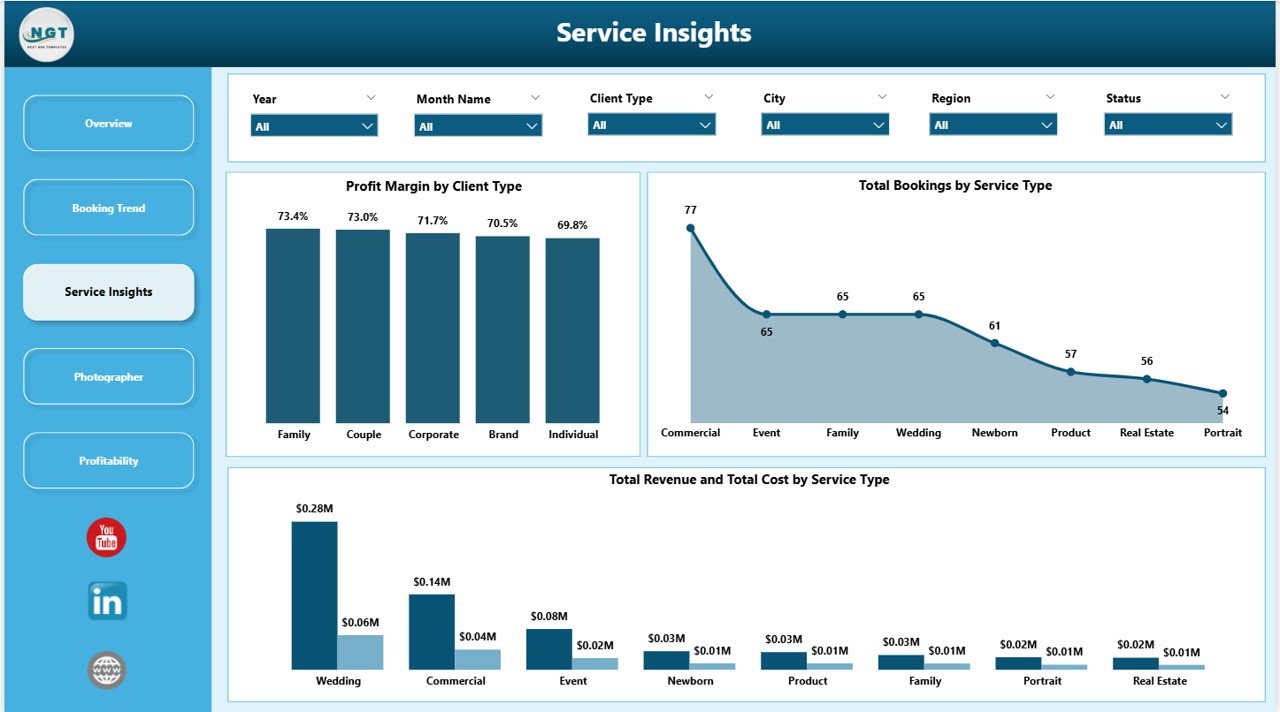
Photography Business Dashboard in Power BI – Service Insights Page
Page 4 — Photographer
The Photographer page is the most operationally impactful section of the Photography Business Dashboard in Power BI. Cancellation Rate by Package Type helps identify whether certain packages attract less reliable clients or require clearer booking terms. Total Photos Delivered by Photographer measures output efficiency across the team. Revenue per Hour by Photographer is the definitive performance benchmark — identifying who generates the most value per hour worked and who might benefit from training or rebooking on more suitable package types.
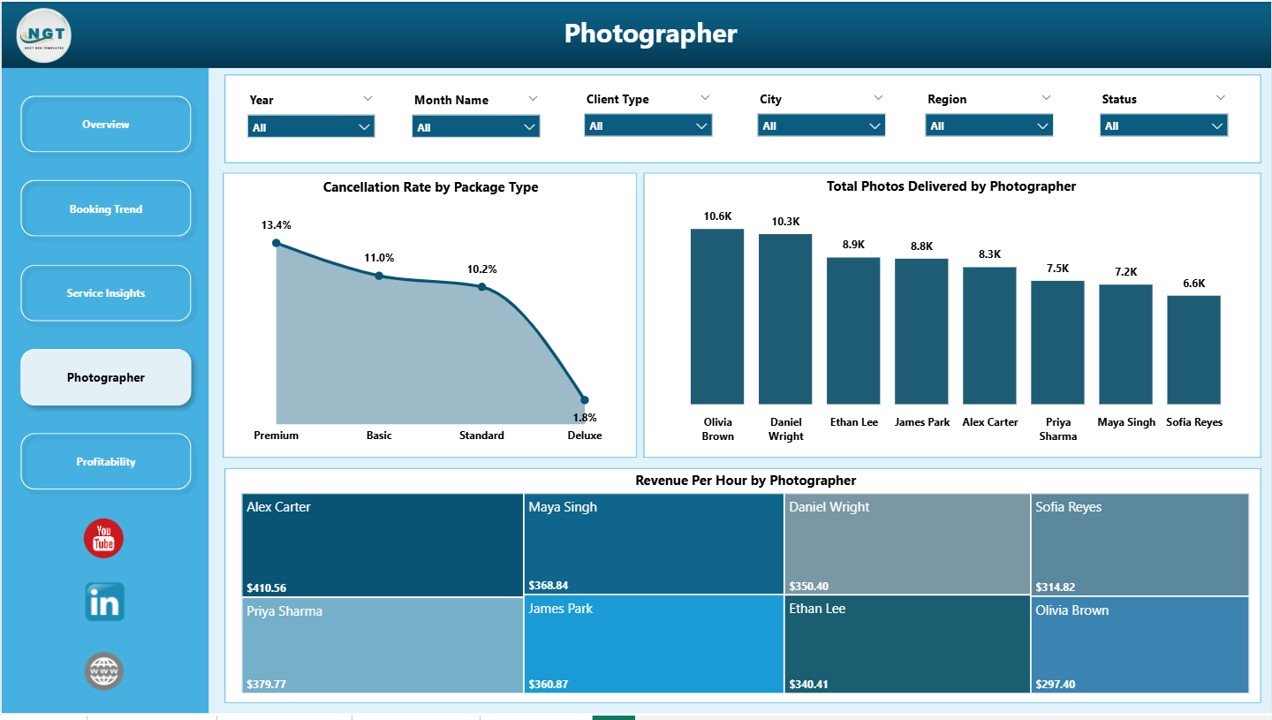
Photography Business Dashboard in Power BI – Photographer Performance Page
Page 5 — Profitability
The Profitability page delivers the geographic and service-level breakdown that studio owners use for strategic planning. Net Profit by Region and Net Profit by City show exactly where the business makes money across its operating footprint. Profit Margin by Service Type completes the picture, confirming whether the services with the highest booking volume also generate the highest margins — or whether a low-volume premium service is actually driving most of the profit.
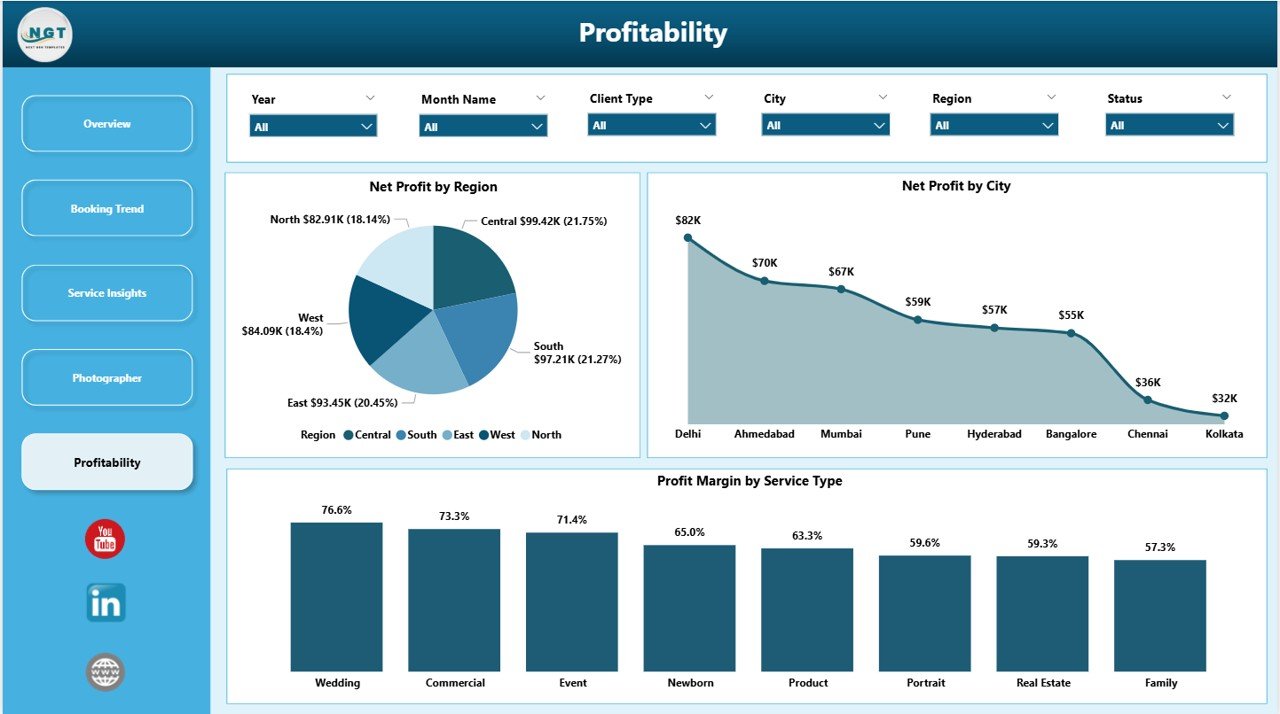
Photography Business Dashboard in Power BI – Profitability Page
Photography Business Dashboard in Power BI vs. Google Sheets Tracker vs. Studio Ninja — Feature Comparison
| Feature | Photography Business Dashboard in Power BI | Google Sheets Photography Tracker | Studio Ninja / HoneyBook |
|---|---|---|---|
| Cost | $17.99 one-time ✅ | Free–$15 one-time | $35–$79/month |
| Platform | Power BI Desktop ✅ | Browser (Google Sheets) | Web SaaS |
| Setup time | Under 10 minutes ✅ | 15–30 minutes | 1–2 hours |
| Interactive charts & slicers | 15 charts + dynamic slicers ✅ | Basic charts only | Limited reporting |
| Photographer-level performance | Revenue/hr, photos, cancellations ✅ | Manual only | Basic job tracking |
| Profitability by city & region | Included ✅ | Not available | Not available |
| One-time payment | Yes ✅ | Yes | ❌ Subscription |
| Year-1 cost at 5 users | $17.99 ✅ | $0–$50 | $420–$948 |
For photography studios that want professional Power BI analytics without ongoing SaaS fees, the Photography Business Dashboard in Power BI is the clear value choice.
Who Should Use This Template
Perfect for:
- Photography studio owners managing 2–15 photographers across multiple cities or regions
- Freelance photographers who track monthly revenue, cost, and booking channel performance
- Wedding, commercial, portrait, and events photography businesses with consistent booking volume
- Operations managers who produce monthly or quarterly business performance reports
- Photography business owners evaluating which service lines to expand or discontinue
Not a fit if:
- You need a full CRM with contracts, invoicing, and client communication built in
- You run a hobbyist operation with fewer than 10 bookings per month
- Your team requires live simultaneous multi-user access (requires Power BI Service/Pro)
Real-World Use Cases
Sarah owns a wedding photography studio in Dallas with 4 photographers. Before using the Photography Business Dashboard in Power BI, she reviewed monthly revenue in a spreadsheet with no channel breakdown. Now she sees at a glance that Instagram-sourced bookings generate 28% of revenue but carry a 19% cancellation rate — while referral bookings cancel at under 5%. She reallocated her ad budget toward referral incentives within one quarter.
Marcus runs a commercial photography operation across Austin, Houston, and San Antonio. The Profitability page revealed that Austin bookings generate an average profit margin 22% higher than his other two cities, driven by corporate clients on premium packages. He used this data to hire a dedicated sales coordinator focused on Austin corporate accounts.
Priya manages operations for a portrait studio with 6 photographers. The Photographer page showed her that two photographers had Revenue per Hour figures 35% below the team average — not because of lower effort, but because they were being assigned lower-margin package types. Reassigning them to Standard and Premium bookings brought their per-hour figures in line with the team within 8 weeks.
Advantages of Photography Business Dashboard in Power BI
- Five-page analytics depth that most photography studios never achieve without custom software
- Photographer-level benchmarking unavailable in spreadsheet trackers or booking CRMs like Studio Ninja
- One-time purchase that replaces $420–$948/year in SaaS analytics subscriptions
- Works in free Power BI Desktop — no licensing cost beyond the template itself
- Fully customisable — add your own service types, regions, photographers, and booking channels
- Seasonal trend tracking via the Revenue vs. Cost by Month chart on the Overview page
Opportunities for Improvement
- The template does not include CRM, contract, or invoicing functionality — it is an analytics dashboard, not a business management platform
- Multi-user live collaboration requires a Power BI Pro or Premium licence for cloud publishing via Power BI Service
- Predictive forecasting (e.g., revenue projections, cancellation probability) is not included in the base template and would require custom DAX measures
- The dashboard is optimised for desktop viewing; mobile experience in Power BI Desktop is functional but not mobile-first
Best Practices
- Refresh data at the start of each month with the previous month’s complete booking records for consistent trend tracking
- Use the Region and City slicers on the Profitability page each quarter to inform geographic pricing and staffing decisions
- Monitor Revenue per Hour by Photographer monthly and use it alongside satisfaction scores to build team compensation structures
- Compare Completion Rate by Booking Channel quarterly to shift marketing investment toward channels with the lowest cancellation rates
- Review the Profit Margin by Service Type annually when setting package pricing for the upcoming season
Explore Relevant Templates
Looking for more Power BI templates for service and creative businesses? Browse our Power BI Dashboard Templates collection or explore these related options:
- 📸 Photography Business Dashboard in Excel — The identical 5-page analysis built in Excel with pivot tables and slicers for teams not using Power BI. See the detailed walkthrough at Photography Business Dashboard in Excel blog post.
- 🖨️ Print Shop Dashboard in Power BI — Creative service business analytics for print and design studios tracking job revenue, cost, and turnaround time.
- 💍 Wedding Budget Dashboard in Power BI — A complementary dashboard for tracking wedding budgets and vendor spend — useful for event photographers serving the wedding market.
Frequently Asked Questions
What KPIs does the Photography Business Dashboard in Power BI track?
The Photography Business Dashboard in Power BI tracks 5 headline KPIs on the Overview page: Total Bookings, Total Revenue, Total Cost, Net Profit, and Average Satisfaction Score. Across the 5 pages, the dashboard also covers 15 chart-level metrics including Cancellation Rate, Revenue per Hour by Photographer, Profit Margin by Region, and Profit Margin by Service Type. All metrics update automatically when the data source is refreshed.
Do I need a Power BI Pro subscription to use this dashboard?
No. The Photography Business Dashboard in Power BI is built for Power BI Desktop, which is free to download from Microsoft. You only need a Power BI Pro or Premium subscription if you want to publish the report to Power BI Service and share it with colleagues online. Desktop-only use is 100% free beyond the one-time template purchase.
How does this compare to Studio Ninja or HoneyBook for analytics?
Studio Ninja and HoneyBook are booking CRMs focused on contracts, client communication, and invoicing — not analytics. The Photography Business Dashboard in Power BI fills the analytics gap: 15 charts, photographer-level benchmarking, and profitability by city and region. At $17.99 one-time versus $35–$79/month for those platforms, it is a significantly lower-cost analytics layer for studios that already manage bookings in a separate tool.
Can I customise the photographers, service types, and regions?
Yes. The dashboard reads from a data source you control. Replace the sample data with your real booking records — using your photographer names, service types, cities, and booking channels — and click Refresh. All 15 charts and all slicers update automatically to reflect your data. No Power BI development experience is required for standard data replacement.
Is the Photography Business Dashboard in Power BI suitable for a solo freelance photographer?
Yes, provided you have regular booking data to analyse. The Photographer page works just as well with a single photographer as with a team. The Overview, Booking Trend, Service Insights, and Profitability pages are all relevant for solo operators tracking revenue by service type, channel, and region. The dashboard becomes most valuable once you have at least 2–3 months of consistent booking records.
What file format is included in the download?
The download includes a .pbix file (Power BI Desktop format) and a sample dataset. Open the .pbix in Power BI Desktop, connect it to your own booking data source or replace the sample data directly, and click Refresh to see your actual numbers across all 5 pages and 15 charts.
About the Author
Built by PK — Microsoft Certified Professional with 15+ years of Excel, Google Sheets, and Power BI experience. Founder of NextGenTemplates, reaching 300K+ subscribers across YouTube channels (@PK-AnExcelExpert, @NextGenTemplates, @NeoTechNavigators). Every template is hand-built, tested with real data, and published only after passing a full QA review.
Conclusion
The Photography Business Dashboard in Power BI gives photography studios the five-page analytics depth that most boutique businesses only access through expensive SaaS subscriptions — at a one-time cost of $17.99. From the high-level KPI overview to photographer-level benchmarking and city-by-city profitability, it covers every dimension a studio owner needs to make informed decisions about pricing, staffing, marketing spend, and service mix.
🛝 Click here to Purchase the Photography Business Dashboard in Power BI
✅ Instant download · One-time payment · No subscription · Lifetime access
📺 Step-by-step tutorials: Youtube.com/@PK-AnExcelExpert
📅 Last updated: May 2026