If you run a laundromat, you already know the business is a moving target. Revenue fluctuates by location, machines break down when you least expect it, peak hours come and go, and customer ratings can make or break your next six months. The Laundromat Dashboard in Excel was built to bring all of that chaos into one clean, refreshable workbook so you can make better decisions in minutes, not hours. In this post we walk you through every page of the dashboard, what each chart means for a real laundromat operator, and how to plug in your own data.
Click to buy Laundromat Dashboard in Excel
This Excel dashboard template works for a single neighbourhood self-service laundry as well as a multi-location laundromat chain. It is built entirely on pivot tables, so once you paste your data and click Data > Refresh All, every chart, KPI card and slicer updates instantly — no formulas to fix, no VBA to enable. Click here to Purchase the Laundromat Dashboard in Excel.
Key Features of the Laundromat Dashboard in Excel
- 5 interactive dashboard pages covering overview, location, machine performance, customer insights and revenue trends.
- 5 KPI cards — Total Revenue, Total Records, Transactions, Avg. Customer Rating and Net Profit.
- 15+ visual charts covering service mix, machine utilisation, payment method, membership and time-slot demand.
- Dynamic slicers to filter the entire workbook by location, machine type, service type, time slot, membership or payment method.
- Support sheet with pre-built pivot tables powering every chart — you never have to rebuild anything.
- Print-ready layout for monthly operator meetings and investor reviews.
- Compatible with Excel 2016, 2019, 2021, Office 365 and Excel for Mac — no add-ins required.
Dashboard Pages Explanation
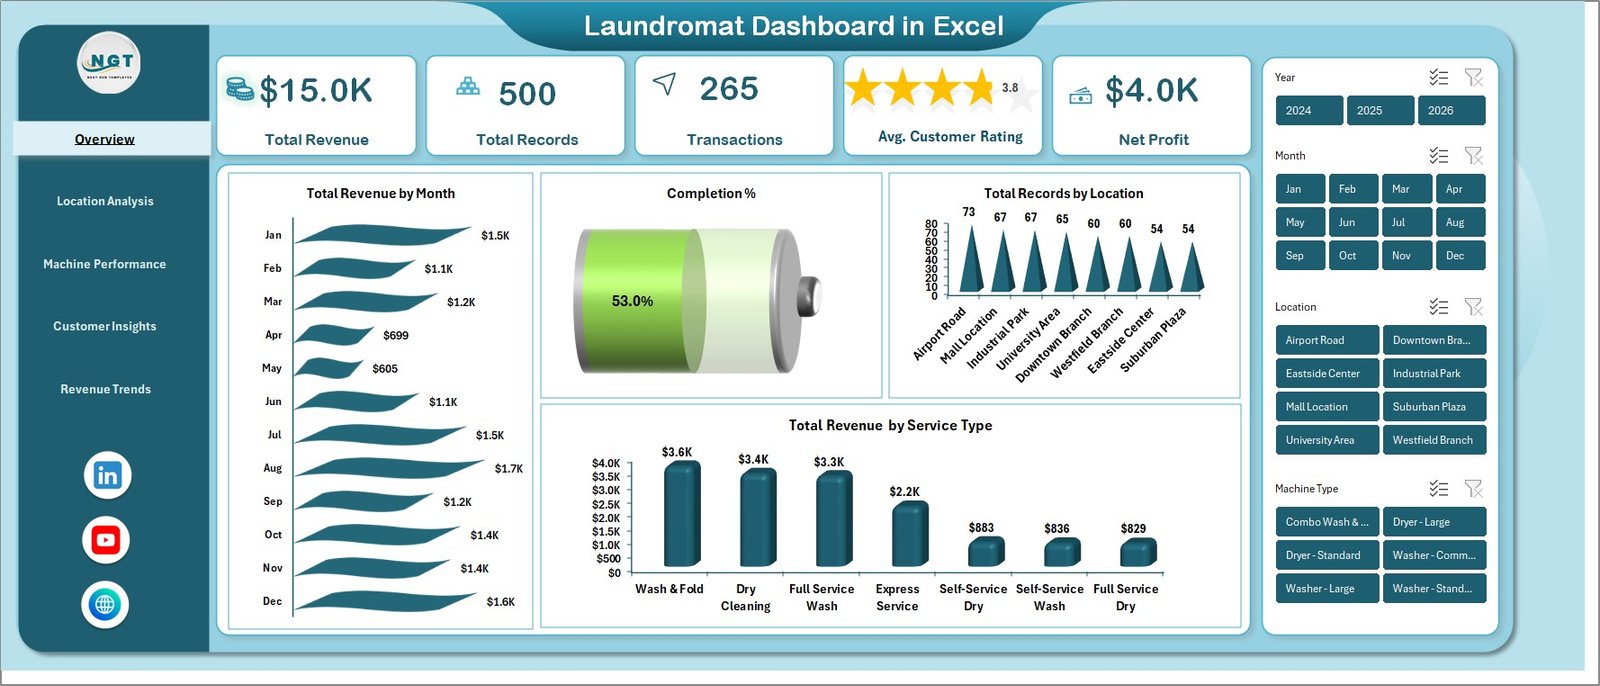
1. Overview Page
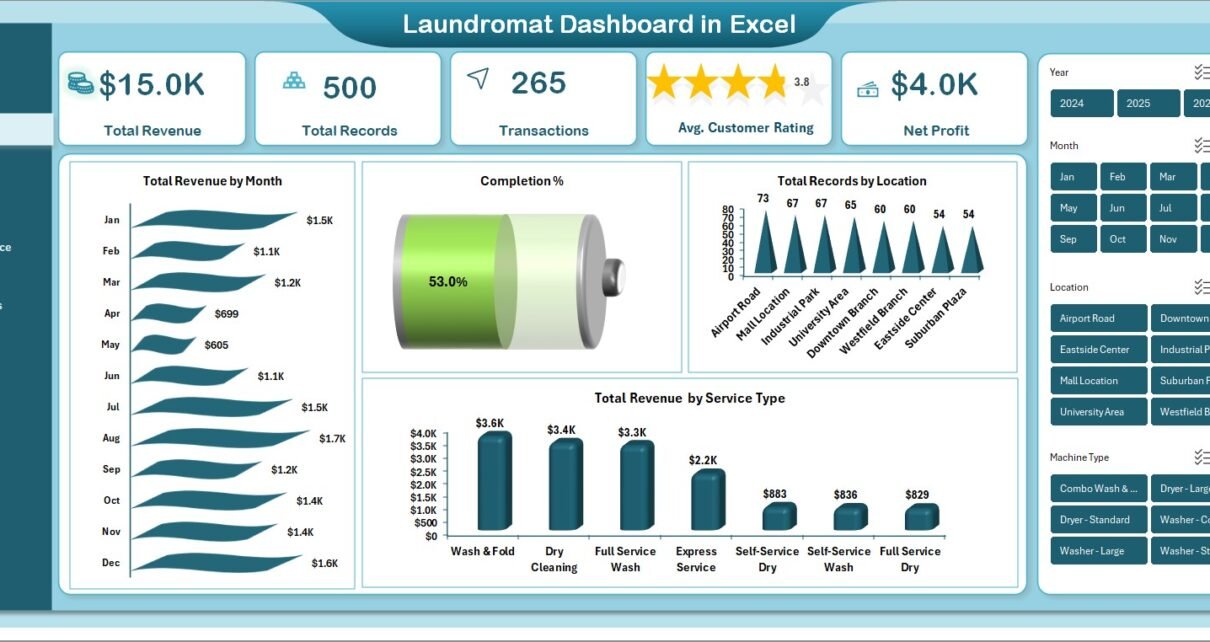
The overview page is the one-glance command centre for the entire laundromat. Five KPI cards sit across the top — Total Revenue, Total Records, Transactions, Avg. Customer Rating and Net Profit — while slicers in the corner let you narrow the view to a specific location, service or time slot.
Below the KPIs, four key charts paint the full picture:
- Total Revenue by Month — spot seasonality, promotion spikes and slow months at a glance.
- Completion Percentage — see what percentage of cycles were completed successfully vs aborted mid-cycle.
- Total Records by Location — compare raw transaction volume across every outlet.
- Total Revenue by Service Type — break revenue by wash, dry, fold, dry-clean and add-on services.
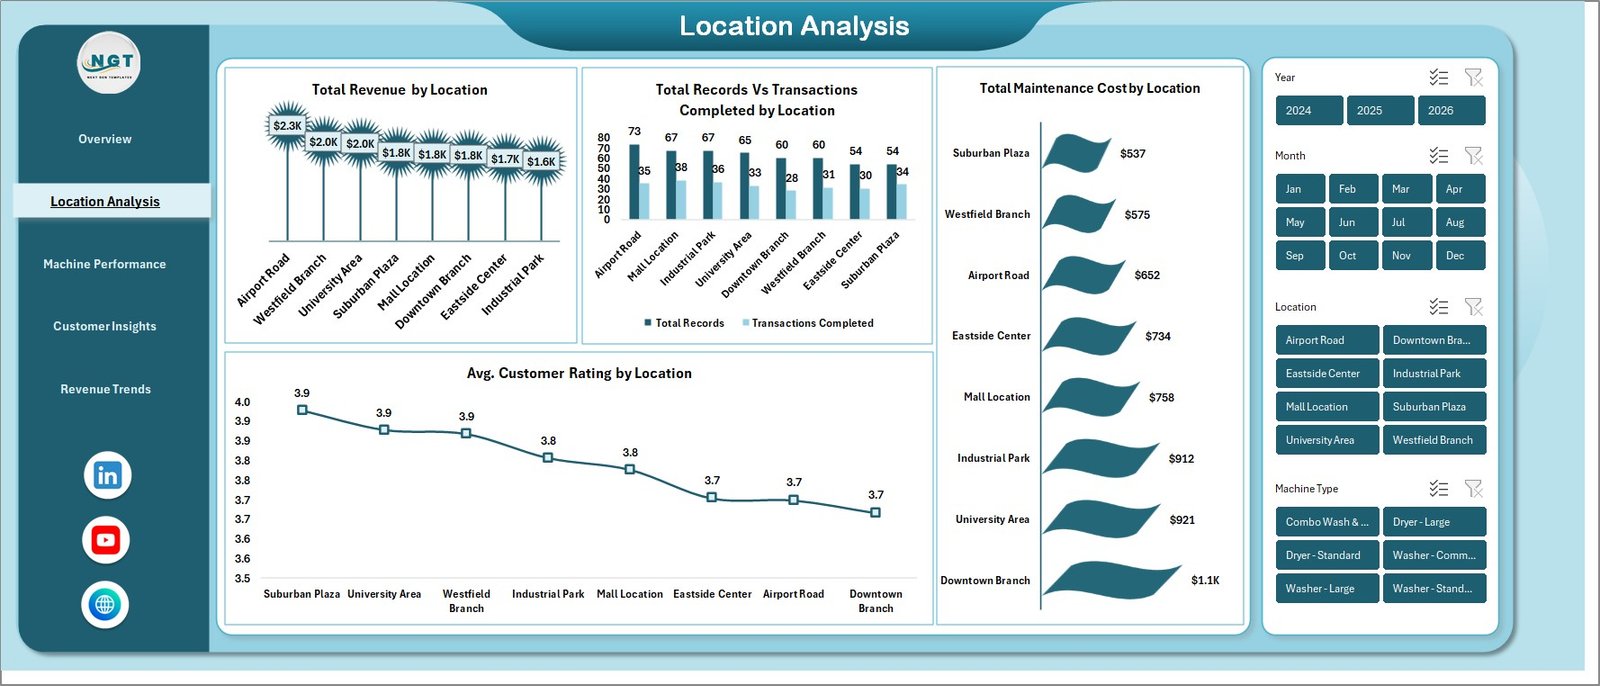
2. Location Analysis
The location analysis page is where multi-store operators live. It puts every branch side-by-side so you can immediately see which outlets are pulling their weight. Charts on this page include Total Revenue by Location, Total Records vs Transactions Completed by Location, Total Maintenance Cost by Location and Avg. Customer Rating by Location. The combination of revenue, maintenance cost and rating makes it obvious where to invest more machines and where to rework the service model.
Click to buy Laundromat Dashboard in Excel
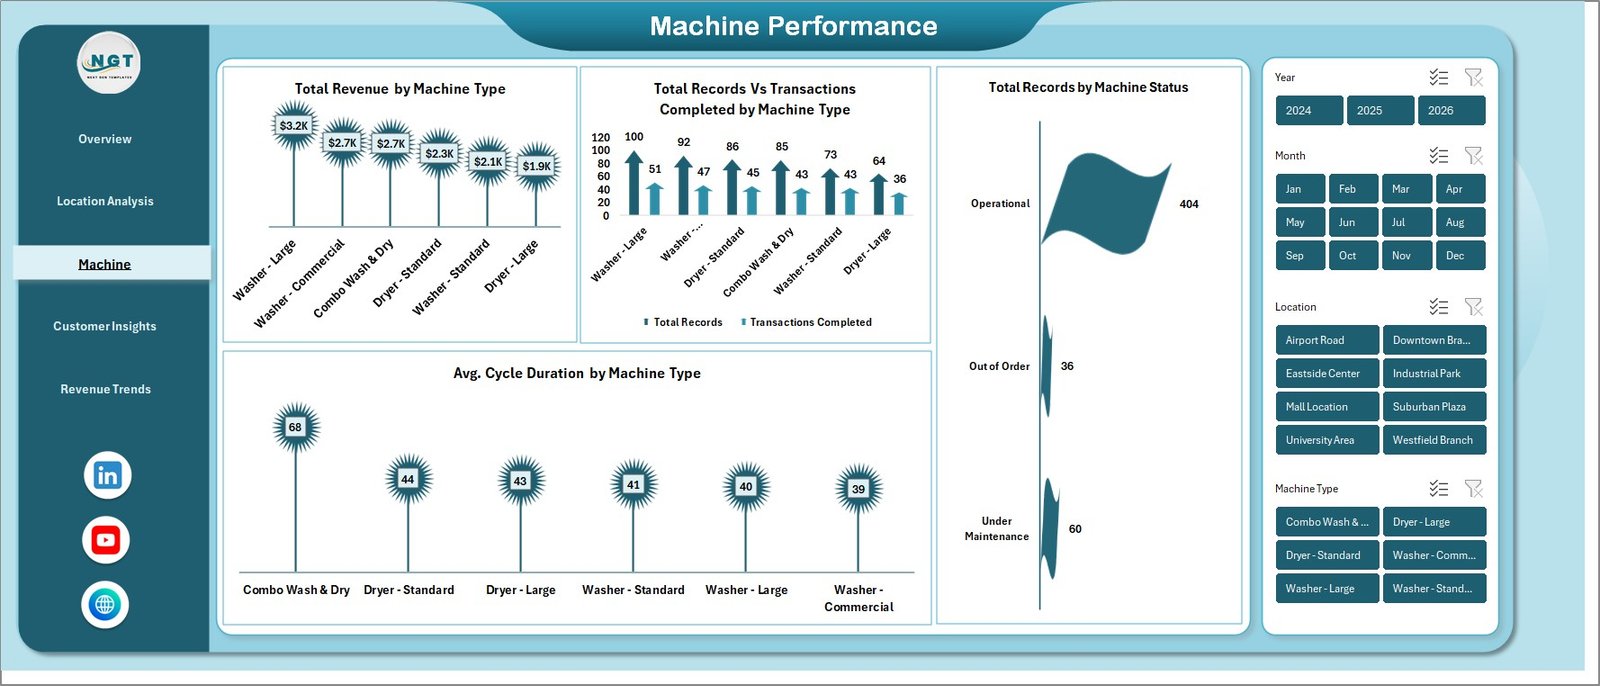
3. Machine Performance
This is the page every operations manager will bookmark. It covers Total Revenue by Machine Type, Total Records vs Transactions Completed by Machine Type, Total Records by Machine Status (operational, under maintenance, out of service) and Avg. Cycle Duration by Machine Type. If a washer is running slower than the fleet average, you will see it here — perfect for scheduling preventive maintenance before revenue leaks.
Click to buy Laundromat Dashboard in Excel
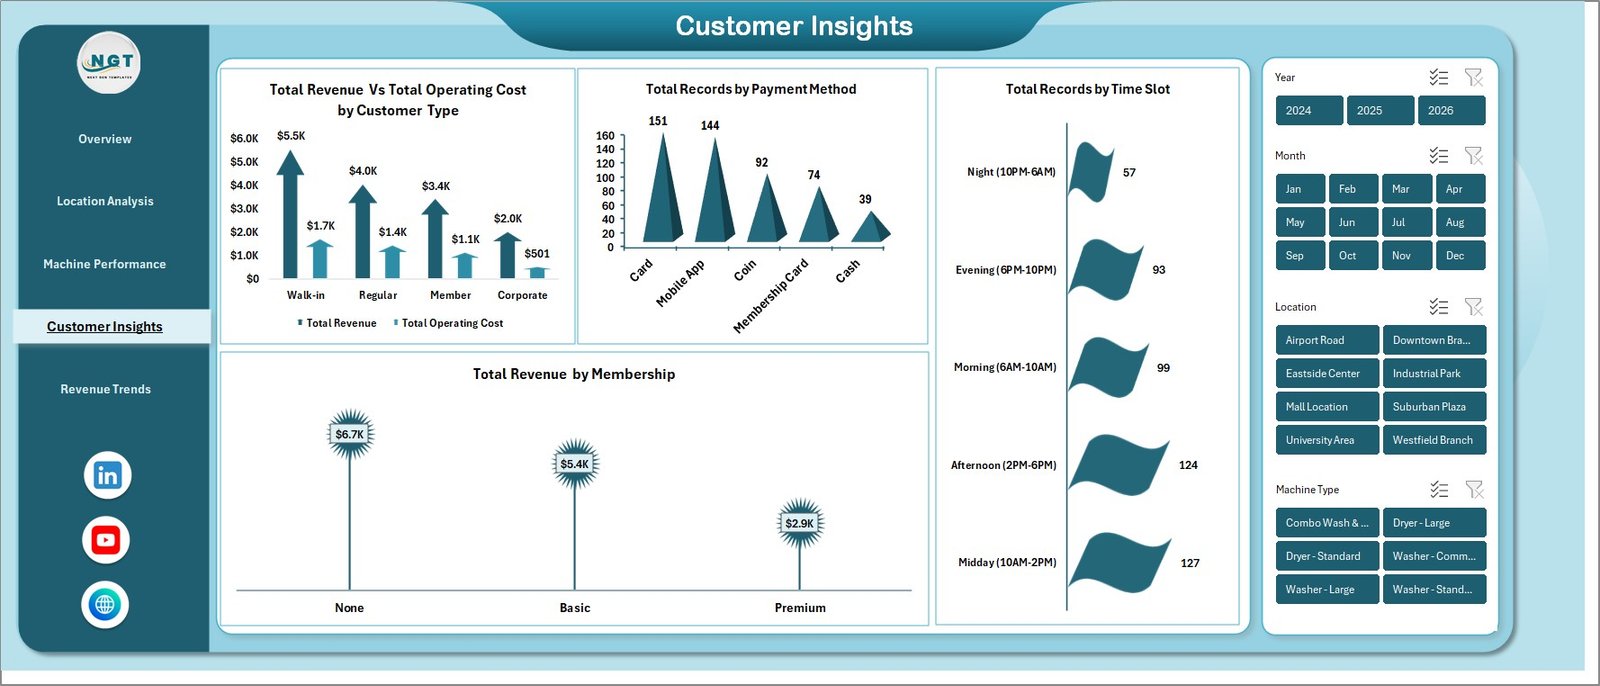
4. Customer Insights
The customer insights page answers the “who, when and how” questions. It stacks Total Revenue vs Total Operating Cost by Customer Type so you can see profitability per segment, then layers on Total Records by Payment Method, Total Records by Time Slot and Total Revenue by Membership. Use it to design loyalty tiers, off-peak discounts and digital payment incentives.
Click to buy Laundromat Dashboard in Excel
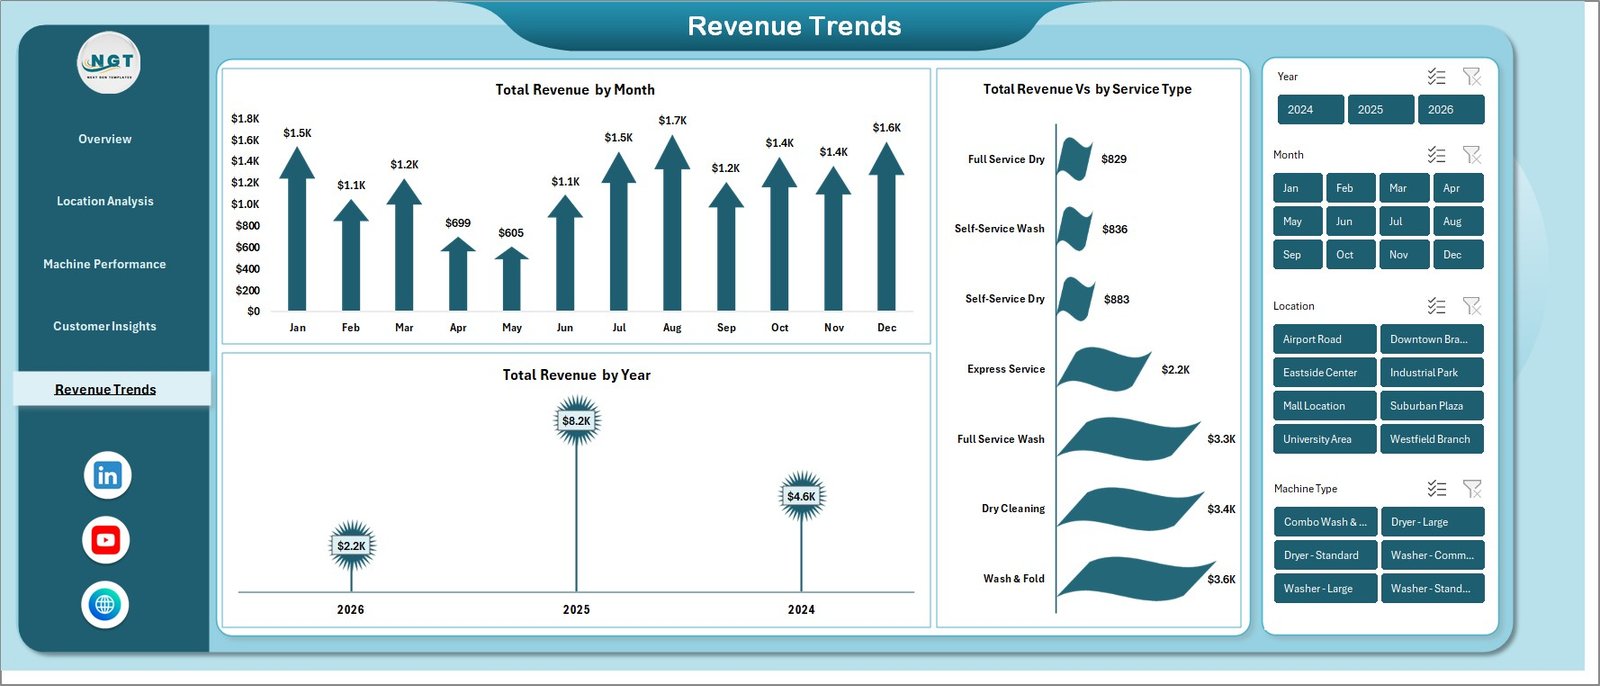
5. Revenue Trends
The revenue trends page gives you the big-picture financial story with Total Revenue by Month, Total Revenue by Year and Total Revenue vs by Service Type. It is the page you will open at every year-end review and every investor update to prove the growth story and explain the service-mix evolution.
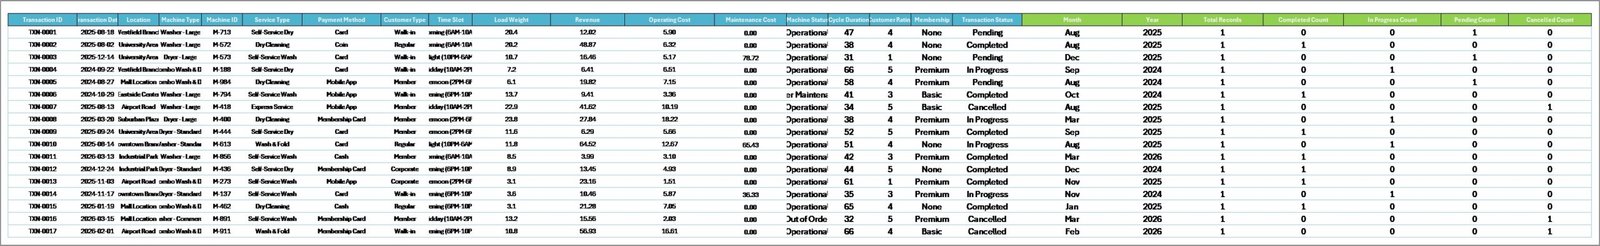
6. Data Sheet
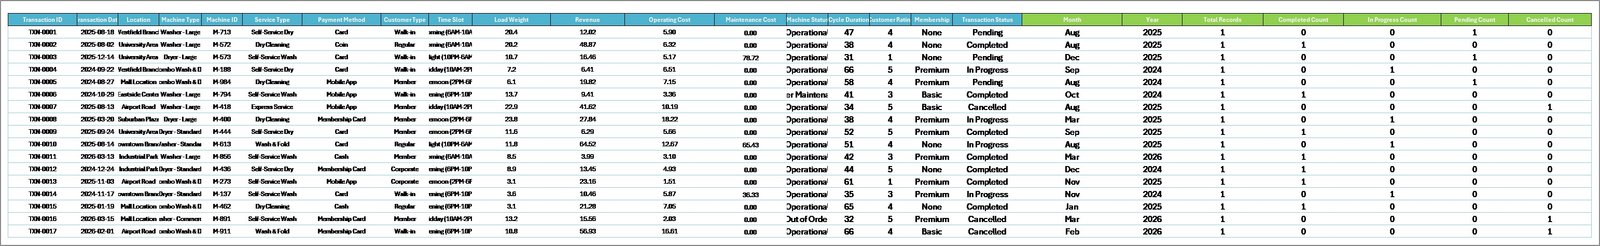
All your raw transaction records sit on the data sheet. Keep the existing columns, replace the sample rows with your own data and that is it. Every pivot and every chart will pick up the new data as soon as you refresh.
7. Support Sheet
The support sheet is the behind-the-scenes engine. It contains every pivot table that drives the five dashboard pages. You can keep this sheet hidden from end users — just remember that clicking Data > Refresh All after updating the data sheet is what makes the whole dashboard come alive.
Click to buy Laundromat Dashboard in Excel
Advantages of the Laundromat Dashboard in Excel
- One single source of truth — replace five scattered spreadsheets with a workbook that always agrees with itself.
- Refresh in seconds — pivot-driven design means updates take one click, not an afternoon.
- Multi-location ready — a single location column is enough to unlock branch-level comparisons.
- Operations + finance in one view — revenue, cost, machine status and customer rating live on the same pages.
- Affordable — a one-time purchase versus monthly SaaS fees that add up quickly.
- Customisable — change colours, logos and chart types freely; nothing is locked.
Opportunities for Improvement
No template is a silver bullet. A few things to think about as you adopt this dashboard:
- Data quality is everything — if your POS export is inconsistent, your dashboard will be too. Standardise location and machine-type names before you paste.
- Excel is not real-time — you refresh on a cadence (daily or weekly). For minute-level monitoring, pair this with a simple Google Sheets log.
- Cost allocation — the template assumes you can split operating cost by customer type and location. If your books do not, it is worth investing a few hours setting that up.
- Version control — if multiple managers edit the same file, store it on OneDrive or SharePoint so you do not lose history.
Best Practices
- Standardise the data sheet headers once and never change them again.
- Import fresh transaction data weekly and always refresh before sharing.
- Use the slicers live in meetings — it makes the analysis feel alive to stakeholders.
- Screenshot key pages at month-end and drop them into a one-page operator summary.
- Keep the support sheet hidden when you send the file to non-technical users.
- For advanced tips on pivot tables and Excel dashboards, visit Microsoft’s official PivotTable guide.
Explore Relevant Templates
If you like the Laundromat Dashboard, you will probably enjoy these related service-business templates on nextgentemplates.com:
- HVAC Service Dashboard in Excel — for field-service operators tracking technicians, jobs and revenue.
- Coaching Business Dashboard in Excel — for solo and team coaches tracking clients, sessions and packages.
- Food Truck Dashboard in Excel — location-level revenue analytics for mobile retail.
- Restaurant P&L Dashboard in Excel — full-service restaurant profit and loss tracking.
- Event Management Analysis Dashboard in Excel — for event planners and venue operators.
Frequently Asked Questions
What is the best Excel template for tracking laundromat revenue?
The Laundromat Dashboard in Excel from NextGenTemplates is a purpose-built template with 5 KPIs, 5 analysis pages and 15+ charts covering revenue, machine performance, customer insights and location profitability — everything a laundromat operator needs, on one refreshable Excel file.
How do I track laundromat machine performance in Excel?
Use the Machine Performance page of the Laundromat Dashboard. It shows Total Revenue by Machine Type, Total Records vs Transactions Completed by Machine Type, Total Records by Machine Status and Avg. Cycle Duration by Machine Type. You just paste your data, click Refresh All and every chart updates automatically.
Can this dashboard handle multiple laundromat locations?
Yes. The Location Analysis page and every slicer are built for multi-location operators. Add a location column to your data sheet and the dashboard will automatically compare every branch by revenue, transactions, maintenance cost and average customer rating.
Do I need macros or VBA knowledge to use the Laundromat Dashboard?
No. The dashboard is built on pivot tables and slicers only — there are no macros, no VBA, and no add-ins required. If you can paste data into a sheet and click Refresh All, you can run the entire dashboard.
Is the Laundromat Dashboard in Excel suitable for franchise owners and investors?
Yes. Franchisees and investors use the dashboard to benchmark store-level profitability, compare maintenance costs across branches and validate expansion plans using historical revenue trends — all from a single Excel workbook.
Which versions of Excel are supported?
The dashboard works on Microsoft Excel 2016, 2019, 2021, Office 365 and Excel for Mac. Any version that supports pivot tables and slicers will run it without issues.
Conclusion
A laundromat lives or dies on three numbers: revenue per location, machine uptime and customer satisfaction. The Laundromat Dashboard in Excel brings all three into one workbook, adds the slicers you need to drill into them and gives you a support sheet that keeps everything in sync with a single click. Whether you own one store or ten, this template will save you hours of manual reporting every month and help you spot problems before they become real money.
👉 Click here to Purchase the Laundromat Dashboard in Excel
For step-by-step video walkthroughs of this dashboard and many more Excel templates, visit our YouTube channel: Youtube.com/@PK-AnExcelExpert.
Click to buy Laundromat Dashboard in Excel