New: NextGenTemplates Academy - video courses on Excel formulas with AI and Pivot Tables & dashboards. Early-bird: 20% off with code EARLYBIRD20 - first 20 orders only.See the courses →
PKComments Off on Auto Repair Dashboard in Power BI
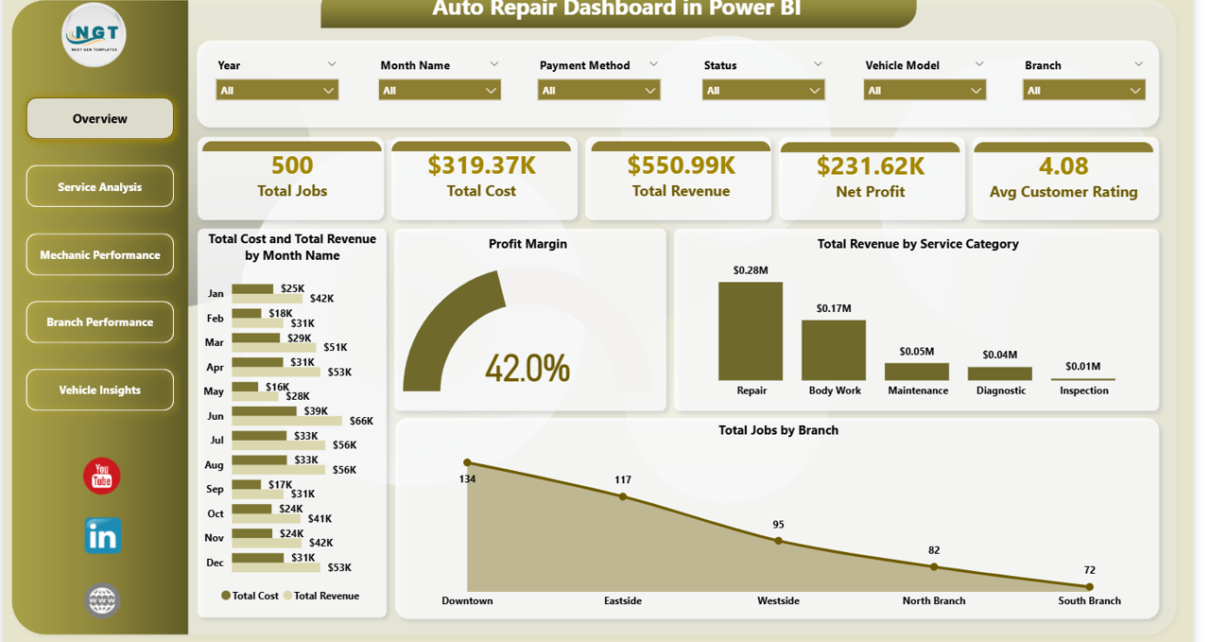
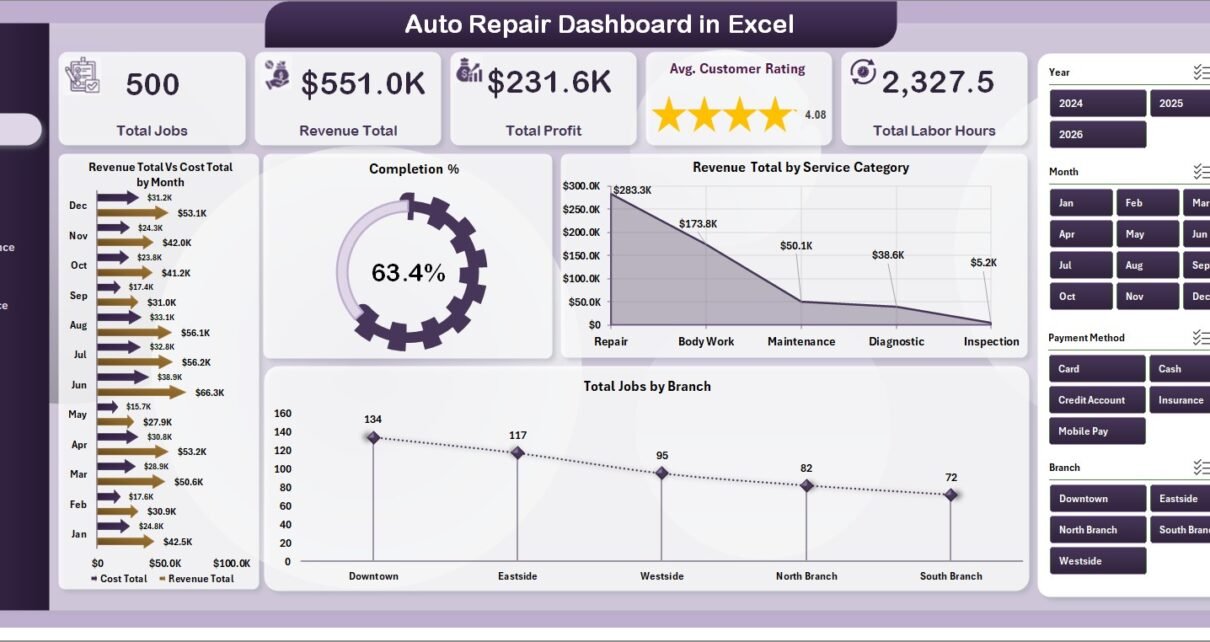
Independent auto repair shops generate roughly $880 in revenue per repair order on average, with multi-bay operators running 250 to 600 jobs per month per location. The data sits in
Independent auto repair shops generate roughly $880 in revenue per repair order on average, with multi-bay operators running 250 to 600 jobs per month per location. The math sits there
PKComments Off on Laundromat Dashboard in Power BI
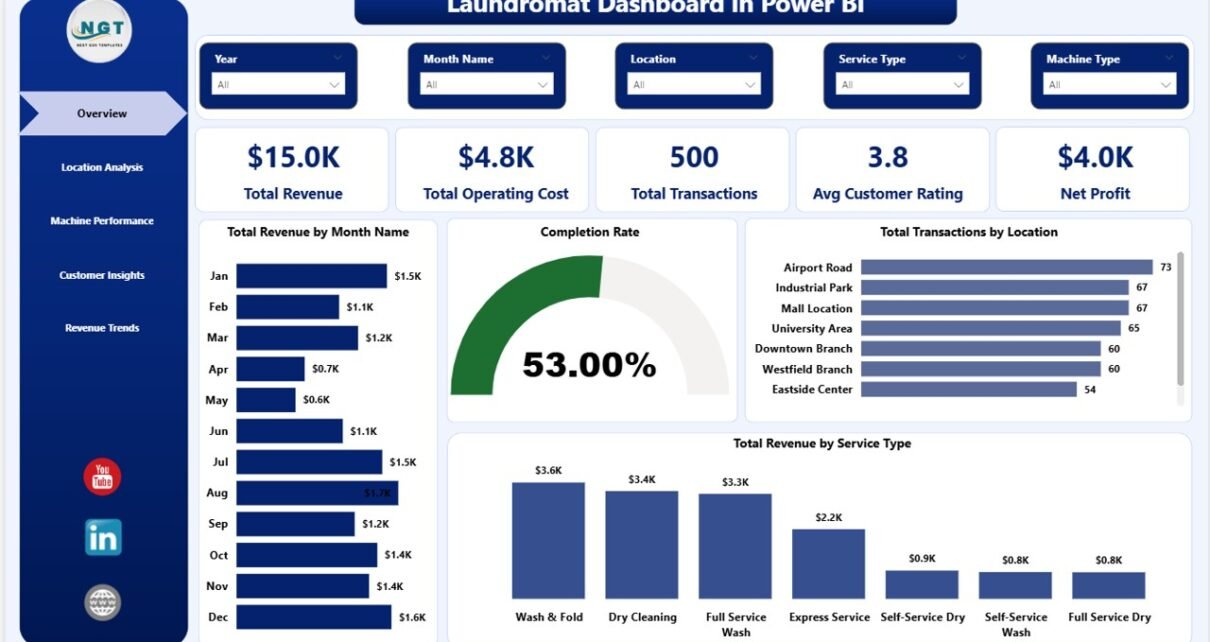
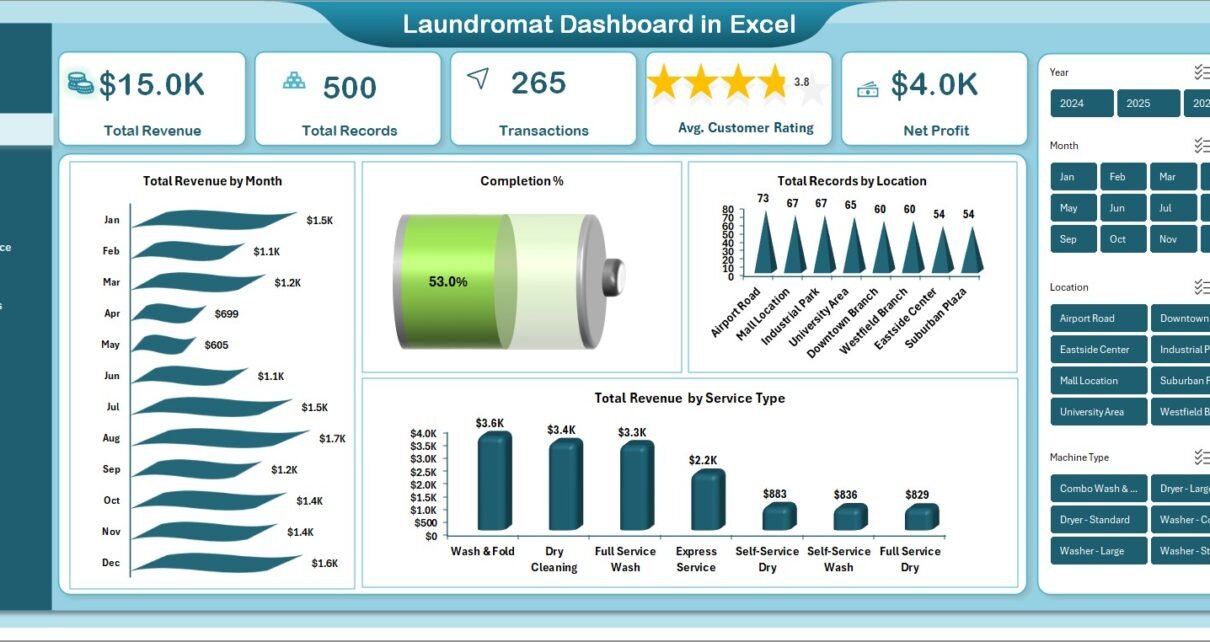
If you run a laundromat, you already know the business is three numbers at once: revenue per location, machine uptime and customer satisfaction. Get any one wrong for a quarter
If you run a laundromat, you already know the business is a moving target. Revenue fluctuates by location, machines break down when you least expect it, peak hours come and
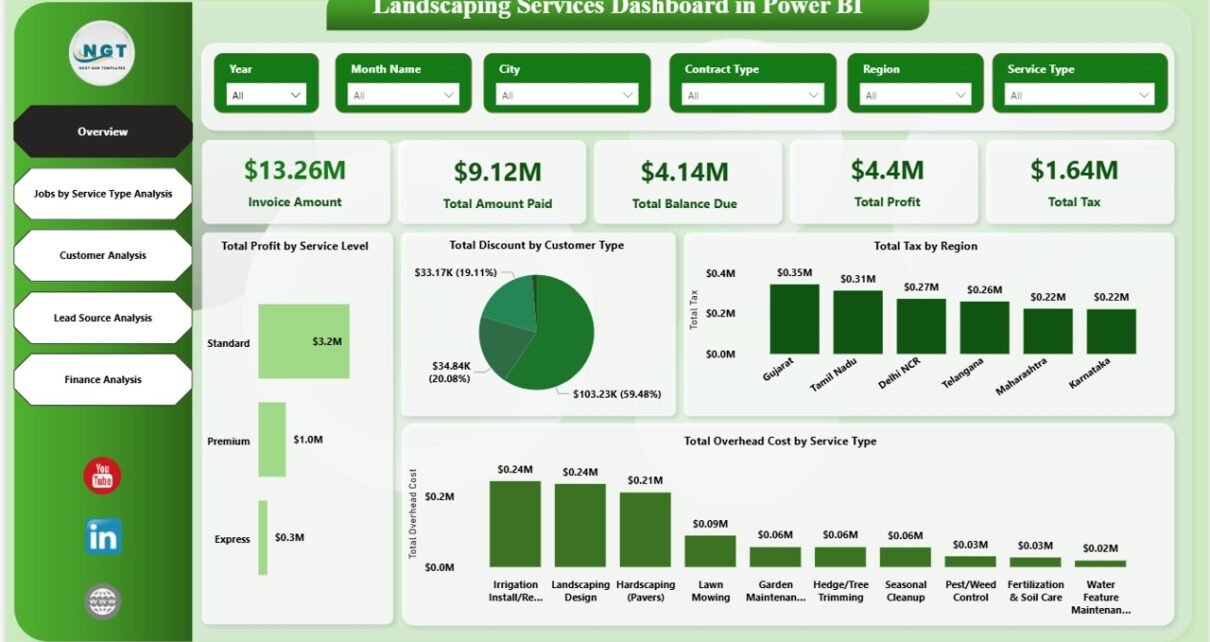
PKComments Off on Landscaping Services Dashboard in Power BI
The landscaping industry is evolving faster than ever. Customers expect faster service, transparent pricing, and consistent quality. At the same time, landscaping business owners must manage labor, materials, taxes, discounts,