Running a fashion brand or apparel retail business without clear data is like designing a collection blindfolded. Boutique owners, merchandising managers, and apparel retailers routinely struggle to answer basic questions: which fashion brands deliver the highest margin, which regions show declining customer satisfaction, and which apparel departments are dragging profit down. The Fashion & Apparel Report in Excel answers all of these questions in a single, slicer-driven workbook. It tracks 5 retail KPIs across 2 interactive pages, with 5 pre-built charts that update automatically every time new product data is entered. According to Microsoft’s official pivot table documentation, slicer-driven pivot reports are among the most time-efficient ways to analyze multi-dimensional retail datasets in Excel — and this template applies exactly that approach to the fashion industry.
In this article we walk through every page of the Fashion & Apparel Report in Excel, explain how the cards, charts, and slicers work together, and show you how to set it up in under 10 minutes. If you are a fashion brand owner, apparel retailer, merchandising manager, or boutique operator looking to replace expensive retail SaaS tools with a single polished Excel report, this template is built for you.
Key Features of Fashion & Apparel Report in Excel
The Fashion & Apparel Report in Excel includes 5 KPI cards and 5 pre-built charts that together give fashion businesses a complete picture of brand-level profitability and customer satisfaction. Here is what makes it stand out:
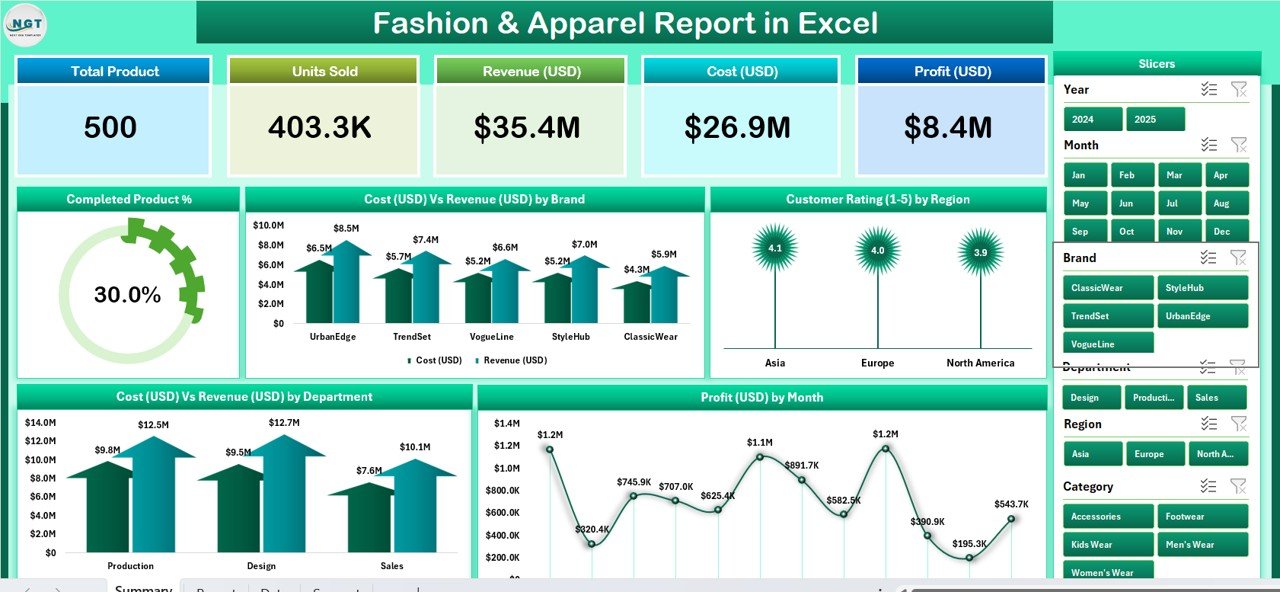
5 KPI Summary Cards: Displayed prominently at the top of the Summary page, these headline cards show total products, completed product count, total cost, total revenue, and average customer rating at a glance. Every card updates automatically when data changes in the Data Sheet — no manual refresh, no formula edits.
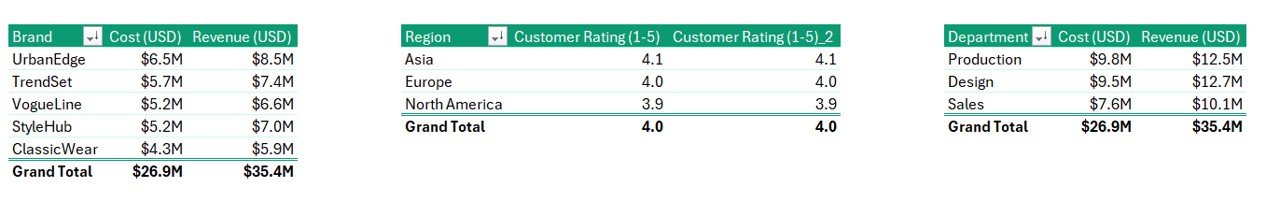
5 Interactive Charts: The Summary page features five charts engineered to answer the most common fashion retail questions. The Completed Product % chart shows your overall fulfillment rate. Cost Vs Revenue by Brand lets you compare each fashion brand’s cost against revenue side-by-side — critical for negotiating wholesale terms with underperforming brands. Customer Rating by Region shows which geographic markets respond best to your apparel mix. Cost Vs Revenue by Department reveals which apparel categories (women’s, men’s, accessories, footwear, etc.) drive the highest margin. Profit by Month provides a trend line for seasonal financial performance over the year.
Dynamic Slicers: The Summary page has a right-side slicer and the Report page has a left-side slicer. Both let you filter all charts and tables simultaneously by brand, department, region, or time period — with a single click and no formula changes.
Information Table on Report Page: This filterable product-level table shows each fashion product’s status, assigned brand, cost, revenue, customer rating, and region in a clean, sortable layout. It is the go-to view for weekly merchandising meetings, brand performance reviews, and seasonal buying decisions.
Data Sheet + Support Sheet: All raw apparel data is entered in the Data Sheet, one row per product. The Support Sheet holds dropdown reference values for brands, departments, regions, and statuses — keeping all data entries consistent and validated across the file.
Report Pages Explanation
Page 1 — Summary Page
The Summary page is the main executive view of the Fashion & Apparel Report in Excel. Five KPI cards run along the top row, giving instant headline numbers without needing to scroll or drill down. Below the cards, the right-side slicer panel lets you filter all five charts at once. This means you can select a specific fashion brand and immediately see how its completion rate, cost-revenue ratio, and customer satisfaction scores compare to your overall portfolio — no manual recalculation required.
The five charts are arranged to guide the eye from high-level fulfillment status down into financial and quality detail. Completed Product % gives the headline: what percentage of all products in the Data Sheet are marked as complete or stocked? Cost Vs Revenue by Brand is a comparison bar chart showing each brand’s total cost versus revenue — critical for flagging unprofitable brand partnerships before next season’s buying. Customer Rating by Region is a regional breakdown of satisfaction scores, helping merchandising managers see where the assortment is resonating. Cost Vs Revenue by Department groups financial performance by apparel category, so you can identify which departments are pulling weight and which need rethinking. Profit by Month is a monthly trend chart showing how profit has evolved across the seasonal calendar.
Summary Page — 5 KPI Cards, Right-Side Slicer, and 5 Charts
Page 2 — Report Page
The Report page provides a filterable, product-level information table. Where the Summary page gives you the aggregate picture, the Report page lets you drill into individual SKUs. The left-side slicer filters the table by any combination of brand, region, department, or status. The information table itself shows each product’s name, assigned brand, region, department, current status, cost, revenue, and customer rating in a clean, scrollable layout.
This page is particularly useful for weekly merchandising standups: you can filter by “In Stock” or “Sold Out” status to see which products need replenishment, then check their cost vs revenue columns to spot which lines deserve a deeper buy and which should be discounted out.
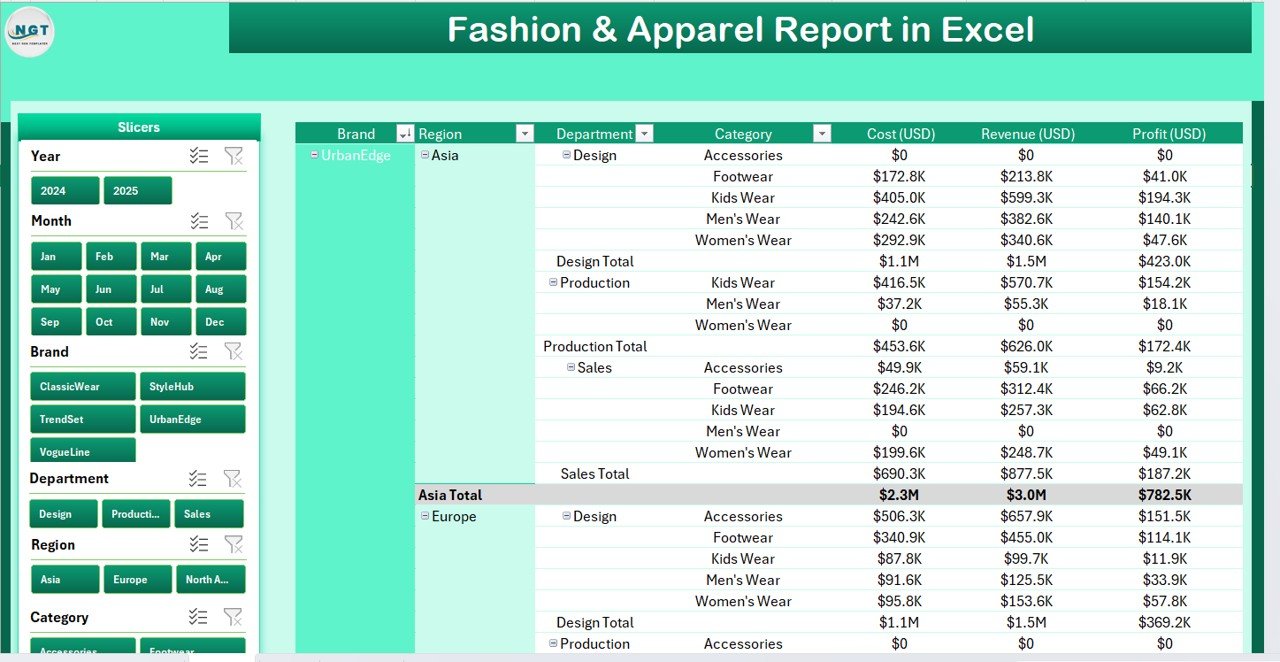
Report Page — Left-Side Slicer and Product-Level Information Table
Data Sheet
The Data Sheet is where all product records live. Add one row per fashion product, filling in the product name, brand, region, department, start date, end date, cost, revenue, status, and customer rating. Every chart and KPI card on the Summary and Report pages reads from this sheet dynamically — there is no need to copy data elsewhere or manually refresh charts.
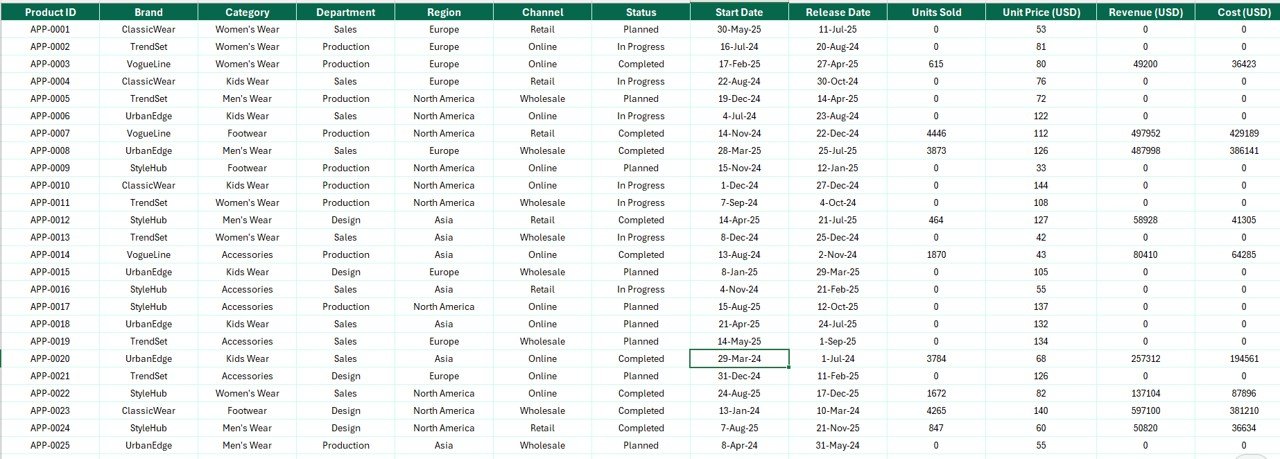
Data Sheet — Clean Structured Data Entry for Fashion Products
Support Sheet
The Support Sheet contains the reference lookup tables that power all dropdown menus throughout the file. You can update the list of fashion brand names, apparel departments, regions, and status values here without touching any formulas. This makes it easy to adapt the template to your specific business structure, whether you carry 5 fashion brands or 50, sell across 2 regions or 20.
Support Sheet — Dropdown Reference Tables for Data Consistency
Fashion & Apparel Report in Excel vs. Google Sheets Version vs. Paid SaaS — Feature Comparison
| Feature | Fashion & Apparel Report in Excel | Google Sheets Equivalent | Shopify Reports / Lightspeed Retail |
|---|---|---|---|
| Cost | $7.99 one-time | Free (manual build) | $29–$299/month |
| Platform | MS Excel (offline + online) | Cloud only | SaaS (cloud only) |
| Setup time | Under 10 minutes | 10–15 min | Days + onboarding |
| Slicer filtering | ✅ Pre-built | Limited | ✅ Paid tier |
| Cost Vs Revenue by Brand | ✅ 5 charts included | Manual build required | ✅ Paid tier |
| Customer Rating by Region | ✅ Yes | Manual build required | Add-on required |
| Offline access | ✅ Full offline | Limited | ❌ No |
| Year-1 cost (5 users) | $7.99 total | $0 but no pre-built features | $1,740–$17,940/year |
For fashion brands and apparel retailers that need professional reporting without paying monthly SaaS fees, the Fashion & Apparel Report in Excel delivers the core functionality at a one-time price.
Who Should Use This Template
Perfect for:
- Fashion boutique owners tracking weekly cost vs revenue across multiple brands and apparel categories
- Apparel merchandising managers reporting product completion rates, customer ratings, and profit trends to leadership
- Wholesale and retail apparel businesses that need a single-file overview of brand performance and regional satisfaction
- Multi-brand fashion retailers presenting monthly profit-by-month trends and brand contribution to buying teams
Not a fit if:
- You operate a 1,000+ SKU enterprise fashion chain that needs real-time POS integration and multi-store inventory sync (consider Shopify Plus or Lightspeed Retail)
- You need automated reorder-point alerts or supplier purchase order generation built into the report
Real-World Use Cases
Anjali runs a fashion boutique in Bengaluru with three retail locations. Every Monday morning she opens the Fashion & Apparel Report in Excel, enters last week’s product sales and customer ratings, and uses the Cost Vs Revenue by Brand chart to identify which fashion brands drove the highest margin — and which underperformers to renegotiate with at the next buying season. The whole process takes under 15 minutes and costs nothing beyond the one-time template purchase.
Marcus oversees merchandising for an apparel chain with stores across four regions. His team handles 200–400 active SKUs per season. He uses the Customer Rating by Region chart to flag regions where satisfaction has dipped, the Cost Vs Revenue by Department chart to see which apparel categories (women’s, men’s, accessories) are pulling profit weight, and the Profit by Month chart to share monthly profit trends with leadership in operations reviews — without paying for an enterprise retail BI tool.
Advantages of Fashion & Apparel Report in Excel
The biggest practical advantage is speed: the Fashion & Apparel Report in Excel is ready to populate in under 10 minutes, compared to days of onboarding for SaaS retail platforms. Because it runs in Microsoft Excel — software already installed on most fashion business computers — there is no new tool to learn, no browser dependency, and no monthly login requirement. The slicer-based filtering is especially valuable for buying meetings: you can walk through a single file and filter by brand, department, or region in real time during a vendor presentation rather than switching between multiple reports or dashboard screens. The one-time purchase model also makes it easy to justify: at $7.99, it pays for itself the first time you avoid one hour of manual report building from scattered spreadsheet exports.
Opportunities for Improvement
Like all Excel-based reports, the Fashion & Apparel Report in Excel is a single-user file by default. Teams that need simultaneous multi-user data entry should consider storing the file on SharePoint with Excel co-authoring enabled, though slicer interactions may behave differently in co-authoring mode. The template does not include automated email alerts when a brand goes over a cost threshold — teams that need proactive notifications would need to layer Power Automate on top or use a dedicated SaaS retail tool. The current layout supports up to the column limits of the Data Sheet, which is more than sufficient for fashion businesses with up to several thousand active SKUs; very large enterprise chains with 10,000+ concurrent SKUs may benefit from archiving older seasons quarterly to keep the file size manageable.
Best Practices
For best results, update the Support Sheet first before entering any product data — getting the correct fashion brand names, apparel departments, regions, and status values into the dropdown lists ensures clean, consistent data from day one. Enter product data weekly rather than in large monthly batches; weekly data entry keeps the Profit by Month chart accurate throughout the season rather than showing a single end-of-month spike. When sharing the Summary page as a PDF with buyers, vendors, or leadership, use Excel’s Print Area feature to set the print range to the Summary page only, which produces a clean one-page export without exposing the underlying Data Sheet or Support Sheet.
Explore Relevant Templates
If the Fashion & Apparel Report in Excel covers your core reporting needs, you may also find these related templates from NextGenTemplates useful:
- Fashion & Apparel KPI Dashboard in Excel — a full KPI dashboard with multiple analysis pages and comprehensive slicer filtering for fashion brand management
- Fashion & Apparel Dashboard in Excel — comprehensive multi-page dashboard for deeper apparel performance tracking
- Fashion Retail KPI Dashboard in Excel — retail-focused KPI scorecard for boutique chains and fashion stores
Also available as: Fashion & Apparel KPI Dashboard in Power BI · Fashion KPI Scorecard in Google Sheets
You can also browse the full collection of Excel Report Templates on NextGenTemplates.com for industry-specific reporting solutions across fashion, retail, finance, operations, and more.
For related reading on the pk-anexcelexpert.com blog, see our posts on the Fashion & Apparel KPI Dashboard in Excel and the Graphic Design Report in Excel for similar Excel reporting approaches across creative and retail industries.
Frequently Asked Questions
What KPIs does the Fashion & Apparel Report in Excel track?
The Fashion & Apparel Report in Excel tracks 5 KPIs: Completed Product %, Cost Vs Revenue by Brand, Customer Rating by Region, Cost Vs Revenue by Department, and Profit by Month. All KPI cards and charts update automatically when you add or modify data in the Data Sheet.
Do I need macros or add-ins to run this template?
No. The Fashion & Apparel Report in Excel uses only native Excel features — pivot charts, slicers, and standard formulas. No macros, VBA, or third-party add-ins are required. It is compatible with Excel 2016, 2019, 2021, and Microsoft 365 on Windows and Mac.
Can I add more brands, departments, or regions?
Yes. Open the Support Sheet and add new entries to the relevant dropdown lists. Then add your product rows to the Data Sheet. The charts and slicers will automatically recognize the new values — no formula or chart configuration changes are needed.
How long does setup take?
Setup takes under 10 minutes for most users. Update the Support Sheet with your fashion business’s specific brand and department values, then start entering product data in the Data Sheet. Charts and KPI cards populate automatically as you type.
How does this compare to Shopify Reports or Lightspeed Retail for fashion analytics?
The Fashion & Apparel Report in Excel costs $7.99 once versus $29 to $299 per month for SaaS retail tools. It covers the core reporting use cases — brand cost vs revenue, customer ratings by region, profit trends — without subscriptions, per-store fees, or complex POS integration setup.
Can I use this template in Microsoft 365 online (Excel for the web)?
The template is optimized for Excel desktop (2016 or later). Microsoft 365 online supports most features, but slicer interaction and some chart formatting may differ slightly. For the best experience with the Fashion & Apparel Report in Excel, use the desktop application.
Is this template suitable for fashion boutique owners?
Yes. Fashion boutique owners with multiple brands and apparel categories can use the Fashion & Apparel Report in Excel to track each brand’s cost vs revenue, monitor customer ratings across regions, and generate professional summary reports to share with buyers, vendors, or leadership as PDFs.
About the Author
Built by PK — Microsoft Certified Professional with 15+ years of Excel, Google Sheets, and Power BI experience. Founder of NextGenTemplates, reaching 300K+ subscribers across YouTube channels. Every template in the NextGenTemplates catalog is hand-built and tested before release.
Conclusion
The Fashion & Apparel Report in Excel gives fashion brand owners, apparel retailers, and merchandising managers a professional, data-driven way to track brand-level cost and revenue, customer satisfaction, and monthly profit — in a tool they already use every day. Two interactive pages, five pre-built charts, dynamic slicers, and a clean data entry architecture make it one of the most practical reporting templates available for fashion and apparel operations teams.
👉 Click here to Purchase the Fashion & Apparel Report in Excel
✅ Instant download · One-time payment · No subscription · No per-user fees
Visit our YouTube channel for step-by-step video walkthroughs: Youtube.com/@PK-AnExcelExpert
Last updated: May 2026