The craft beverage industry has exploded — there are now more than 9,500 breweries and 11,000 wineries operating in the United States alone, with thousands more across Europe, Asia-Pacific, and emerging markets. Yet most independent brewery and winery operators still run their operational reporting on disconnected spreadsheets, weekly screenshots, and best-guess estimates of which batch is making them money. The Brewery & Winery Dashboard in Excel closes that gap with 5 headline KPIs, 17 interactive charts, and 5 analysis pages, all driven by a single refreshable data sheet.
This dashboard is designed for craft brewery owners, winery operators, head brewers, winemakers, operations managers, and beverage industry consultants who need a unified view of production batches, sales channels, quality scores, inventory pressure, and regional profitability — without paying $200 to $1,500 per month for full craft-beverage SaaS like Ekos, VinSUITE, or Orchestrated. Setup takes under 10 minutes, runs entirely on Excel pivot tables and standard charts, and works for breweries-only, wineries-only, or combined operations.
Key Features of Brewery & Winery Dashboard in Excel
Click here to Purchase the Brewery & Winery Dashboard in Excel
The Brewery & Winery Dashboard in Excel tracks 5 headline KPIs (Total Revenue, Total Production Cost, Total Volume Sold, Total Net Profit, Total Batches) and 17 interactive charts spread across 5 analysis pages. Every visual is driven by pivot tables linked to a single, structured Data sheet. The hidden Support sheet holds the pivot layer — power users can unhide it to extend the model with new measures.
Multi-select slicers sit on every page allowing instant filtering by region, sales channel, customer type, beverage type, beverage category, batch status, and brewmaster. Chart ranges expand automatically as you add new rows, so the dashboard scales from 50 batches a year to 5,000 without re-binding.
The dashboard is fully built on native Excel features — pivot tables, slicers, conditional formatting, and standard chart types. No DAX, no VBA, no macros, and no external add-ins. Works on Microsoft Excel 2016 and later including Microsoft 365 on both Windows and Mac.
Dashboard Pages Explanation
1. Overview Page
Overview Page
Click here to Purchase the Brewery & Winery Dashboard in Excel
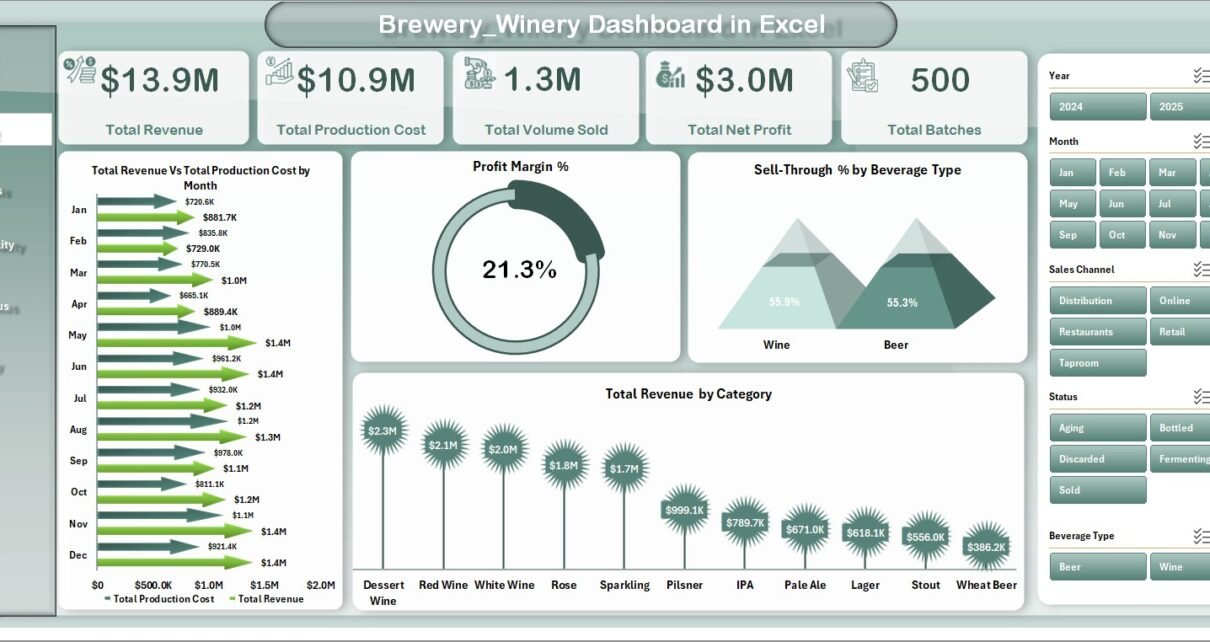
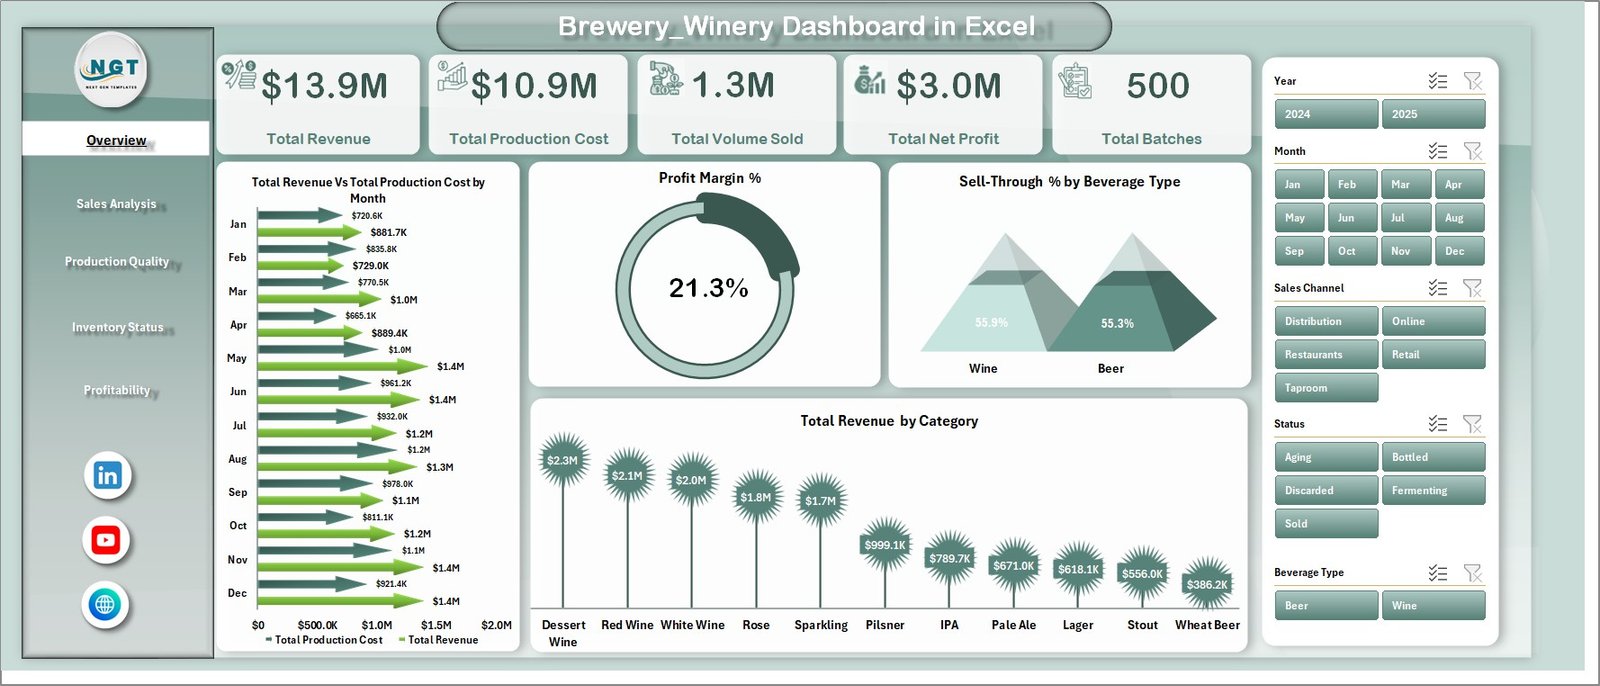
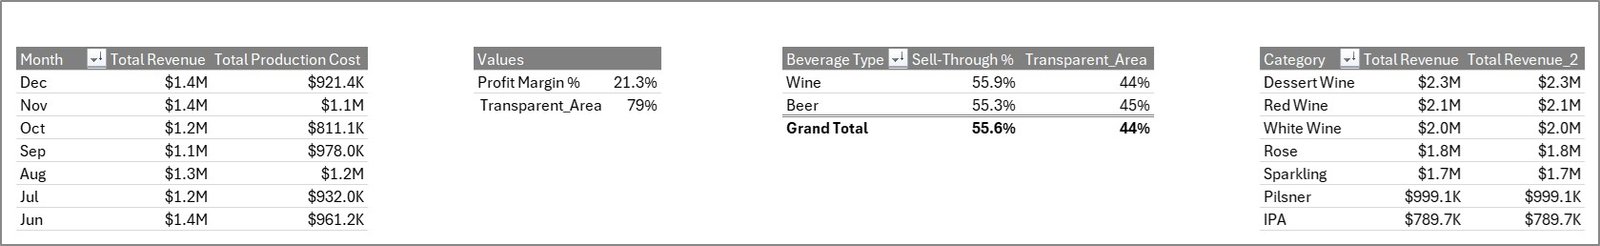
The Overview page is the executive landing screen. Five high-level KPI cards across the top show Total Revenue, Total Production Cost, Total Volume Sold, Total Net Profit, and Total Batches. Below the cards sit four interactive charts:
- Total Revenue Vs Total Production Cost by Month — A side-by-side trend showing whether revenue is outrunning cost month over month, the single most important indicator of healthy growth in a craft beverage business
- Profit Margin % — A KPI gauge surfacing whether the overall business is operating in healthy margin territory after production cost is subtracted from revenue
- Sell-Through % by Beverage Type — Reveals which beverages are clearing inventory quickly versus piling up in storage, a critical input for next-cycle production planning
- Total Revenue by Category — Shows which beverage categories (e.g., IPA, lager, red wine, white wine, sparkling) are pulling the most revenue, useful for portfolio rationalization
Multi-select slicers along the side filter every visual on the page in real time. Click a region, a sales channel, or a customer type and every card and chart instantly recalculates.
2. Sales Analysis Page
Sales Analysis
Click here to Purchase the Brewery & Winery Dashboard in Excel
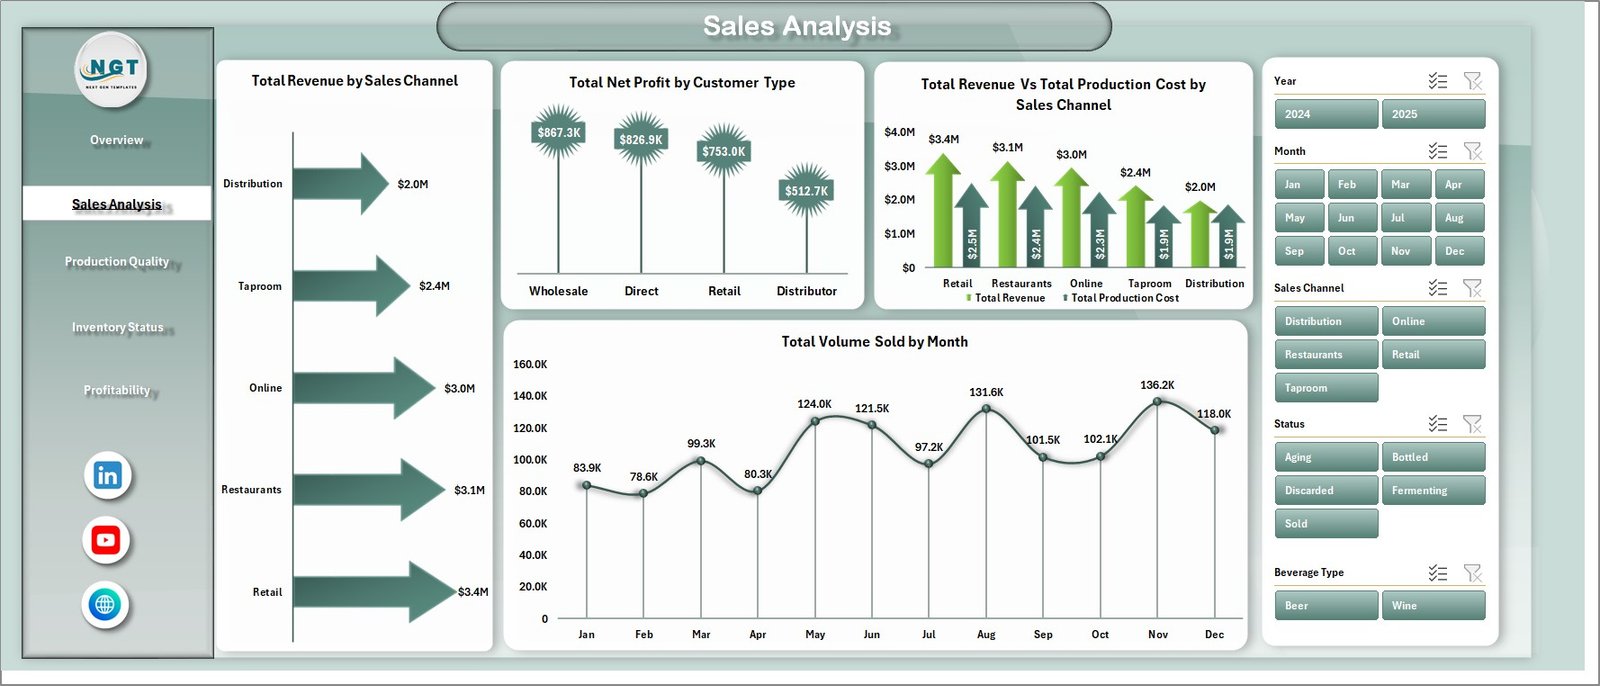
The Sales Analysis page focuses on revenue distribution and channel-level profit contribution. It includes Total Revenue by Sales Channel, Total Net Profit by Customer Type, Total Revenue Vs Total Production Cost by Sales Channel, and Total Volume Sold by Month. Together these four views answer questions like: which channel is dragging margin down, are wholesale customers actually more profitable than direct-to-consumer, and is volume seasonality matching last year’s pattern.
3. Production Quality Page
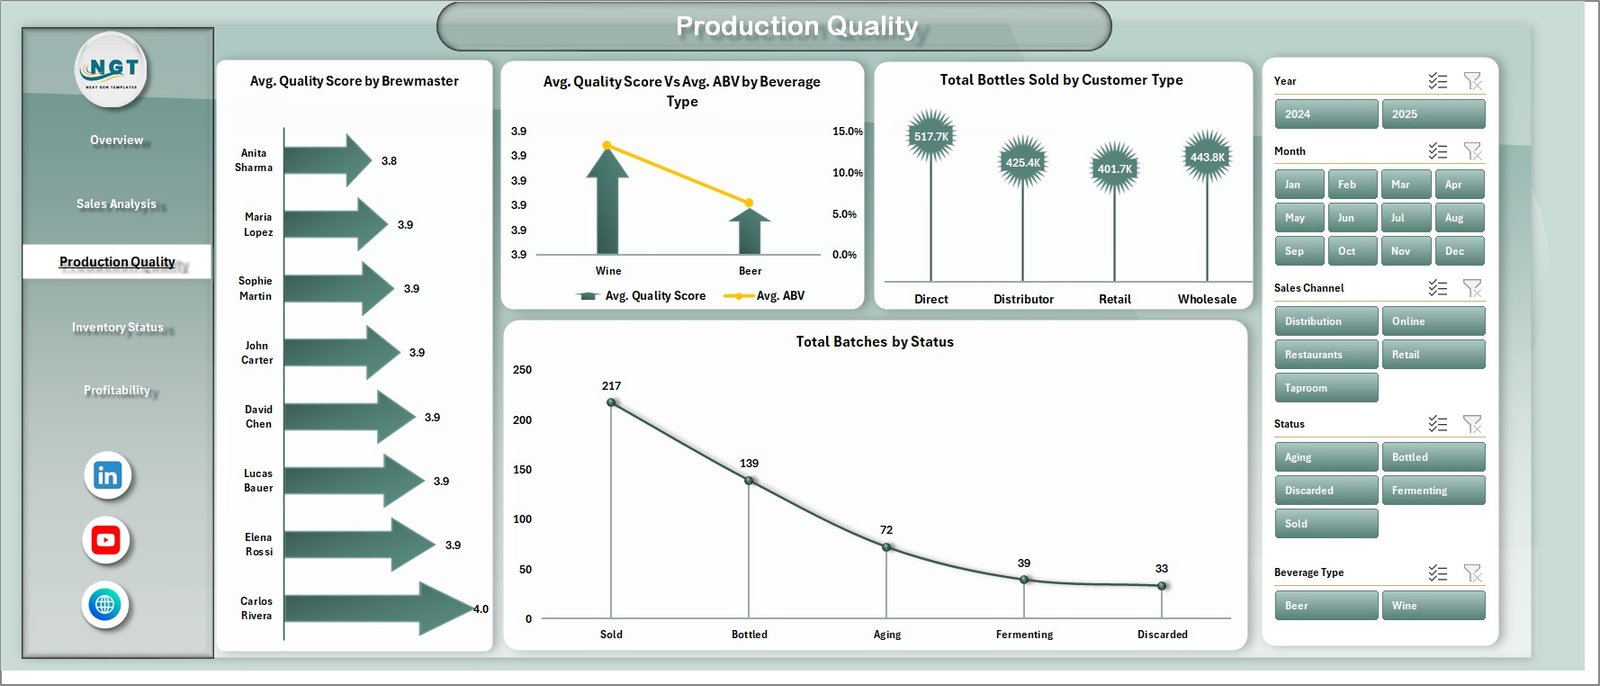
Production Quality
Click here to Purchase the Brewery & Winery Dashboard in Excel
The Production Quality page surfaces craft consistency. Charts include Avg. Quality Score by Brewmaster (head-to-head accountability across production teams), Avg. Quality Score Vs Avg. ABV by Beverage Type (a dual-axis view showing whether high-ABV beverages are scoring lower on quality), Total Bottles Sold by Customer Type, and Total Batches by Status. Useful for monthly QA reviews and year-end brewmaster performance evaluations.
4. Inventory Status Page
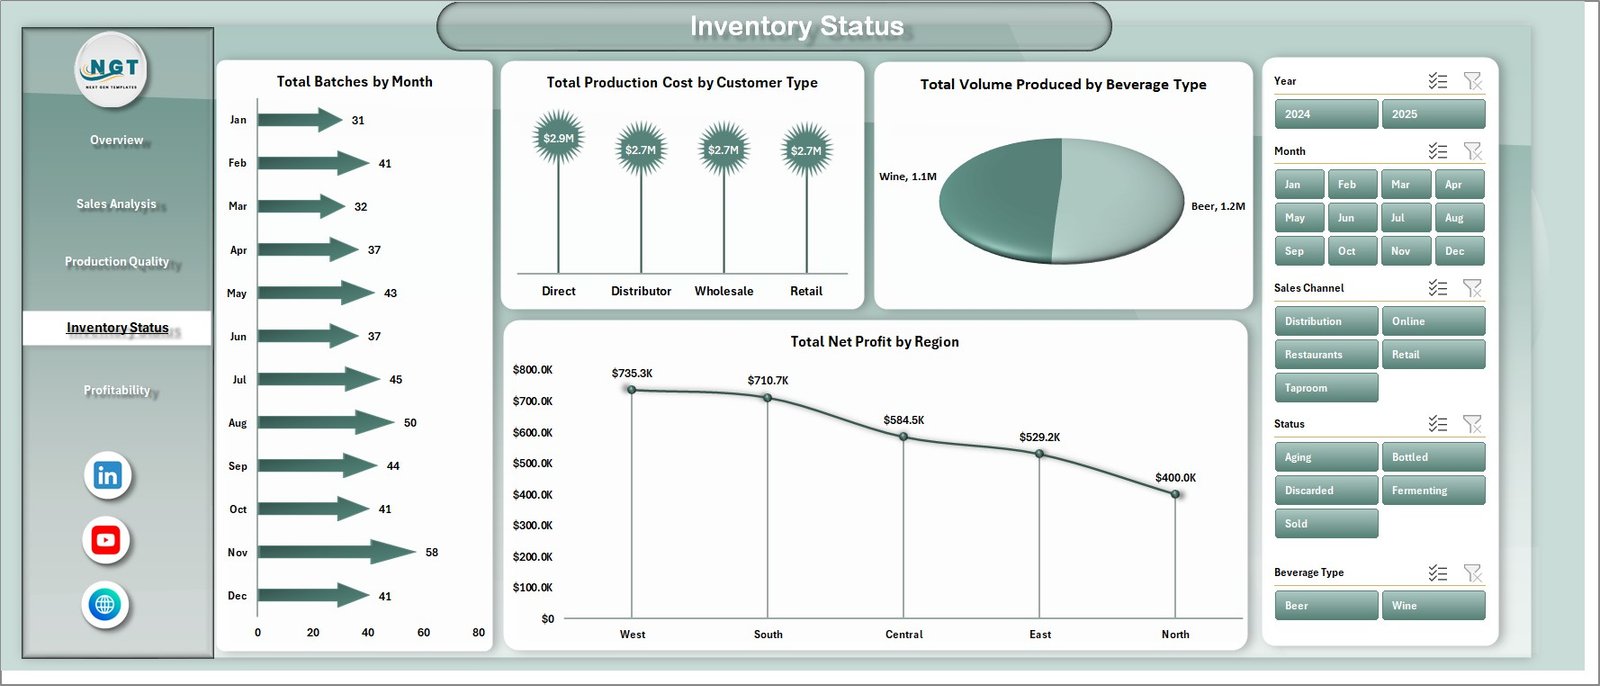
Inventory Status
Click here to Purchase the Brewery & Winery Dashboard in Excel
The Inventory Status page shows Total Batches by Month, Total Production Cost by Customer Type, Total Volume Produced by Beverage Type, and Total Net Profit by Region. The combination identifies seasonal batch patterns, beverage-mix imbalances, and regional contribution to bottom-line performance. Use it before forecasting next quarter’s hops, grape, and barrel orders.
5. Profitability Page
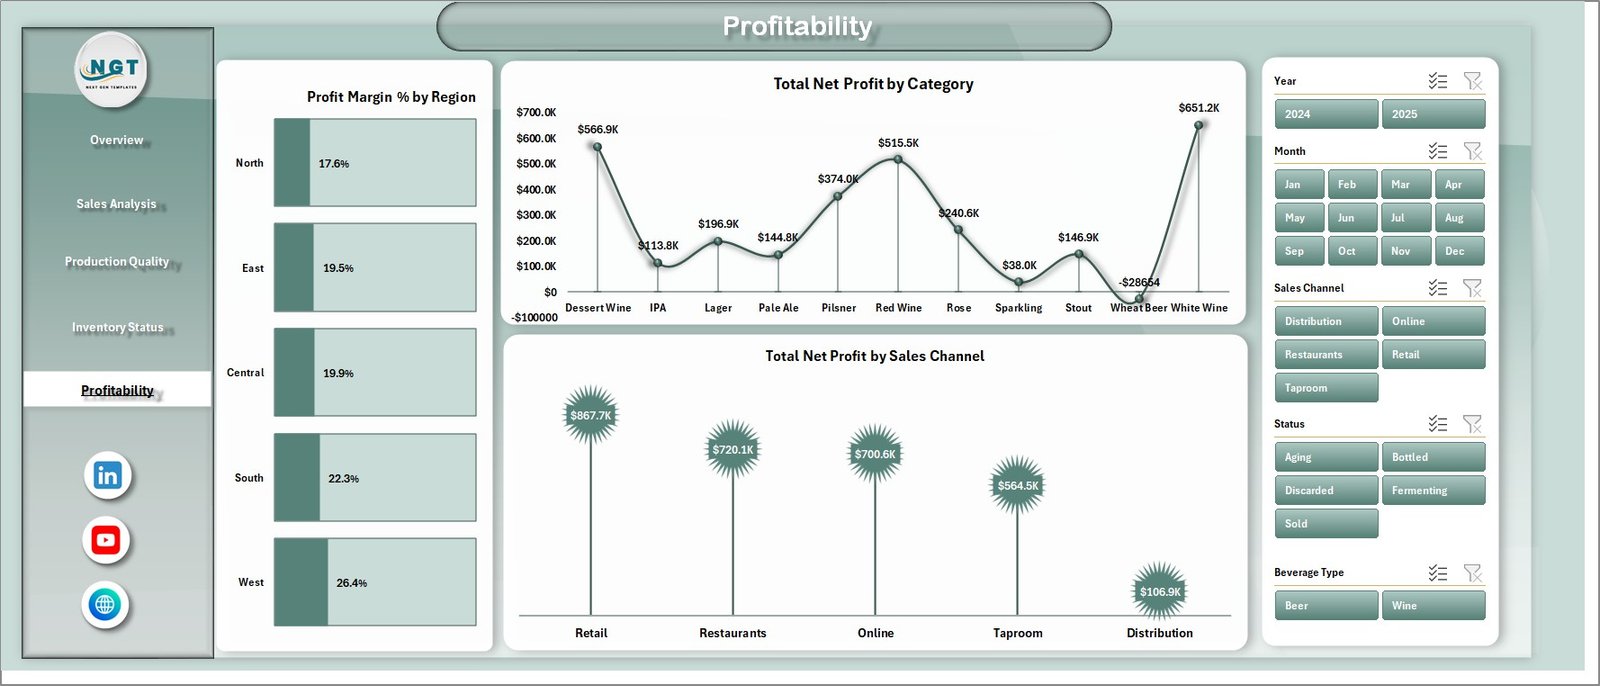
Profitability
Click here to Purchase the Brewery & Winery Dashboard in Excel
The Profitability page strips production volume out of the picture and isolates pure profit contribution. Three charts — Profit Margin % by Region, Total Net Profit by Category, and Total Net Profit by Sales Channel — answer the questions that matter most for monthly leadership reviews and pricing decisions. Are wholesale margins really lower than retail? Which beverage category subsidizes the rest of the portfolio?
6. Data Sheet
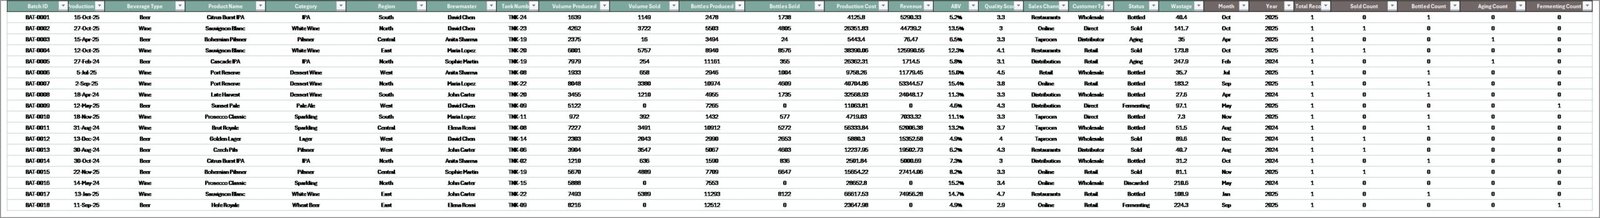
Data Sheet tab
The Data sheet is a single, structured tab where you replace the sample dataset with your own batch records. Maintain the same column format — batch ID, brewmaster, beverage type, ABV, quality score, region, channel, customer type, volume, cost, revenue, status — and every chart on every page refreshes through the supporting pivot layer.
7. Support Sheet
Support sheet tab
The Support sheet is a hidden-by-default tab containing the multiple pivot tables that drive every chart and slicer. After updating the Data tab, click Data → Refresh All in the Excel Ribbon and every pivot, chart, and KPI card across all 5 pages updates instantly. Power users can unhide this sheet to extend the pivot model with new measures or dimensions.
Brewery & Winery Dashboard in Excel vs. Power BI Equivalent vs. Ekos / VinSUITE / Orchestrated — Feature Comparison
| Feature | Brewery & Winery Dashboard in Excel | Power BI Equivalent | Ekos / VinSUITE / Orchestrated |
|---|---|---|---|
| Cost | $17.99 one-time | $11.99 one-time | $200–$1,500/month |
| Platform | Microsoft Excel (desktop) | Power BI Desktop | Cloud SaaS |
| Setup time | Under 10 minutes | 15–20 minutes | 2–6 weeks |
| Real-time team collaboration | Via SharePoint / OneDrive | Via Power BI Service | Built-in |
| Mobile access | Excel mobile app | Power BI mobile app | Native iOS / Android |
| Customizable charts & KPIs | Unlimited | Unlimited | Limited to plan |
| Slicer-based filtering on every page | Yes | Yes | Yes |
| Year-1 cost at 5 users | $17.99 total | $11.99 total | $2,400–$18,000 |
For breweries and wineries that want unified analytics without paying $200+/month for craft-beverage SaaS, the Brewery & Winery Dashboard in Excel sits in the sweet spot.
Who Should Use This Template
Perfect for:
- Craft brewery owners and head brewers tracking batch yield, ABV consistency, and brewmaster quality scores
- Winery owners and winemakers monitoring fermentation batches, bottle revenue, and regional sales
- Operations managers at small-to-mid-size breweries and wineries (1–100 employees)
- Finance and revenue teams tracking profit margin by region, channel, and beverage category
- Beverage industry consultants who need a client-ready batch-and-sales tracker
Not a fit if:
- You need real-time IoT integration with fermentation tank sensors and bottling lines
- Your operation requires TTB excise tax automation, lot genealogy, or full crush-to-bottle compliance reporting
- You need multi-location ERP-grade inventory and supply chain management
Real-World Use Cases
Daniel runs a craft brewery in Portland with 4 brewmasters and 18 active beverages. He uses the Brewery & Winery Dashboard in Excel to compare avg. quality score by brewmaster across his IPA, lager, and stout batches each month. The Sales Analysis page tells him whether his taproom or wholesale channel is dragging the overall margin down — replacing a $300/month Ekos seat for the parts of the workflow he actually uses.
Camille manages a 12-acre family winery in the Loire Valley. She tracks Total Net Profit by Region across her three distributor markets and uses the Profitability page to decide which beverage categories deserve more cellar space next harvest. The Inventory Status page surfaces which beverage types are over-produced relative to volume sold — invaluable input for next year’s grape contracts.
Anika consults for five small wineries and craft breweries across India. She standardizes the same Data sheet schema across every client, then delivers monthly performance reviews using the dashboard’s 5-page structure. Saves her roughly 6 hours per client compared to building decks from scratch in PowerPoint.
Advantages of Brewery & Winery Dashboard in Excel
Click here to Purchase the Brewery & Winery Dashboard in Excel
This dashboard delivers immediate value at $17.99 one-time, replacing monthly subscriptions that cost $200 to $1,500/month for platforms like Ekos, VinSUITE, and Orchestrated. The Excel-based format means full offline access — useful for vineyard managers and brewery operators working in areas with limited internet connectivity.
Teams can customize every KPI without waiting for vendor support. The pivot-driven architecture means you can extend the Data sheet with new columns and the Support sheet with new pivot tables, then bind any new chart to the existing data structure in minutes. Setup takes under 10 minutes — drop your data in, click Refresh All, done.
The 5-page layout maps cleanly to how craft beverage businesses actually operate: an executive overview, channel analysis, production quality review, inventory pressure, and pure profitability. Each page is filterable through multi-select slicers, and the chart ranges automatically expand as you add new batches.
Opportunities for Improvement
The Brewery & Winery Dashboard tracks production and sales analytics effectively but does not include automated data imports from POS terminals, brewery management systems, or IoT fermentation sensors. Users need to update the Data sheet manually each cycle. The template also does not include regulatory compliance features like TTB reporting, excise tax calculations, or lot genealogy tracking. For breweries and wineries needing end-to-end process management, dedicated craft-beverage software may be a better fit alongside this dashboard for high-level analytics.
Best Practices
Update the Data sheet at the start of each month with the previous month’s actual batch, sales, and quality records. Use the same column structure as the sample dataset to ensure pivot tables refresh cleanly. Click Data → Refresh All after every data update — this is the single most common mistake new users make. Consistently use the slicers during monthly management reviews to filter views by region or channel; don’t try to read the unfiltered dashboard in isolation. Share the file via OneDrive or SharePoint for team collaboration while maintaining version control. Customize the Beverage Type and Category fields to match your portfolio — a brewery focused on IPA variants will have different categories than a winery tracking varietals.
Explore Relevant Templates
🍺 Craft Brewery KPI Scorecard in Excel — A structured 4-sheet KPI scorecard for breweries with MTD/YTD trend charts, color-coded indicators, and individual KPI drill-down.
🍷 Winery KPI Scorecard in Excel — Track 10+ winery KPIs including grape yield, fermentation efficiency, and revenue per bottle.
🥃 Distillery KPI Scorecard in Excel — Adjacent template for craft distilleries tracking spirit yield, cask fill rate, and aging metrics.
📊 Cross-platform: Microbreweries KPI Dashboard in Power BI | Winemaking KPI Dashboard in Power BI for teams on the Power BI stack.
📂 Browse all Excel Dashboard Templates | Winery KPI Scorecard tutorial.
Frequently Asked Questions
Click here to Purchase the Brewery & Winery Dashboard in Excel
What KPIs does the Brewery & Winery Dashboard in Excel track?
The Brewery & Winery Dashboard in Excel tracks 5 headline KPIs (Total Revenue, Total Production Cost, Total Volume Sold, Total Net Profit, Total Batches) plus 17 charts covering revenue vs cost trends, profit margin %, sell-through by beverage type, brewmaster quality scores, ABV consistency, and regional profitability — all updating automatically when you refresh the Data sheet.
How long does it take to set up the Brewery & Winery Dashboard?
Setup takes under 10 minutes. Replace the sample data on the Data sheet with your own batch, sales, and quality records, then click Data → Refresh All on the Excel Ribbon. Every chart, KPI card, and slicer across all 5 pages updates instantly — no formula rewriting or chart re-binding required.
Can I use this dashboard for just a brewery or just a winery?
Yes. The Brewery & Winery Dashboard in Excel works equally well for breweries-only, wineries-only, or combined craft beverage operations. Use the Beverage Type slicer to filter to only beer, only wine, or any sub-category. The chart titles and KPI definitions stay neutral so the dashboard fits either business.
How does this compare to Ekos or VinSUITE?
The Brewery & Winery Dashboard costs $17.99 one-time versus $200–$1,500/month for full craft-beverage SaaS like Ekos, VinSUITE, or Orchestrated. It covers the analytics and reporting layer without the production planning, lot tracking, or compliance modules. Ideal for teams that want strong dashboard reporting without the SaaS subscription burden.
Do I need to know advanced Excel to use this template?
No. The Brewery & Winery Dashboard in Excel is fully built on pivot tables and standard charts — no DAX, no VBA, no macros. If you can paste data into a table and click Refresh All, you can run this dashboard. The Support sheet is hidden by default so the dashboard stays clean for end users.
Which version of Excel do I need?
The dashboard works with Microsoft Excel 2016 and later, including Microsoft 365 on Windows and Mac. Slicers and pivot charts are core Excel features available across all modern versions. No add-ins required.
About the Author
Built by PK — Microsoft Certified Professional with 15+ years of Excel, Google Sheets, and Power BI experience. Founder of NextGenTemplates, reaching 300K+ subscribers across YouTube channels (@PK-AnExcelExpert, @NextGenTemplates, @NeoTechNavigators). Every template is hand-built and tested before release.
Conclusion
The Brewery & Winery Dashboard in Excel gives craft brewery owners, winery operators, and beverage industry consultants a structured, affordable way to track production, sales, quality, inventory, and profitability across 5 analysis pages — without paying $200 to $1,500 per month for cloud SaaS. With 5 headline KPIs, 17 interactive charts, multi-page slicers, and a single-refresh data architecture, it replaces manual reporting and expensive subscriptions with a one-time $17.99 investment.
Click here to Purchase the Brewery & Winery Dashboard in Excel
✅ Instant download · One-time payment · No subscription · Lifetime access
📅 Last updated: May 2026
Visit our YouTube channel for step-by-step video tutorials: Youtube.com/@PK-AnExcelExpert