Nonprofits managing grant portfolios lose an estimated 3–5 hours per week compiling progress reports that could be automated. The Nonprofit Grant Dashboard in Power BI addresses this directly: it tracks 12+ grant management KPIs across 5 interactive dashboard pages, with 14+ pre-built charts covering funder analysis, program impact, compliance reporting, and pipeline trends — all in a single .pbix file that updates automatically when your data refreshes. According to Microsoft, Power BI Desktop has over 5 million active users globally, and nonprofit grant management is one of the fastest-growing use cases for data analytics outside the enterprise sector.
Whether you manage 10 grants or 200, this dashboard replaces manual Excel reporting and expensive grants management platforms with a one-time-purchase template you can set up in under 10 minutes. In this post, we walk through every page, chart, and KPI included in the template.
Key Features of Nonprofit Grant Dashboard in Power BI
The Nonprofit Grant Dashboard in Power BI is built around five dedicated pages, each serving a distinct audience within a nonprofit organization — from executive director to field compliance officer. The template includes:
- 5 interactive dashboard pages covering every stage of the grant lifecycle from application to compliance
- 5 headline KPI cards on the Overview page giving instant portfolio status at a glance
- Approval Rate analytics broken down by funder, priority, and month — the three dimensions grant managers care about most
- Beneficiary-level impact tracking by region, beneficiary type, and grant manager compliance score
- Pipeline trend visualization showing monthly award amounts and approval rate trends for strategic forecasting
- Free Power BI Desktop compatibility — no Power BI Pro license required for local use
- Instant download — one-time payment, lifetime access, no subscription or per-user fees
Every visual includes interactive slicers that let you filter the entire dashboard by program area, funder type, region, grant stage, or time period — giving you a custom view in seconds without touching any code.
Dashboard Pages Explanation
Page 1: Overview Page
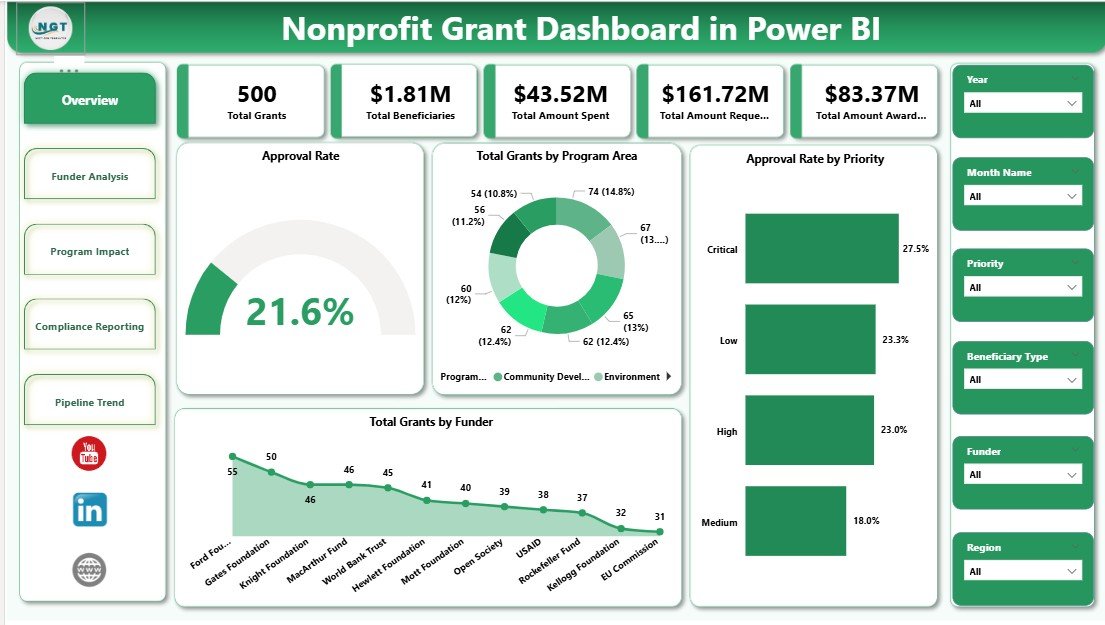
The Overview page opens with five KPI cards displaying Total Grants, Total Beneficiaries, Total Amount Spent, Total Amount Requested, and Total Amount Awarded. These five numbers answer the question every grant director faces at the start of each board meeting: “Where do we stand?” Below the cards, four charts break down the portfolio: Approval Rate (overall), Total Grants by Program Area, Approval Rate by Priority, and Total Grants by Funder. Together they give a full executive summary of grant portfolio health.
Nonprofit Grant Dashboard in Power BI — Overview Page
Page 2: Funder Analysis
The Funder Analysis page provides three targeted visuals: Total Amount Spent by Funder Type, Approval Rate by Funder Type, and Total Beneficiaries by Program Area. This page answers the critical development question: which funders are delivering the most value per dollar awarded, and which program areas are generating the highest beneficiary counts? Development teams use this page to prioritize proposal-writing time and justify funder relationship investments to leadership.
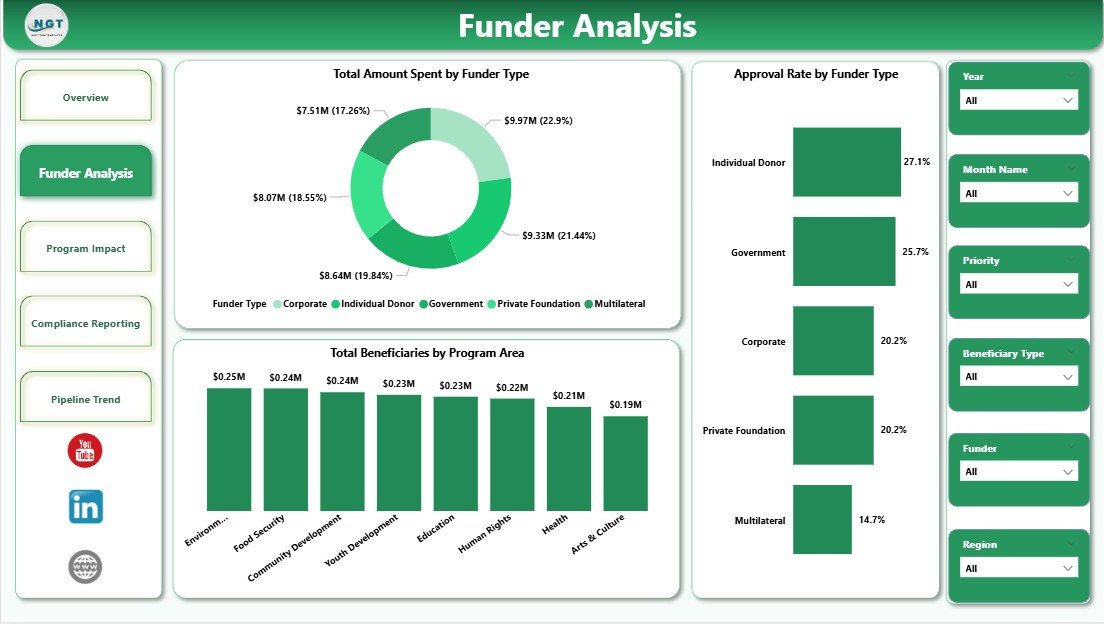
Nonprofit Grant Dashboard in Power BI — Funder Analysis Page
Page 3: Program Impact
The Program Impact page tracks three metrics that directly answer donor and board accountability questions: Total Beneficiaries by Region, Total Beneficiaries by Beneficiary Type, and Average Compliance Score by Grant Manager. The compliance score metric is particularly powerful — it identifies which staff members are staying on top of reporting requirements versus which ones may need additional support, enabling proactive management before a compliance issue escalates into a reporting failure.
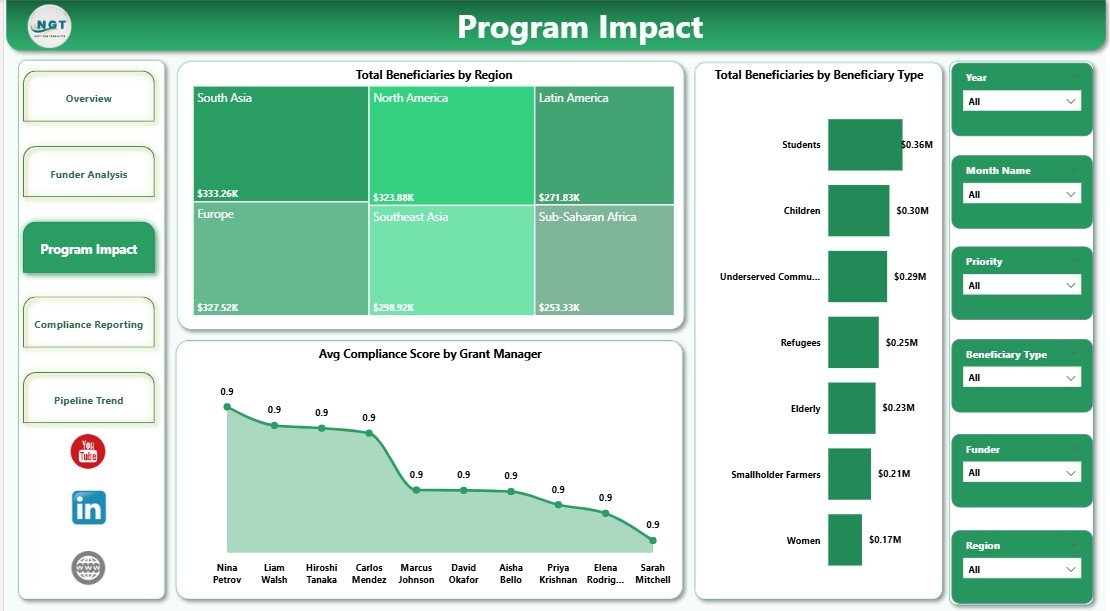
Nonprofit Grant Dashboard in Power BI — Program Impact Page
Page 4: Compliance Reporting
The Compliance Reporting page surfaces three audit-critical visuals: Approval Rate by Priority, Total Grants by Month Name, and Total Grants by Stage. The Total Grants by Stage view is especially useful for grant renewal planning — it immediately shows how many grants are in each pipeline stage (submitted, under review, awarded, closed), so program staff can anticipate workload spikes and reporting deadlines weeks in advance.
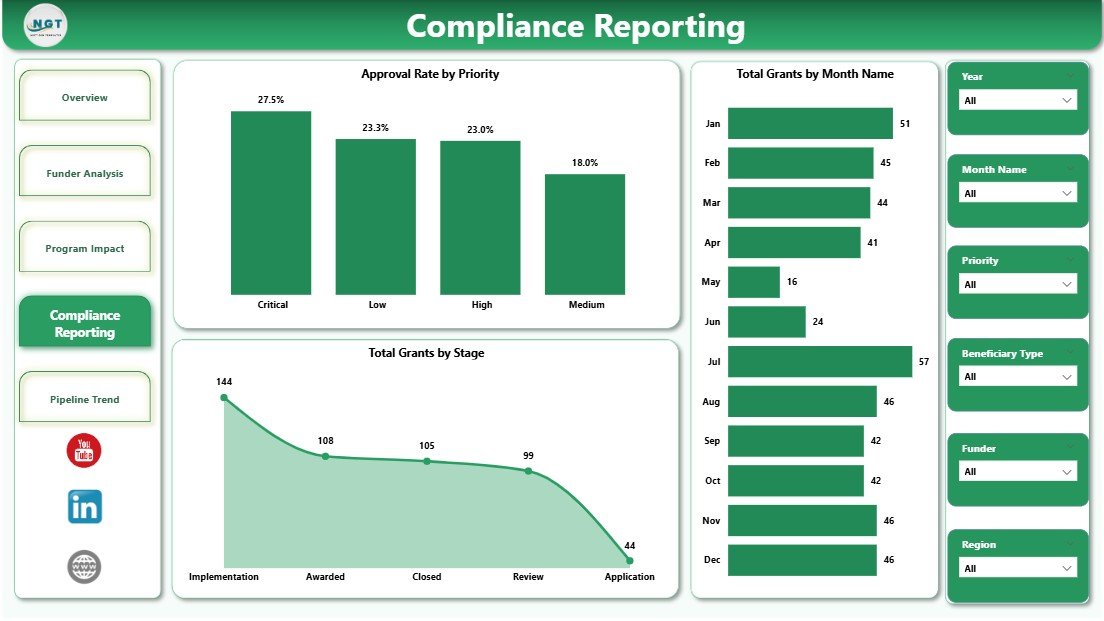
Nonprofit Grant Dashboard in Power BI — Compliance Reporting Page
Page 5: Pipeline Trend
The Pipeline Trend page is built for strategic planning, showing Total Amount Awarded by Region, Approval Rate by Month Name, and Total Grants by Month Name. Organizations that analyze 12–24 months of historical grant data frequently discover seasonal funding windows where approval rates spike — intelligence that allows them to front-load their strongest applications during high-probability periods. This page provides exactly that visibility.
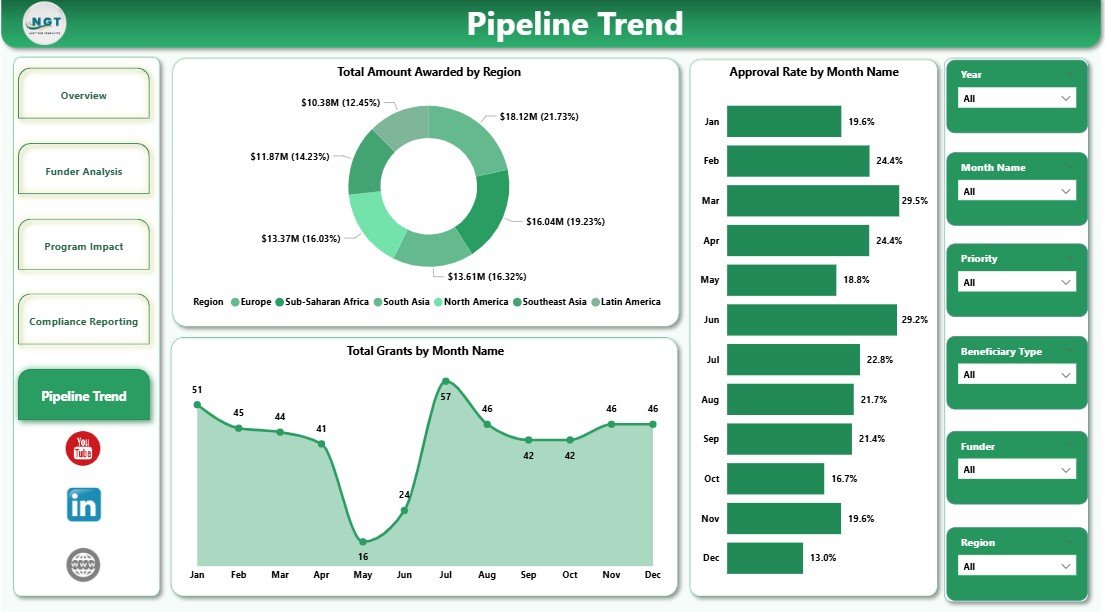
Nonprofit Grant Dashboard in Power BI — Pipeline Trend Page
Nonprofit Grant Dashboard in Power BI vs. Tableau / Qlik vs. Fluxx Grants Management
| Feature | Nonprofit Grant Dashboard in Power BI | Tableau / Qlik Sense | Fluxx / Salesforce Grants Mgmt |
|---|---|---|---|
| Cost | $17.99 one-time | $70–$115/user/month | $500–$2,000+/month |
| Platform | Power BI Desktop (free) | Requires paid license | Cloud-only SaaS |
| Setup Time | Under 10 minutes | Days to weeks | Weeks to months |
| Grant-Specific KPIs | ✅ 12+ pre-built | Build from scratch | ✅ Included |
| No Subscription | ✅ One-time purchase | ❌ Monthly required | ❌ Annual contract |
| Customizable Fields | ✅ Full Power BI access | ✅ Yes | Limited without dev work |
| Compliance Reporting | ✅ Built-in page | Manual build required | ✅ Included |
| Year-1 Cost (5 users) | $17.99 total | $4,200–$6,900 | $6,000–$24,000 |
For nonprofits that need grant tracking and compliance reporting without a five-figure annual SaaS contract, the Nonprofit Grant Dashboard in Power BI sits in the sweet spot.
Who Should Use This Template
✅ Perfect for:
- Nonprofit grant managers tracking 5–200 active grants across multiple funders
- Development directors who need board-ready funder analysis reports monthly
- Program officers responsible for documenting beneficiary reach and compliance scores
- Small-to-midsize nonprofits that cannot justify $500+/month for dedicated grants management platforms
- Finance staff who already use Power BI Desktop for other organizational reporting
❌ Not a fit if:
- You need real-time cloud collaboration for 50+ simultaneous Power BI users (requires Power BI Premium)
- Your grant workflow requires an embedded online application intake portal (this is an analytics dashboard, not a grant portal)
- Your team has no Power BI experience and isn’t open to a basic learning curve for data connections
Real-World Use Cases
Maria manages grants at a 20-person human services nonprofit. Every quarter, she presents a funding report to her board showing which program areas received the most money, which funders had the highest approval rates, and whether compliance scores by grant manager are trending up or down. Before this dashboard, she built these charts manually in Excel for 4 hours every quarter. Now she refreshes one .pbix file and her board report is ready in 20 minutes — saving her roughly 15 hours per year just on quarterly reporting.
James leads development at an international NGO managing 40 active grants across 6 regions. He uses the Pipeline Trend page to identify which months historically deliver the highest approval rates, allowing his team to front-load the strongest applications during high-probability windows. The Funder Analysis page helps him calculate beneficiary ROI by funder — total beneficiaries per dollar awarded — when deciding where to invest limited proposal-writing capacity.
A regional community foundation grants officer uses the Compliance Reporting page to track every grant from submission to close. The Total Grants by Stage chart immediately surfaces how many grants are stuck in review — a leading indicator of upcoming workload spikes — while Approval Rate by Priority validates whether the team’s prioritization decisions are actually producing higher conversion rates.
Advantages of Nonprofit Grant Dashboard in Power BI
- Immediate ROI — at $17.99 one-time, the dashboard pays for itself the first time it saves 30 minutes of manual reporting
- No lock-in — since it’s a .pbix file, your data stays in your environment; no vendor, no contract, no risk of a platform shutdown
- Purpose-built pages — unlike generic dashboard templates, each of the 5 pages maps directly to a specific grant management use case
- Compliance-first design — the dedicated Compliance Reporting page is built for the audit and renewal cycles that most grant management tools treat as an afterthought
- Free platform — Power BI Desktop is completely free from Microsoft, meaning total cost of ownership for local use remains $17.99
Opportunities for Improvement
- No cloud collaboration out of the box — sharing the live dashboard with colleagues requires either publishing to Power BI Service (free tier available, but sharing requires Pro licenses) or exporting pages as PDF
- Manual data refresh — the dashboard does not auto-refresh on a schedule unless connected to a cloud data source and published to Power BI Service with a gateway configured
- Not a grant portal — organizations needing an online application intake system will need a separate tool; this dashboard is for analytics and reporting only
Best Practices
- Maintain a consistent grant data schema in your Excel or database source — column names like Grant ID, Funder Type, Program Area, Stage, and Compliance Score should match the template’s expected field names
- Refresh the dashboard monthly at minimum to keep Pipeline Trend and Compliance Reporting pages meaningful
- Use the export-to-PDF function for board presentations — the five-page layout prints cleanly with full chart fidelity
- Bookmark the Microsoft Power BI Desktop documentation at Microsoft Learn — Power BI Desktop for guidance on connecting to custom data sources
- If your team moves to Power BI Service, use row-level security to ensure each grant manager only sees the grants they manage
Explore Relevant Templates
Looking for grant analytics in a different application? The same template is available as the Nonprofit Grant Dashboard in Excel — ideal for teams that prefer spreadsheets over Power BI. Other related templates from NextGenTemplates:
- Grant Management KPI Dashboard in Google Sheets — a Google Sheets alternative covering grant tracking KPIs
- Fundraising Campaign KPI Dashboard in Google Sheets — track fundraising campaigns alongside your grant portfolio
- Educational NGOs KPI Dashboard in Excel — built specifically for education-focused nonprofit organizations
- Disaster Relief KPI Dashboard in Google Sheets — for humanitarian organizations tracking emergency response metrics
Frequently Asked Questions
What KPIs does the Nonprofit Grant Dashboard in Power BI track?
The Nonprofit Grant Dashboard in Power BI tracks 12+ KPIs including Total Grants, Total Beneficiaries, Total Amount Spent, Total Amount Requested, Total Amount Awarded, Approval Rate, grant stage distribution, Average Compliance Score by Grant Manager, and beneficiary breakdowns by region and type. All metrics auto-update when you refresh the data source.
Do I need a paid Power BI license to use this dashboard?
No paid license is required for local use. The Nonprofit Grant Dashboard in Power BI runs on Power BI Desktop, which Microsoft provides free of charge. You only need a Power BI Pro license (currently $10/user/month) if you want to publish the dashboard to Power BI Service and share live reports with colleagues via browser.
How long does setup take?
Setup takes under 10 minutes. Download the .pbix file, open it in Power BI Desktop, connect your grant data source (Excel, CSV, SharePoint, or database), and all 5 pages and 14+ charts refresh automatically. No DAX formula writing or visual creation required — everything is pre-built and ready to use.
How does the Nonprofit Grant Dashboard in Power BI compare to Fluxx or Salesforce Grants Management?
The Nonprofit Grant Dashboard in Power BI costs $17.99 one-time versus $500–$2,000+ per month for dedicated platforms like Fluxx or Salesforce NPSP Grants Management. It provides grant analytics and compliance reporting dashboards, but it does not include grant application intake workflows or applicant-facing portals. For analytics-first teams on a budget, this template delivers 80% of the reporting value at under 1% of the annual cost.
Can I customize the charts or add new KPIs?
Yes. As a standard .pbix file, you have full access to Power BI’s report canvas to add, remove, or modify any visual, write new DAX measures, rename fields, or restructure filters to match your organization’s exact grant data taxonomy. No vendor permission needed — you own the file.
Is this dashboard compatible with Google Sheets or Excel data?
Yes. The Nonprofit Grant Dashboard in Power BI connects natively to Excel (.xlsx) files, CSV files, SharePoint Lists, Google Sheets via ODBC, and any SQL or cloud database supported by Power BI’s data connectors. If your grant data lives in Excel today, you can connect it with a single click.
Where can I get help if I need to customize the template?
PK’s YouTube channel @PK-AnExcelExpert has 300K+ subscribers and covers Power BI tutorials including data connections, DAX measures, and custom visuals. NextGenTemplates also offers custom dashboard development services if your organization requires a tailored solution beyond this template’s standard configuration.
About the Author
Built by PK — Microsoft Certified Professional with 15+ years of Excel, Google Sheets, and Power BI experience. Founder of NextGenTemplates, reaching 300K+ subscribers across YouTube channels. Every template is hand-built and tested before release.
Conclusion
The Nonprofit Grant Dashboard in Power BI gives grant managers, development directors, and program officers a complete analytics solution across five purpose-built pages — from executive overview to pipeline trend forecasting. At $17.99 one-time with no subscription or per-user fees, it replaces hours of manual reporting with a 10-minute setup that auto-updates every time your data refreshes.
👉 Click here to Purchase the Nonprofit Grant Dashboard in Power BI
✅ Instant download · One-time payment · No subscription · Lifetime access
Visit our YouTube channel for step-by-step tutorials: Youtube.com/@PK-AnExcelExpert
📅 Last updated: May 2026