Managing grant funding is one of the most documentation-intensive tasks in nonprofit operations. The Nonprofit Grant Dashboard in Excel solves this by consolidating 5 KPIs, 17 pre-built charts, and 5 interactive analysis pages into a single pivot-powered workbook. Setup takes under 10 minutes — replace the sample data, click Refresh All, and your entire dashboard updates instantly.
🌍 Join 8,400+ nonprofits, foundations, and NGOs in 40+ countries who use NextGenTemplates to manage operations without recurring SaaS subscriptions.
✅ Instant download · One-time payment at $17.99 · No subscription · Lifetime access
Key Features of the Nonprofit Grant Dashboard in Excel
The Nonprofit Grant Dashboard in Excel is built around five core capabilities that address real pain points in grant management:
5 KPI summary cards: The dashboard’s top row shows Total Awarded, Total Records, Total Beneficiaries, Total Spent, and Unspent Funds Amount. These five indicators give grant managers and executive directors an instant snapshot of funding health without digging through rows of data.
17 pre-built charts across 5 pages: From approval rates and funder analysis to program impact, compliance burn rates, and pipeline trends, every chart is pivot-powered and updates automatically when you refresh after entering new data.
Slicer-powered interactivity: Multi-level slicers are pre-configured on each analysis page. Click once to filter the entire dashboard by program area, funder type, project status, or grant manager — no formula editing required.
Pivot-table architecture: A hidden Support Sheet houses all pivot tables that feed the charts. After updating your data, go to Data → Refresh All in the Excel Ribbon and every visualization updates in seconds. According to Microsoft’s Excel documentation on PivotTables, pivot tables are one of Excel’s most efficient tools for summarizing large datasets — and this dashboard leverages them fully.
Compliance and burn rate visibility: The Compliance Reporting page tracks Total Records by Stage and Priority, Burn Rate % by Grant Manager, and Total Requested by Month — delivering audit-ready data funders and auditors can understand at a glance.
Dashboard Pages Explanation
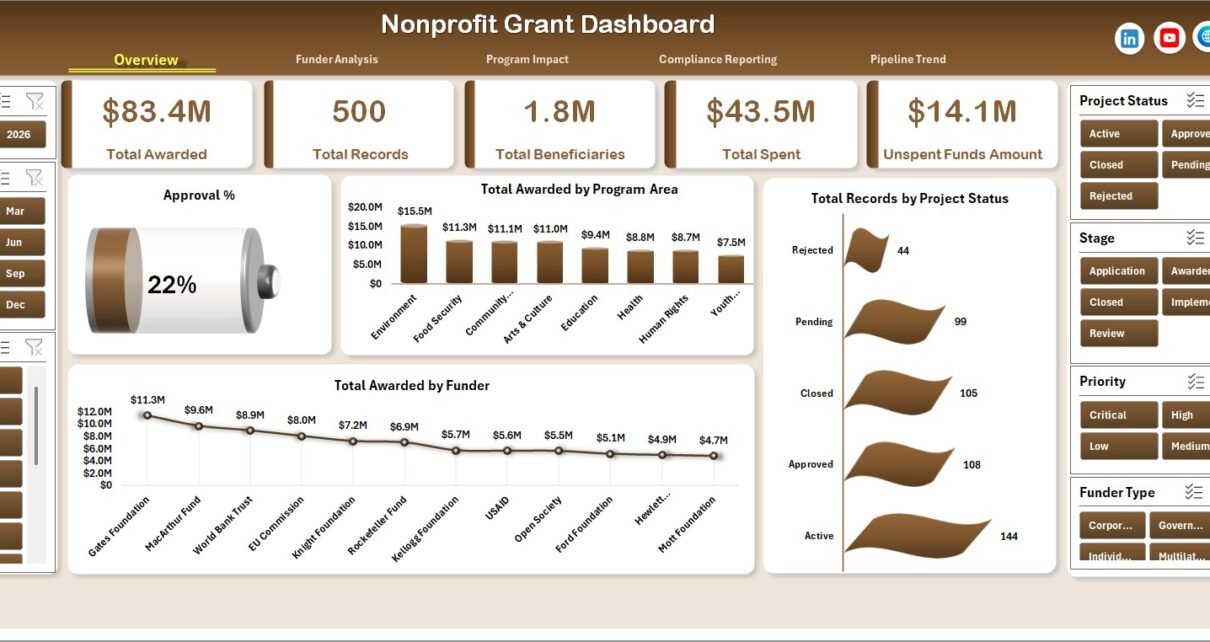
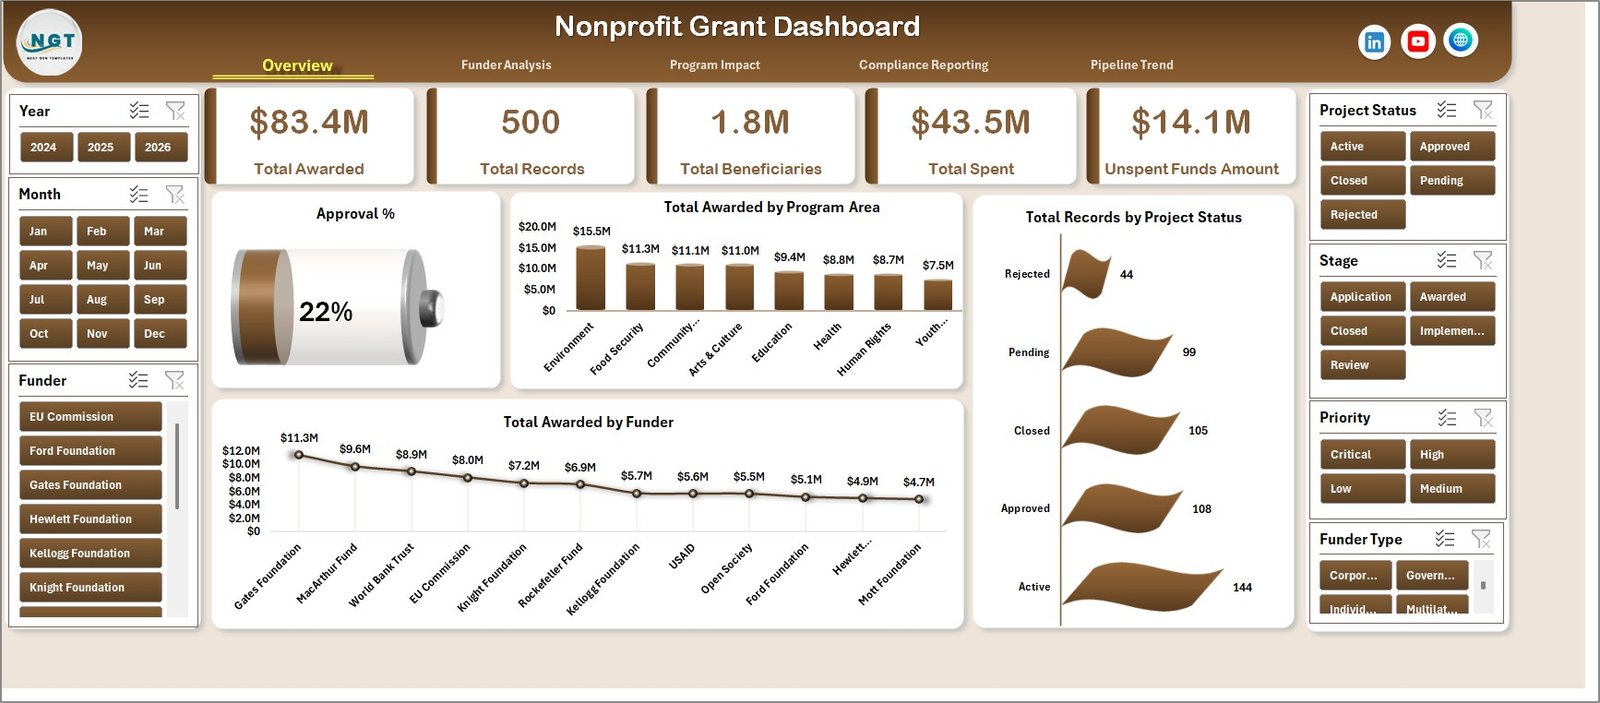
Nonprofit Grant Dashboard — Overview Page
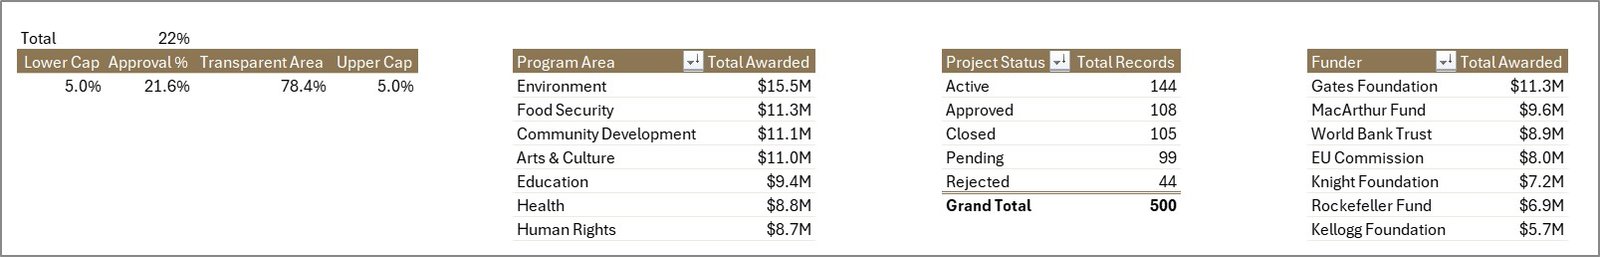
Overview Page: The executive summary hub. Five KPI cards at the top give instant visibility into Total Awarded, Total Records, Total Beneficiaries, Total Spent, and Unspent Funds Amount. Below, four charts break down: Approval %, Total Awarded by Program Area, Total Records by Project Status, and Total Awarded by Funder. Slicers across the top let stakeholders filter the full view in seconds.
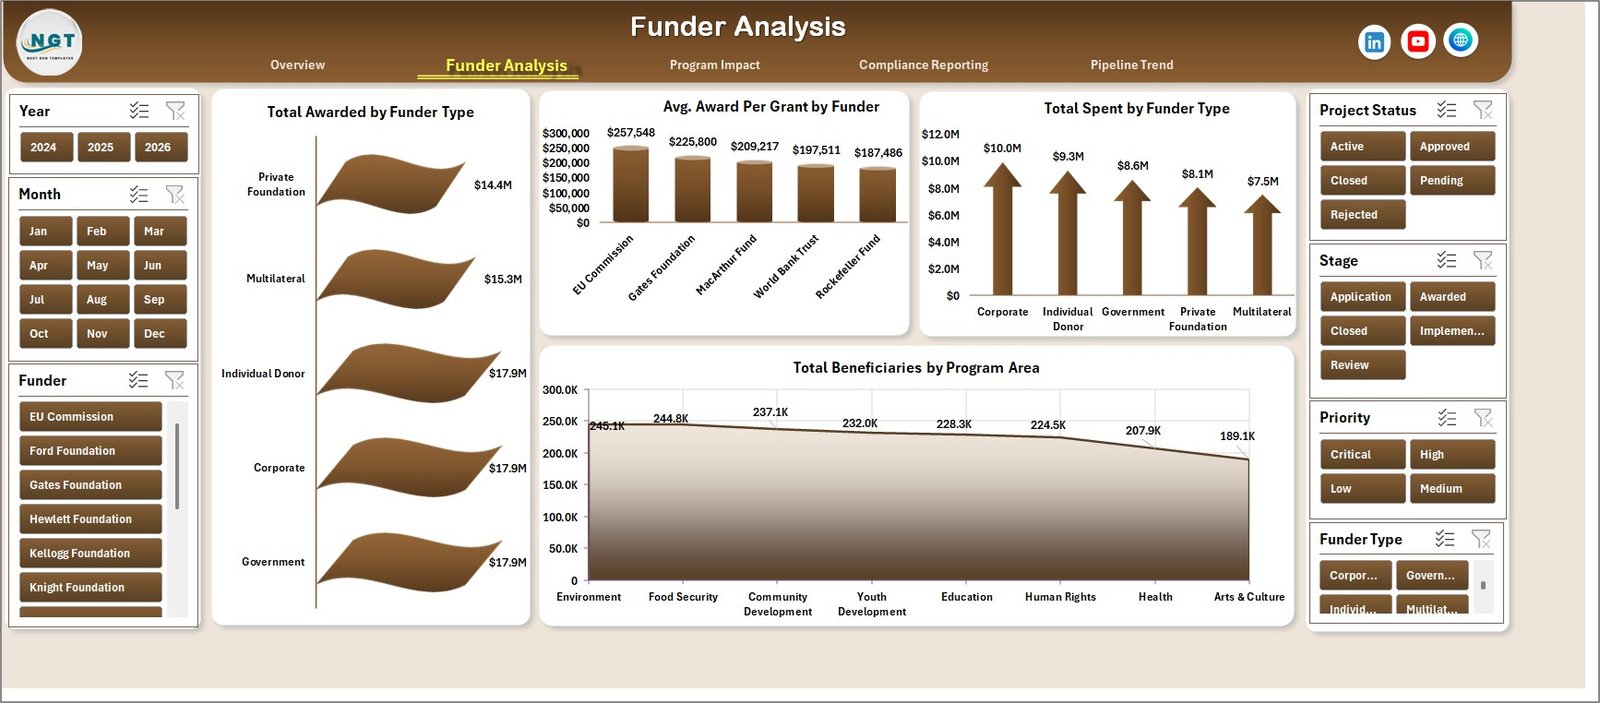
Nonprofit Grant Dashboard — Funder Analysis Page
Funder Analysis Page: Four charts examine your funder relationships in depth: Total Awarded by Funder Type, Avg. Award Per Grant by Funder, Total Spent by Funder Type, and Total Beneficiaries by Program Area. This page is valuable for annual funder reports and renewal strategy discussions.
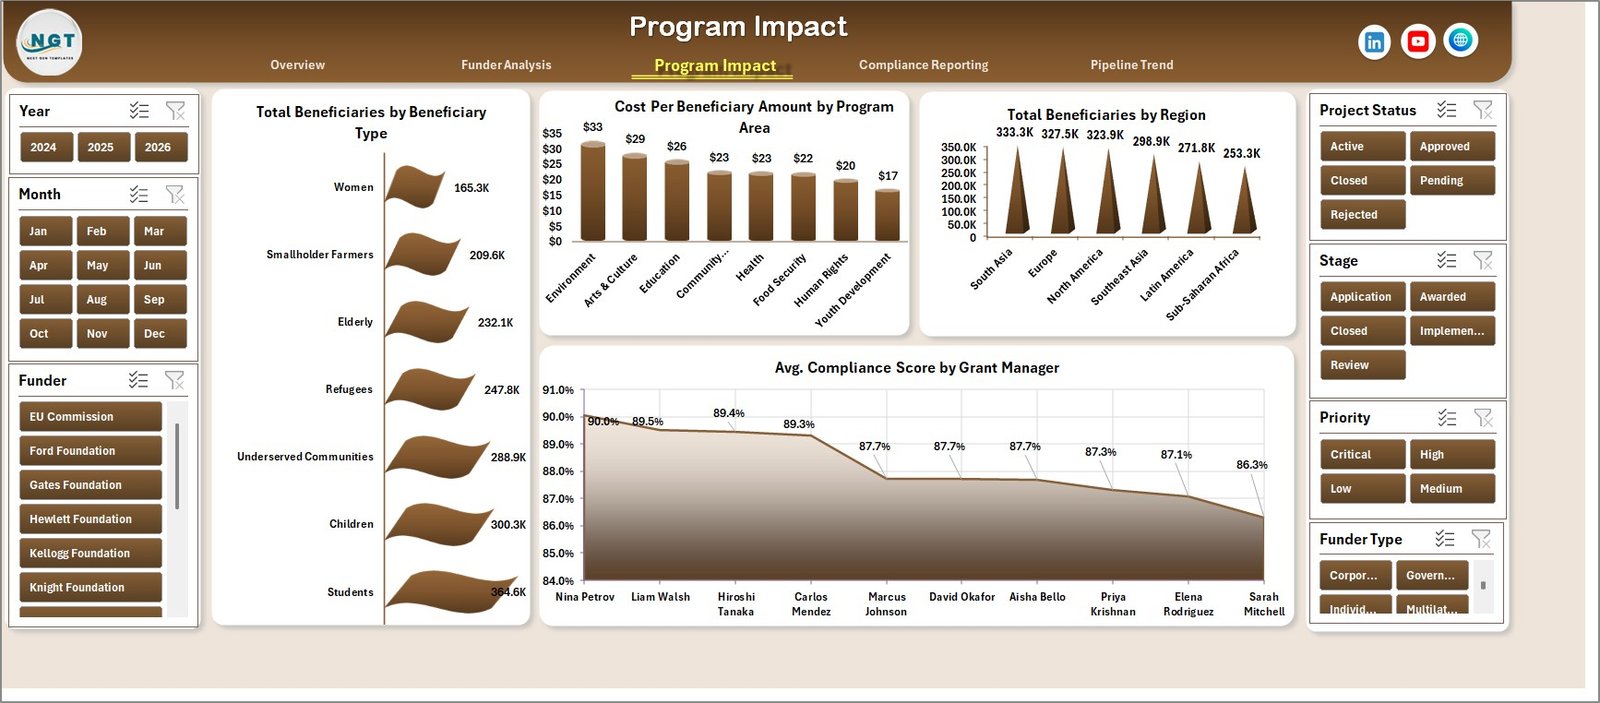
Nonprofit Grant Dashboard — Program Impact Page
Program Impact Page: Shows the reach and cost-effectiveness of each program: Total Beneficiaries by Beneficiary Type, Cost Per Beneficiary Amount by Program Area, Total Beneficiaries by Region, and Avg. Compliance Score by Grant Manager. This data drives impact reports and helps justify grant renewals.
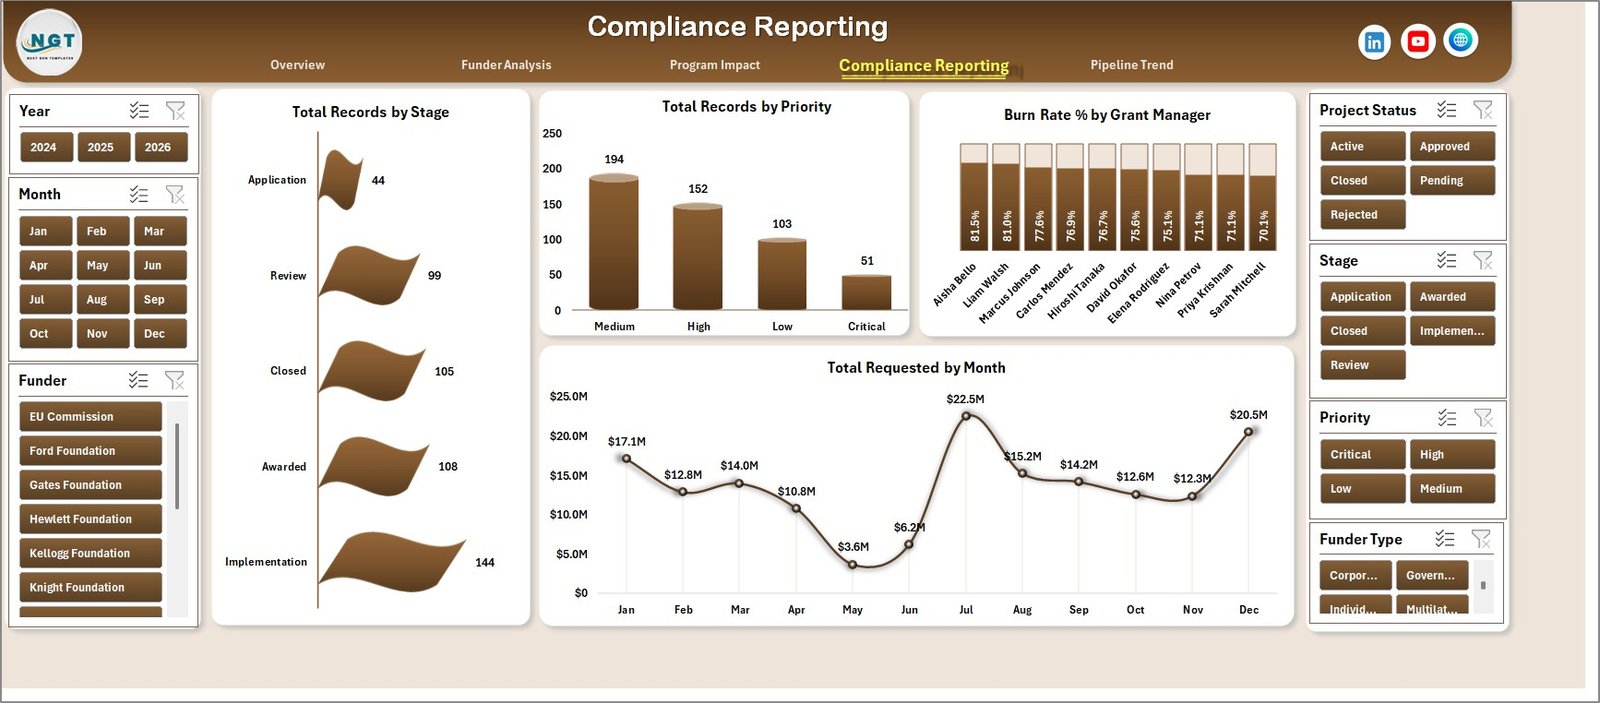
Nonprofit Grant Dashboard — Compliance Reporting Page
Compliance Reporting Page: Designed for grant administrators managing government and foundation grants: Total Records by Stage, Total Records by Priority, Burn Rate % by Grant Manager, and Total Requested by Month. This page catches underspending or overspending risks before they become compliance issues.
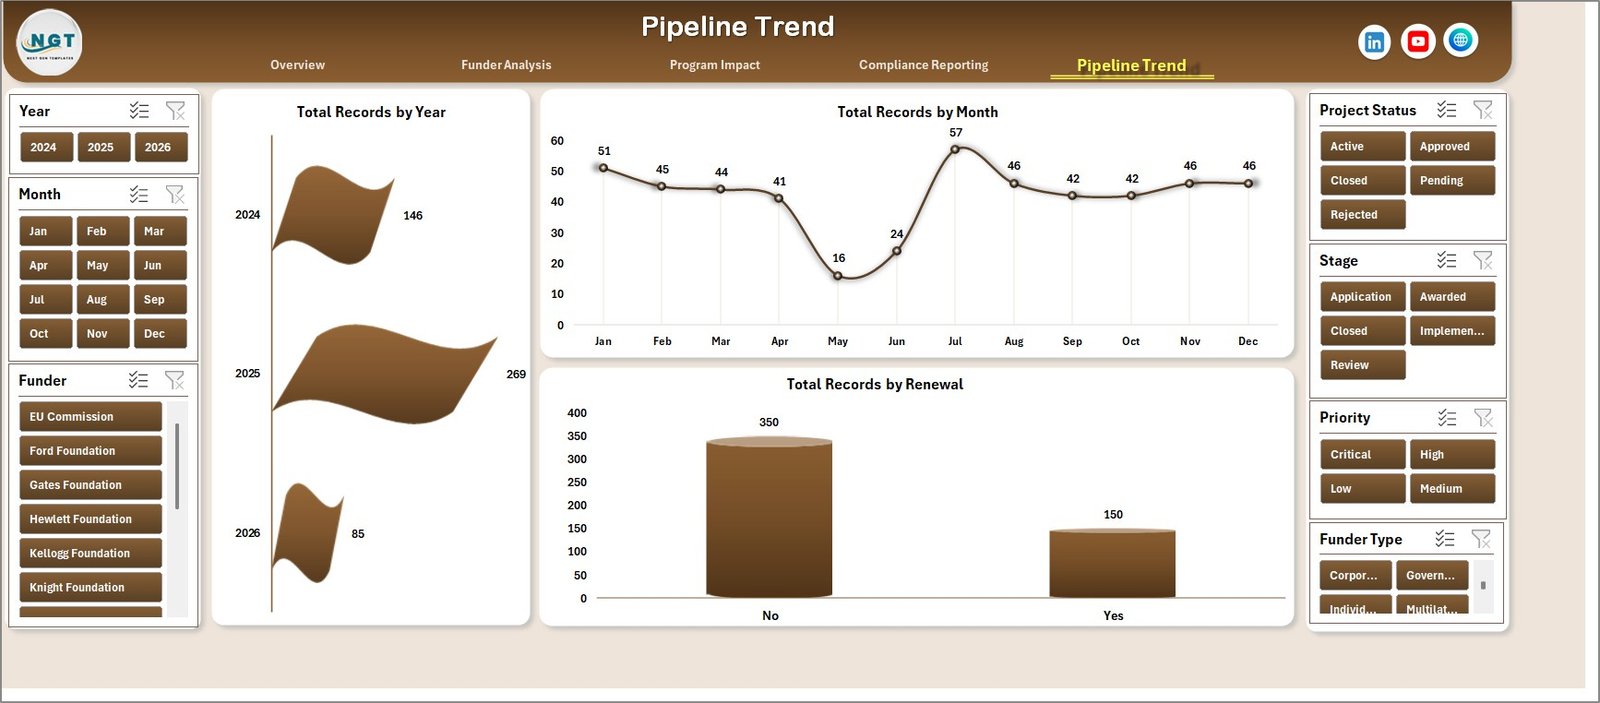
Nonprofit Grant Dashboard — Pipeline Trend Page
Pipeline Trend Page: Tracks the grant pipeline across time: Total Records by Year, Total Records by Month, and Total Records by Renewal. Year-over-year comparisons support strategic planning and help identify seasonal patterns in funding cycles.
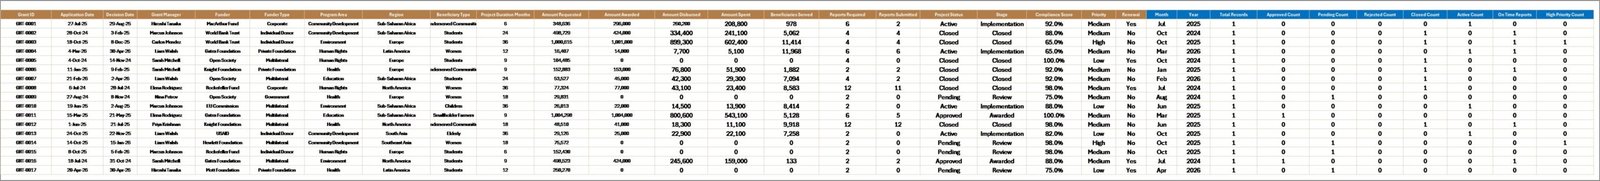
Nonprofit Grant Dashboard — Data Sheet Tab
Data Sheet: All grant records go here in the standardized column format provided. This is the only tab you need to update — paste your data, refresh the pivots, and every analysis page updates.
Nonprofit Grant Dashboard — Support Sheet Tab
Support Sheet: Houses all pivot tables that power the charts dynamically. After updating the Data Sheet, click Data → Refresh All. This tab can be hidden before sharing the dashboard with stakeholders or board members.
Nonprofit Grant Dashboard in Excel vs. Google Sheets Alternative vs. Paid Grant SaaS — Feature Comparison
| Feature | Nonprofit Grant Dashboard in Excel | Google Sheets Grant Template | Submittable / Fluxx (Paid SaaS) |
|---|---|---|---|
| Cost | $17.99 one-time ✅ | Free (basic, no pre-built charts) | $500–$2,000+ per year |
| Platform | Microsoft Excel ✅ | Google Sheets (browser only) | Cloud SaaS (requires internet) |
| Setup time | Under 10 minutes ✅ | Build from scratch (hours) | Days to weeks of configuration |
| Pre-built charts | 17 charts included ✅ | None pre-built | Custom reporting module |
| Offline access | Works offline ✅ | Browser required | Cloud only |
| Compliance tracking | Burn rate, stage, priority ✅ | Manual setup only | Built-in workflow tools |
| Customizable fields | Fully editable ✅ | Yes (manual) | Limited by plan tier |
| Year-1 cost (5 users) | $17.99 total ✅ | $0 (no charts) | $2,500–$10,000+ |
For nonprofits that need structured grant tracking with compliance reporting — without a SaaS subscription — the Nonprofit Grant Dashboard in Excel sits in the sweet spot.
Who Should Use This Template
Perfect for:
- Nonprofit grant managers and program directors tracking 5–100+ active grants
- Foundations and NGOs reporting to boards, funders, or government agencies
- Finance staff reconciling grant expenditures against awarded amounts
- Grant writers who need pipeline and compliance data before renewal season
- Small and mid-sized nonprofits transitioning from manual spreadsheet tracking
Not a fit if:
- You manage 1,000+ grants and need multi-user cloud access with full audit trails
- Your team requires applicant-facing portals or submission intake workflows
- You don’t have Microsoft Excel installed (a Google Sheets version may suit you better)
Real-World Use Cases
Maria runs grants management at a 40-person environmental nonprofit. She uses the Nonprofit Grant Dashboard in Excel to produce monthly funding summaries for her board — showing Total Awarded vs. Total Spent, Unspent Funds, and funder breakdown — in a clean, shareable format. She cut her reporting preparation time from four hours to under 30 minutes.
David is a grants officer at an international development foundation tracking 60+ active grants across multiple program areas and regions. The Program Impact page gives him beneficiary-by-region data and cost-per-beneficiary metrics that go directly into donor impact reports — without any manual chart building.
Priya manages compliance for a healthcare nonprofit receiving government grants. Her biggest risk is grants ending the year underspent or overspent. She checks the Compliance Reporting page every Monday — the Burn Rate % by Grant Manager chart immediately flags which managers are behind pace, so she can reallocate before it’s too late.
Advantages of the Nonprofit Grant Dashboard in Excel
The most significant advantage is time savings. Grant reporting that previously required manually pulling data from multiple sources and building charts from scratch can be completed in minutes using this pre-built template. The pivot-table architecture means any staff member can update data without deep Excel expertise — just paste the data and refresh.
At $17.99 as a one-time purchase with lifetime access, the Nonprofit Grant Dashboard in Excel costs less than two hours of consulting time and delivers functionality comparable to basic grant management software at a fraction of the annual cost.
Opportunities for Improvement
The Data Sheet format is fixed — if your organization tracks custom fields not included in the template, you’ll need to add columns and expand the pivot table source ranges manually. Teams with multi-currency portfolios will also need to add a currency conversion column before aggregating figures accurately. The dashboard doesn’t include automatic deadline notifications; pairing it with Excel conditional formatting or a separate grant calendar completes that workflow.
Best Practices
Keep the Data Sheet clean — avoid blank rows between records, as these can break pivot table ranges. Standardize category values (funder names, program areas, statuses) before pasting data to avoid duplicate entries in slicer lists. Use consistent date formats throughout date columns for accurate month and year trend analysis. Update data and click Refresh All at a regular weekly or monthly cadence rather than waiting until reports are due.
Explore Relevant Templates
Looking for more Excel Dashboard Templates? These related picks complement the Nonprofit Grant Dashboard:
🔹 Corporate Sponsorship Request Tracker in Excel — Track sponsorship proposals, approvals, and disbursements across corporate funders alongside your grants.
🔹 Investment Banking KPI Dashboard in Excel — Financial KPI tracking for organizations managing complex fund structures.
🔹 Vocational Training KPI Scorecard in Excel — Ideal for nonprofits running workforce development and training programs funded by grants.
Frequently Asked Questions
What KPIs does the Nonprofit Grant Dashboard in Excel track?
The Nonprofit Grant Dashboard in Excel tracks 5 key performance indicators: Total Awarded, Total Records, Total Beneficiaries, Total Spent, and Unspent Funds Amount. All five KPI cards update automatically when you refresh the pivot tables after updating the Data Sheet.
How many charts does this Excel grant dashboard include?
The dashboard includes 17 pre-built charts across 5 analysis pages covering funder distribution, program area performance, beneficiary segmentation, compliance burn rates, and year-over-year pipeline trends. Every chart is pivot-powered and updates instantly on Data Refresh.
How long does setup take?
Setup takes under 10 minutes. Open the file in Excel, paste your grant records into the Data Sheet following the existing column format, then click Data → Refresh All. Every chart, KPI card, and analysis view updates instantly — no formula editing required.
Does this work with Microsoft Excel on Mac?
Yes. The Nonprofit Grant Dashboard in Excel works with Microsoft Excel 2016 and later, including Excel for Mac. Pivot tables, slicers, and all standard chart types are fully supported on both Windows and Mac. No add-ins are required.
How does this compare to Submittable or Fluxx for grant management?
Submittable and Fluxx are cloud SaaS platforms typically costing $500–$2,000+ per year, built primarily for applicant intake and grantee portals. The Nonprofit Grant Dashboard in Excel focuses on internal tracking and compliance reporting at a one-time cost of $17.99 — no subscriptions, no per-user fees.
Can I customize the template for my organization’s specific grant categories?
Yes. Add columns to the Data Sheet for any custom fields your organization tracks, then expand the pivot table source ranges in the Support Sheet to include the new columns. You can also rename slicer labels and chart titles to match your organization’s terminology.
Is there a video tutorial available for this dashboard?
Yes. The @PK-AnExcelExpert and @NextGenTemplates YouTube channels cover Excel dashboard templates including pivot table techniques, slicer setup, and data refresh workflows. Visit YouTube.com/@PK-AnExcelExpert for tutorials.
About the Author
Built by PK — Microsoft Certified Professional with 15+ years of Excel, Google Sheets, and Power BI experience. Founder of NextGenTemplates, reaching 300K+ subscribers across YouTube channels. Every template is hand-built and tested before release.
Conclusion
The Nonprofit Grant Dashboard in Excel brings structure, visibility, and compliance tracking to grant management — without the cost or complexity of dedicated SaaS tools. Whether you’re reporting to a foundation board, preparing for a government audit, or planning your next funding cycle, this template gives you the data you need in the format stakeholders expect.
👉 Click here to Purchase the Nonprofit Grant Dashboard in Excel
✅ Instant download · One-time payment · No subscription
👉 Youtube.com/@PK-AnExcelExpert
📅 Last updated: May 2026