Impact Investment Funds Dashboard in Power BI helps fund managers, ESG analysts, sustainable finance teams, investor reporting leads, and portfolio operations teams review capital flow, portfolio value, returns, and measurable impact in one interactive report. Impact investing teams often track committed capital, fair value, realized value, beneficiaries reached, jobs supported, investor type, sector, risk rating, status, region, fund manager, investment stage, and impact theme across separate files. That slows reporting and makes it harder to answer investment committee questions with confidence.
This ready-to-use Power BI dashboard brings those data points into 5 report pages: Overview, Capital Flow, Impact, Returns, and Portfolio. You can open the PBIX file in Power BI Desktop, replace or connect the source data, refresh the model, and use slicers to explore the report quickly. For official setup help, see Microsoft Learn on getting started with Power BI Desktop.
View the Impact Investment Funds Dashboard in Power BI on NextGenTemplates.
Impact Investment Funds Dashboard in Power BI
Key Features of Impact Investment Funds Dashboard in Power BI
- 5 interactive pages: Overview, Capital Flow, Impact, Returns, and Portfolio.
- Executive KPI cards: Total Realized Value, Total Portfolio Companies, Total Fair Value, and Total Jobs Supported.
- Capital flow analysis: Review committed capital by investor type, beneficiaries by impact theme, deployment rate by fund manager, and fair value by month.
- Impact reporting: Analyze realized value, jobs supported, portfolio companies, and fund manager contribution.
- Returns analysis: Compare fair value by risk rating, status, investment stage, and portfolio companies by manager.
- Portfolio visibility: Track jobs supported, risk mix, deployment rate by investment stage, and funds count by investor type.
- Power BI-native design: Customize visuals, fields, slicers, measures, and data connections in Power BI Desktop.
Dashboard Pages Explanation
1. Overview Page
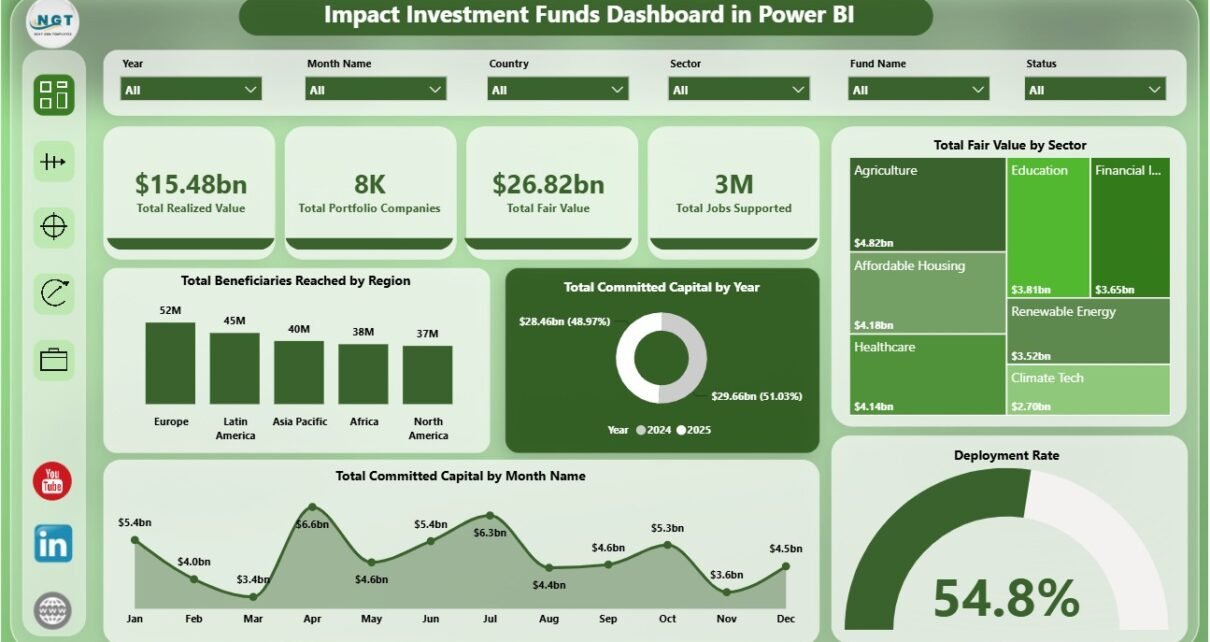
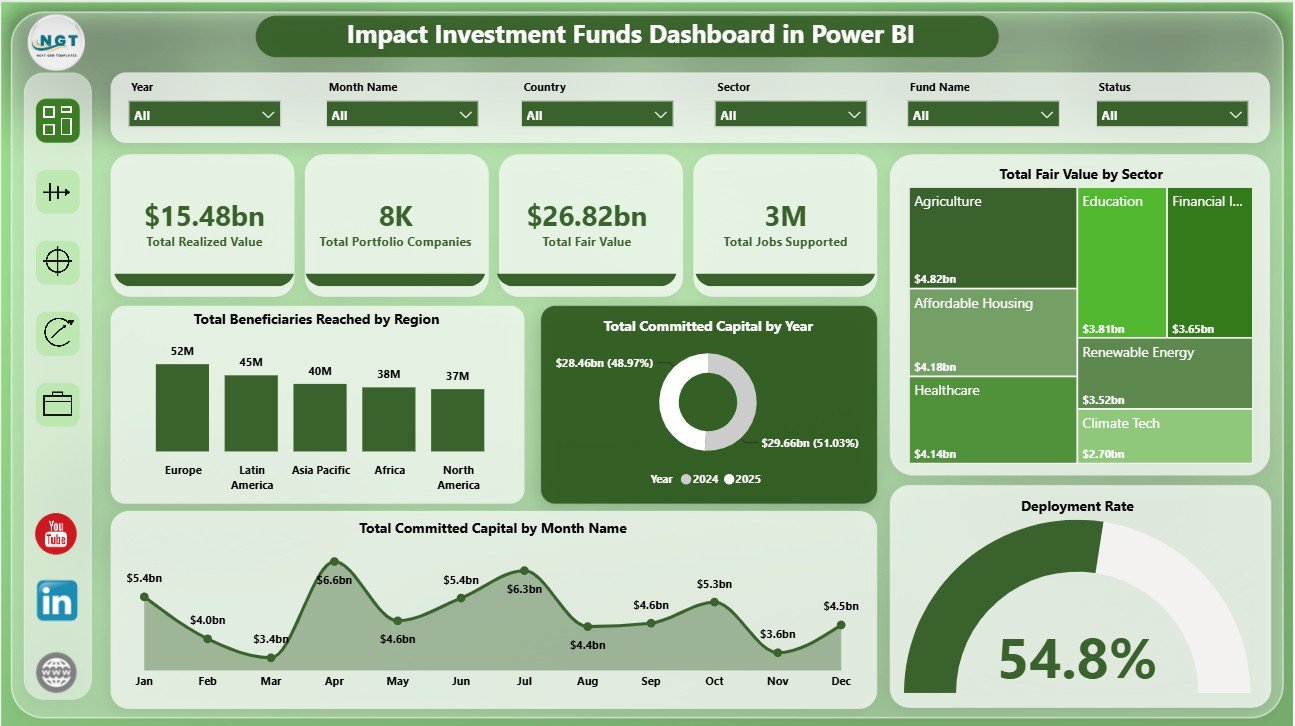
The Overview page works as the executive summary. The top KPI cards show Total Realized Value, Total Portfolio Companies, Total Fair Value, and Total Jobs Supported, giving leadership a fast view of value creation, portfolio breadth, and employment impact.
Total Beneficiaries Reached by Region compares beneficiary reach across regions and shows where the portfolio is creating the largest social footprint. This is helpful for regional reporting, investor updates, and allocation reviews.
Total Committed Capital by Year shows annual capital commitment trends and helps users identify whether fundraising or allocation activity is increasing over time. Total Fair Value by Sector highlights where current portfolio value is concentrated. Total Committed Capital by Month Name reveals monthly commitment patterns. Deployment Rate by Overall Portfolio helps investment teams review how effectively capital is being deployed.
Overview Page
2. Capital Flow
The Capital Flow page focuses on how committed capital, fair value, deployment, and beneficiary reach move through the portfolio. Total Committed Capital by Investor Type shows which investor groups contribute the most capital. Total Beneficiaries Reached by Impact Theme links financial activity with social priorities.
Deployment Rate by Fund Manager compares manager-level execution and helps identify teams that are moving capital faster. Total Fair Value by Month Name shows monthly value movement and can support trend discussions during review meetings.
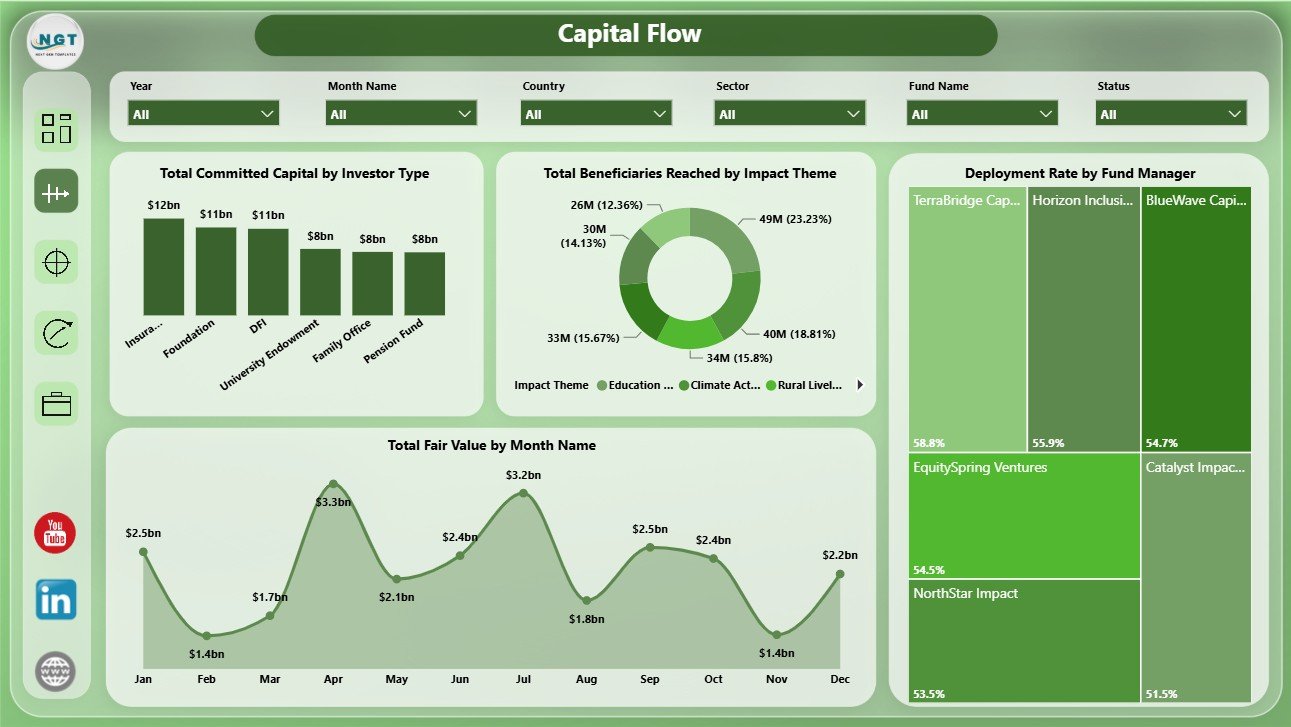
Capital Flow
3. Impact
The Impact page connects financial outcomes with social and portfolio outcomes. Total Realized Value by Impact Theme shows which themes are producing realized value, while Total Jobs Supported by Region compares employment impact by geography.
Total Portfolio Companies by Sector shows sector-level portfolio coverage, which helps users understand concentration and diversification. Total Realized Value by Fund Manager compares manager contribution and supports manager-level performance review.
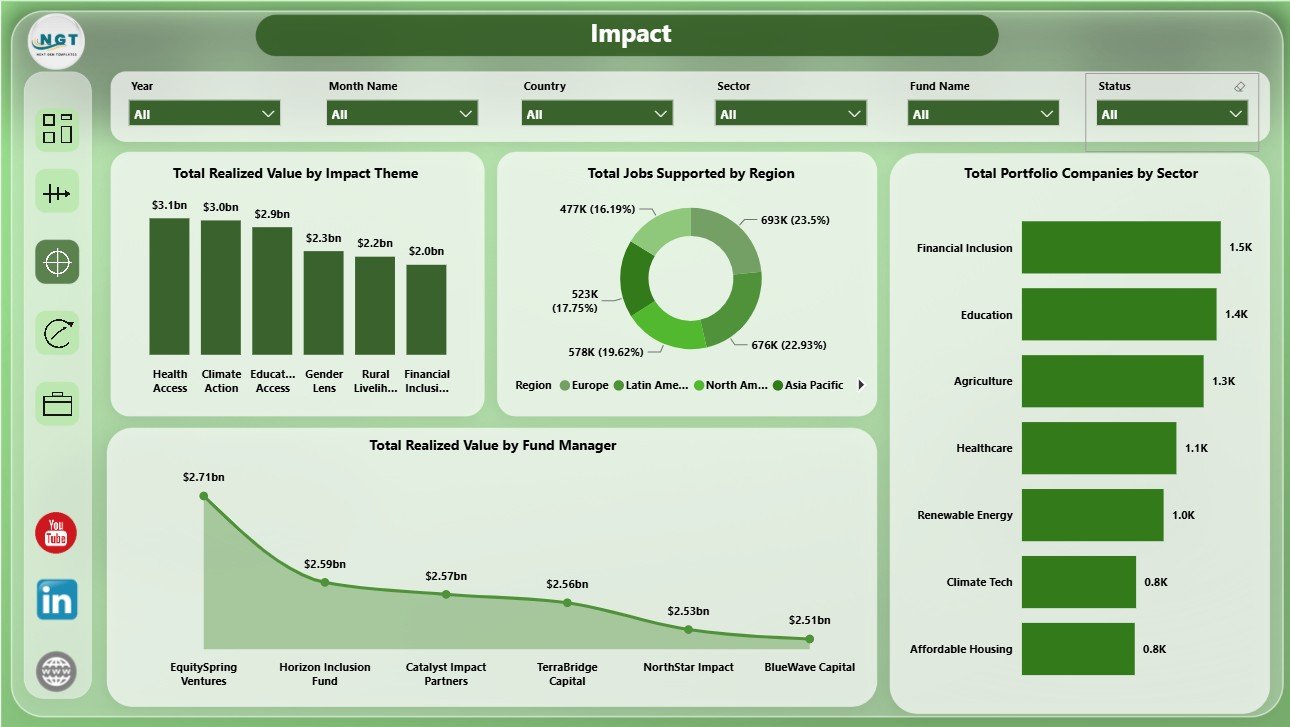
Impact
4. Returns
The Returns page helps investment teams review risk, status, stage, and manager-level exposure. Total Fair Value by Risk Rating highlights how value is distributed across risk levels. Total Committed Capital by Status shows where capital sits across portfolio statuses.
Total Fair Value by Investment Stage compares stage-level value and helps users assess maturity across the portfolio. Total Portfolio Companies by Fund Manager shows manager coverage and can reveal concentration in portfolio oversight.
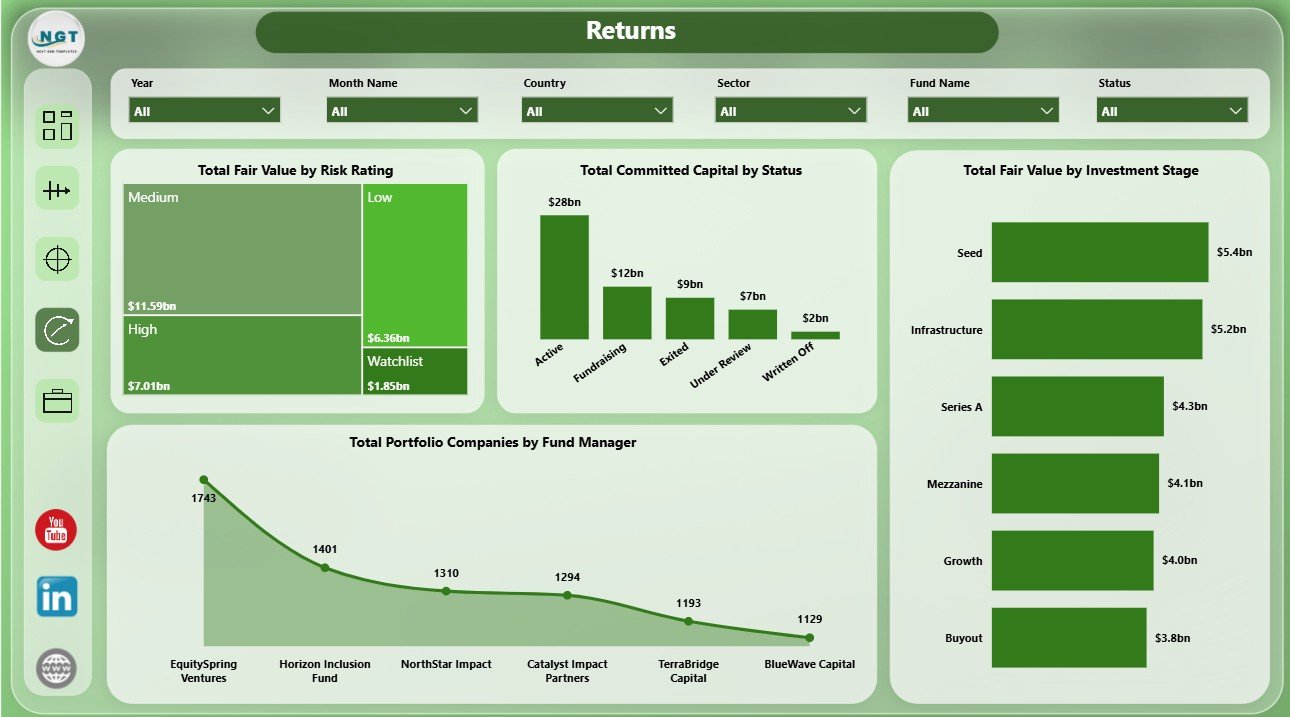
Returns
5. Portfolio
The Portfolio page gives a concise view of portfolio scale, risk, and deployment. Total Jobs Supported by Region shows employment impact by geography, while Total Portfolio Companies by Risk Rating helps users review the portfolio risk mix.
Deployment Rate by Investment Stage compares how capital is used across investment stages. Funds Count by Investor Type shows the investor-type mix and helps users understand the funding base behind the portfolio.
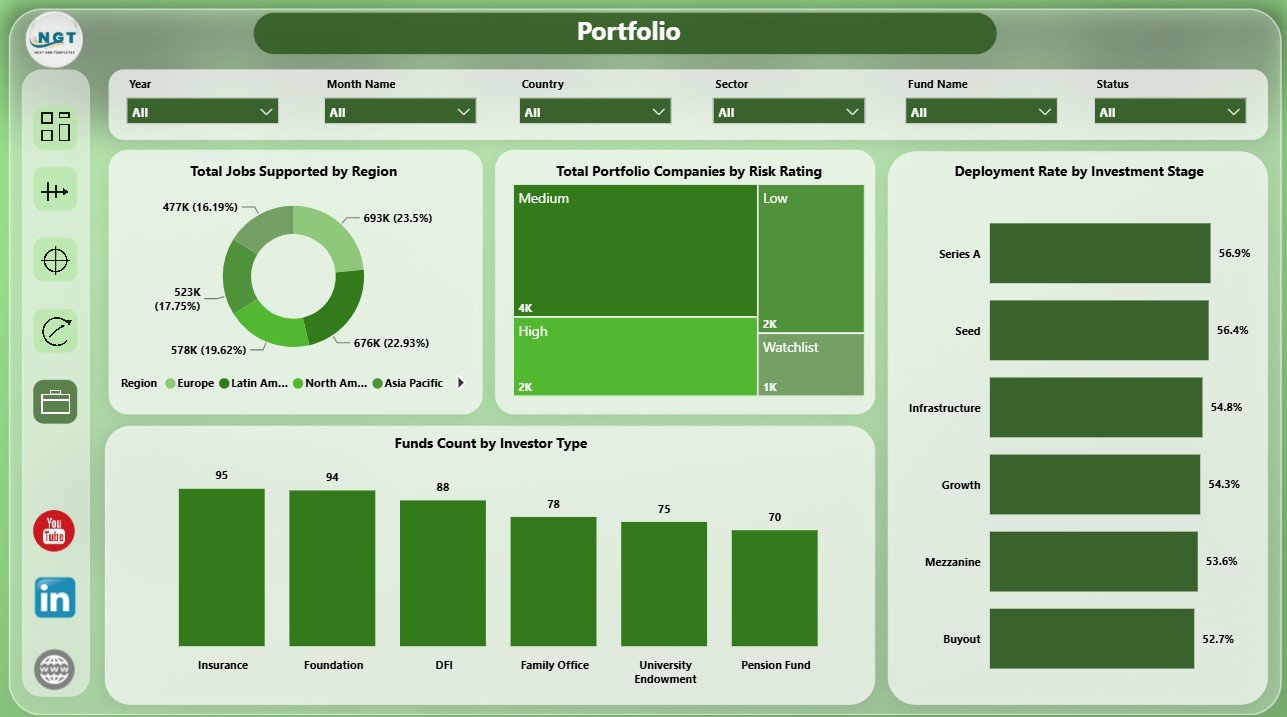
Portfolio
Impact Investment Funds Dashboard in Power BI vs. Tableau vs. Paid CRM/SaaS – Feature Comparison
| Feature | Impact Investment Funds Dashboard in Power BI | Tableau or Qlik Alternative | Paid Fund SaaS |
|---|---|---|---|
| Cost | $17.99 one-time template | License cost plus dashboard build time | Monthly or annual subscription |
| Platform | Power BI Desktop and Power BI Service | Tableau or Qlik environment | Vendor cloud platform |
| Setup time | Open PBIX, connect data, refresh | Build data model and visuals manually | Implementation and onboarding |
| Real-time team collaboration | Available through Power BI Service | Available by plan | Usually included by plan |
| Mobile access | Power BI mobile app | Vendor mobile app | Vendor mobile app |
| Customizable fields | Edit model, visuals, pages, and slicers | Editable with platform skills | Depends on vendor permissions |
| Share with link | Available through Power BI Service | Available by platform settings | Usually login controlled |
| Year-1 cost at 5 users | Template cost plus Power BI licensing if sharing online | License cost plus analyst time | Often hundreds or thousands |
| Impact fund metrics | Built around fair value, realized value, beneficiaries, jobs, risk, sector, stage, and capital | Must be designed manually | Depends on product module |
Who Should Use This Template
This dashboard is a strong fit for impact investment funds, ESG investment firms, sustainable finance teams, development finance institutions, portfolio analysts, investor reporting teams, fund managers, and consultants who need a practical Power BI report for portfolio and impact review.
It is not a replacement for fund accounting software, investor portals, impact verification systems, regulatory filing tools, or automated data warehouses. It works best when you already have prepared fund data and need a clear reporting layer.
Real-World Use Cases
Aisha is an impact fund manager. She uses the Overview and Capital Flow pages before investment committee meetings to review realized value, fair value, deployment rate, and investor-type contribution.
Daniel is an impact measurement analyst. He uses the Impact and Portfolio pages to explain beneficiaries reached, jobs supported, sectors, regions, and risk rating mix in quarterly reports.
Priya handles portfolio operations. She reviews the Returns page to compare risk rating, status, investment stage, and manager-level portfolio company count before investor calls.
Advantages of Impact Investment Funds Dashboard in Power BI
- Faster reporting: Start from a ready dashboard instead of designing a report from a blank canvas.
- Power BI flexibility: Edit visuals, model fields, slicers, measures, and page layouts as needed.
- Impact and finance together: Review realized value, fair value, beneficiaries, jobs, capital, and portfolio structure in one report.
- Meeting-ready pages: Use pages for investment committees, investor updates, ESG reviews, and portfolio operations meetings.
- No recurring template subscription: The template is a one-time downloadable product from NextGenTemplates.
Opportunities for Improvement
- Automated data refresh: Teams with live databases can connect the PBIX to cloud data sources and schedule refresh in Power BI Service.
- Additional drill-through pages: Larger funds may add company-level, country-level, or investor-level drill-through pages.
- Custom DAX measures: Advanced users can add IRR, MOIC, TVPI, DPI, or custom impact scoring measures if those fields exist in their data.
- Role-level security: Organizations sharing online can configure security rules in Power BI Service for sensitive views.
Best Practices
- Keep naming consistent: Use consistent names for regions, sectors, impact themes, risk ratings, statuses, and fund managers.
- Validate source data first: Check missing values, duplicates, and date fields before refreshing the report.
- Document definitions: Define fair value, realized value, deployment rate, and beneficiaries reached so users interpret results consistently.
- Refresh before meetings: Always refresh the PBIX after updating the source data.
- Keep a backup: Save a clean original copy before changing model relationships, visuals, or measures.
Explore Relevant Templates
If this Power BI dashboard is useful, you may also like these related templates from NextGenTemplates:
- Impact Investment Funds Dashboard in Excel for users who prefer Excel-based reporting.
- Startup Burn Rate Dashboard in Power BI for finance and runway analysis.
- Geothermal Energy Dashboard in Power BI for renewable energy reporting.
- Browse more Power BI Dashboard templates.
Frequently Asked Questions
What is the Impact Investment Funds Dashboard in Power BI?
It is a downloadable PBIX dashboard template for tracking impact fund capital, fair value, realized value, beneficiaries, jobs supported, risk rating, sector, investment stage, investor type, and fund manager performance.
What pages are included?
The dashboard includes Overview, Capital Flow, Impact, Returns, and Portfolio pages.
Do I need Power BI Desktop?
Yes. Open the PBIX file in Power BI Desktop, replace or connect your data source, and refresh the report.
Can I customize the visuals and slicers?
Yes. You can customize visuals, pages, fields, model relationships, slicers, colors, and measures in Power BI Desktop.
Is this a subscription?
No. It is a one-time downloadable template from NextGenTemplates.
Can this be used for ESG reporting?
Yes. It can support ESG, sustainable finance, and impact investing reviews when your data contains the required value, sector, region, impact theme, and portfolio fields.
About the Author
Built by PK – Microsoft Certified Professional with 15+ years of Excel, Google Sheets, and Power BI experience. Founder of NextGenTemplates, reaching 300K+ subscribers across YouTube channels. Every template is hand-built and tested before release.
Conclusion
The Impact Investment Funds Dashboard in Power BI gives impact investment teams a practical way to combine financial value, capital flow, portfolio structure, and social outcome metrics in one interactive report. Instead of rebuilding visuals from scratch, you can start with a ready PBIX structure and adapt it to your fund data.
Click here to view the Impact Investment Funds Dashboard in Power BI.
Visit our YouTube channel for step-by-step tutorials: Youtube.com/@PK-AnExcelExpert