Impact Investment Funds Dashboard in Excel helps fund managers, sustainable finance teams, impact analysts, portfolio operations leads, and investor reporting teams turn fund records into a clean Excel dashboard. Impact investing teams often track committed capital, deployment, fair value, carbon avoided, beneficiaries reached, jobs supported, risk rating, investor type, fund manager, country, region, sector, and impact theme in separate spreadsheets. That makes monthly reporting slow and increases the chance that an investment committee sees outdated numbers.
This ready-to-use Excel dashboard brings those metrics into one pivot-driven workbook with KPI cards, slicers, charts, a Data Sheet, and a Support Sheet. You can replace the sample records, keep the same format, click Data > Refresh All, and review updated pages in minutes. For official help on the Excel features behind this workflow, see Microsoft Support on creating PivotTables and using slicers in Excel.
View the Impact Investment Funds Dashboard in Excel on NextGenTemplates.
Impact Investment Funds Dashboard in Excel
Key Features of Impact Investment Funds Dashboard in Excel
- 5 dashboard pages: Overview, Capital Flow, Impact, Returns, and Portfolio.
- Executive KPI cards: Total Funds, Deployment Rate %, Total Carbon Avoided, Total Portfolio, and Total Jobs Supported.
- Capital tracking: Review committed capital by month and year, fair value by month, and committed capital by investor type.
- Impact reporting: Analyze carbon avoided, beneficiaries reached, jobs supported, and impact theme performance.
- Return review: Compare fair value by investment stage, realized value by status, return multiple by vintage, and due diligence score by risk rating.
- Portfolio visibility: Review deployment rate by investment stage, total funds by investor type, and committed capital by status.
- Refreshable design: Update the Data Sheet, click Refresh All, and let Support Sheet pivots refresh the dashboard.
Dashboard Pages Explanation
1. Overview Page
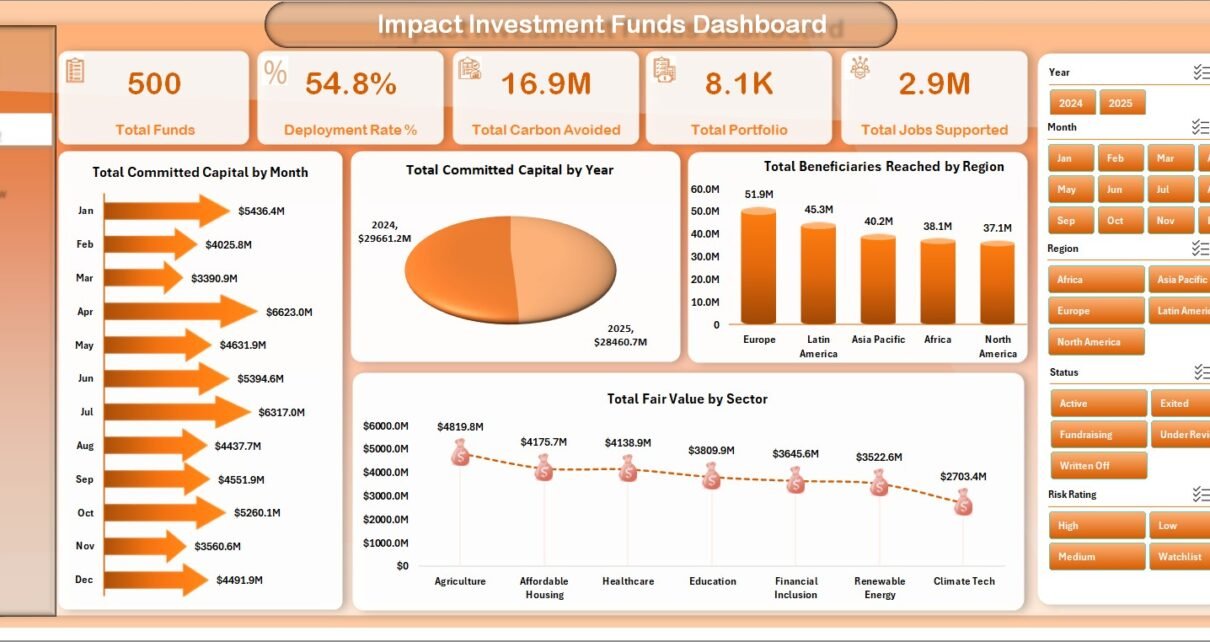
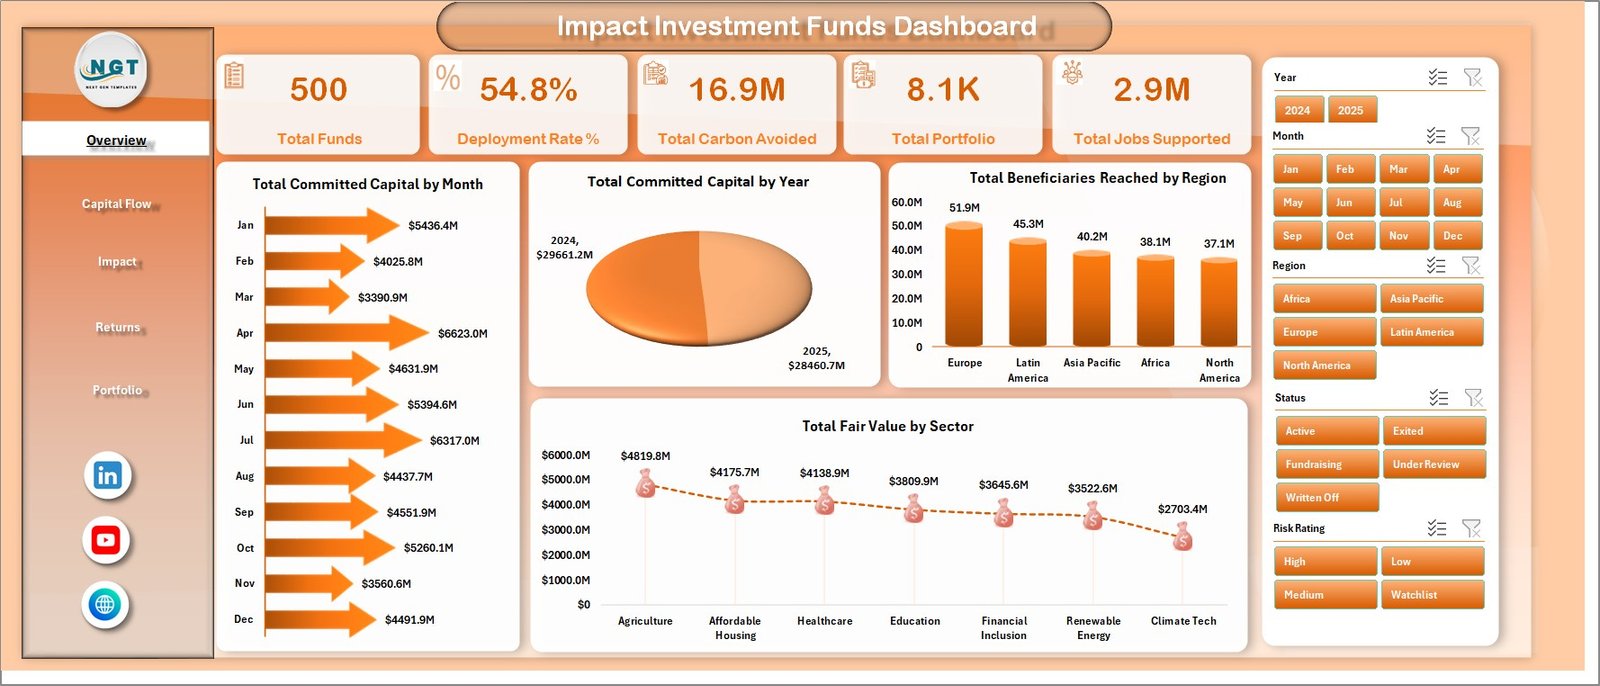
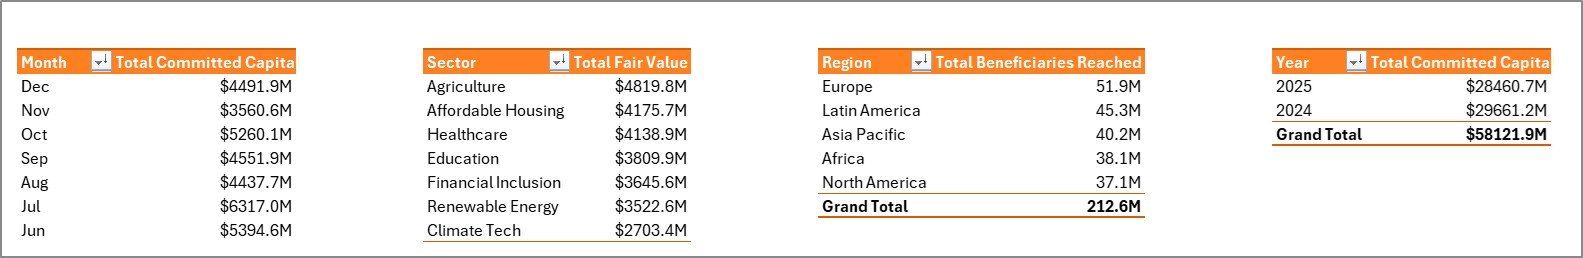
The Overview page works as the executive summary. The top cards show Total Funds, Deployment Rate %, Total Carbon Avoided, Total Portfolio, and Total Jobs Supported, giving leadership a fast view of financial scale and impact delivery.
Total Committed Capital by Month shows month-wise capital commitment movement and helps identify peaks in fundraising or allocation activity. Total Committed Capital by Year provides the annual trend for longer-term portfolio review. Total Beneficiaries Reached by Region highlights where the fund is creating the most direct social reach. Total Fair Value by Sector shows which sectors currently hold the most portfolio value.
Overview Page
2. Capital Flow
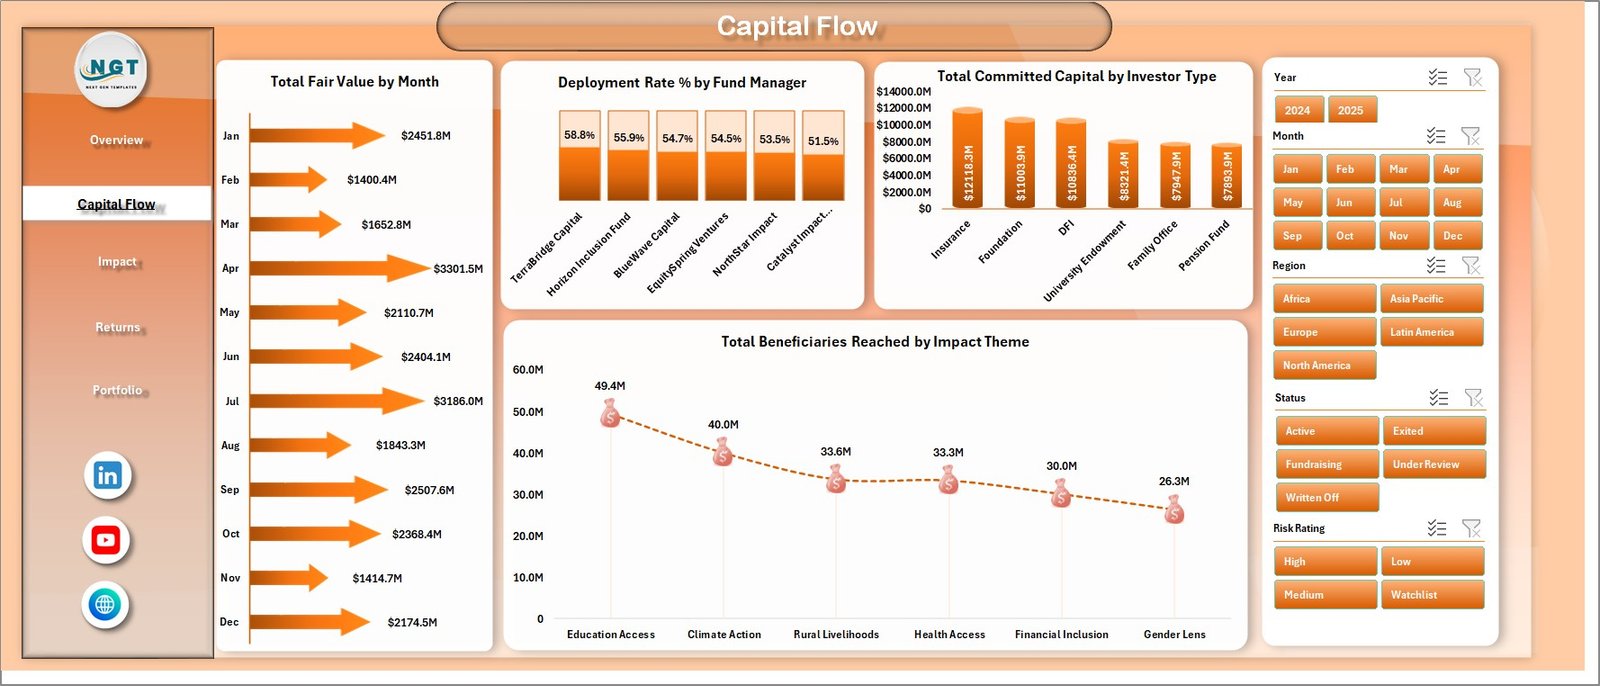
The Capital Flow page focuses on the movement of money and reach. It includes Total Fair Value by Month, Deployment Rate % by Fund Manager, Total Committed Capital by Investor Type, and Total Beneficiaries Reached by Impact Theme.
This page helps portfolio operations teams see whether capital is being deployed efficiently, which investor types are contributing the most committed capital, and which impact themes are reaching more beneficiaries.
Capital Flow
3. Impact
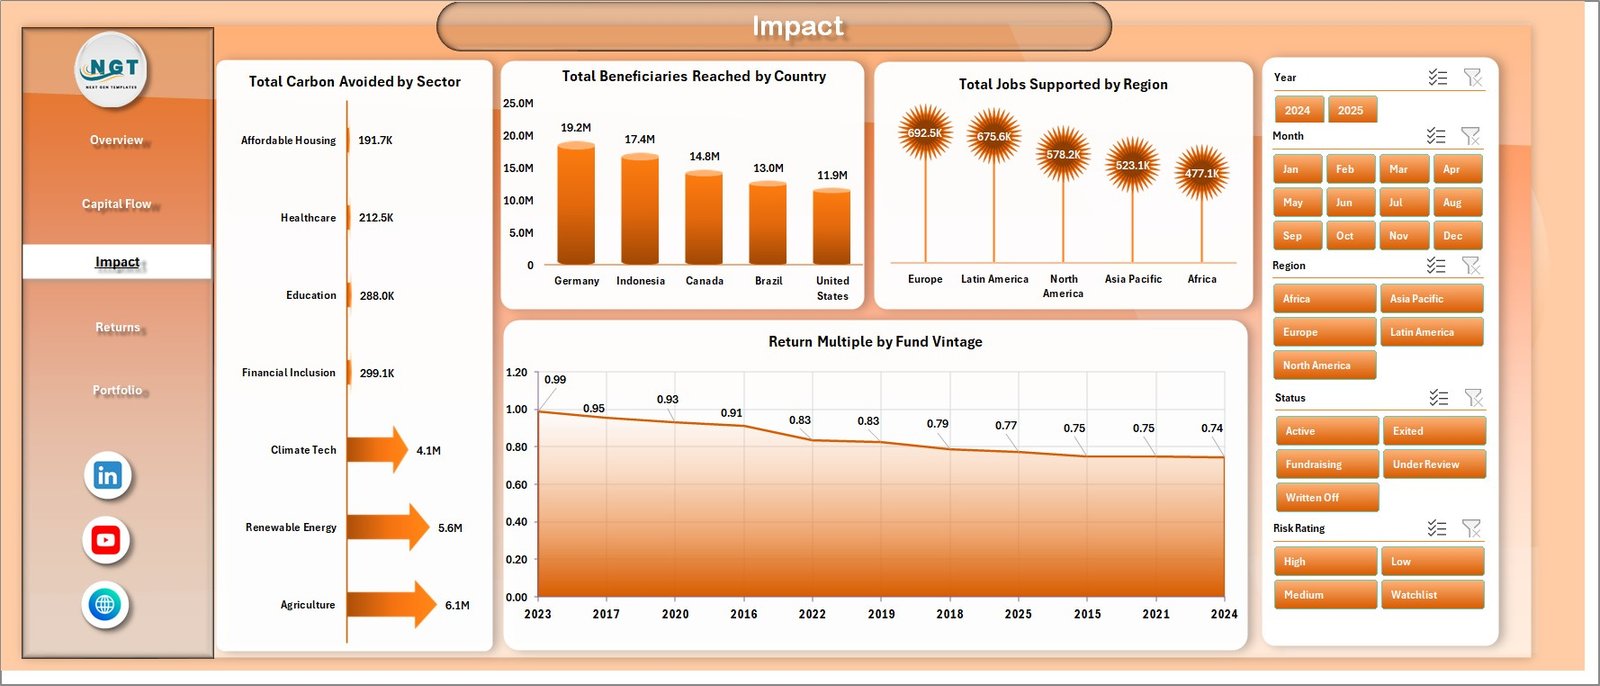
The Impact page is built for social and environmental outcome reporting. It includes Total Carbon Avoided by Sector, Total Beneficiaries Reached by Country, Total Jobs Supported by Region, and Return Multiple by Fund Vintage.
This view is useful when a fund needs to explain carbon outcomes, country-level reach, job creation, and return multiple patterns in one place. It supports ESG reviews, investor updates, and impact committee discussions.
Impact
4. Returns
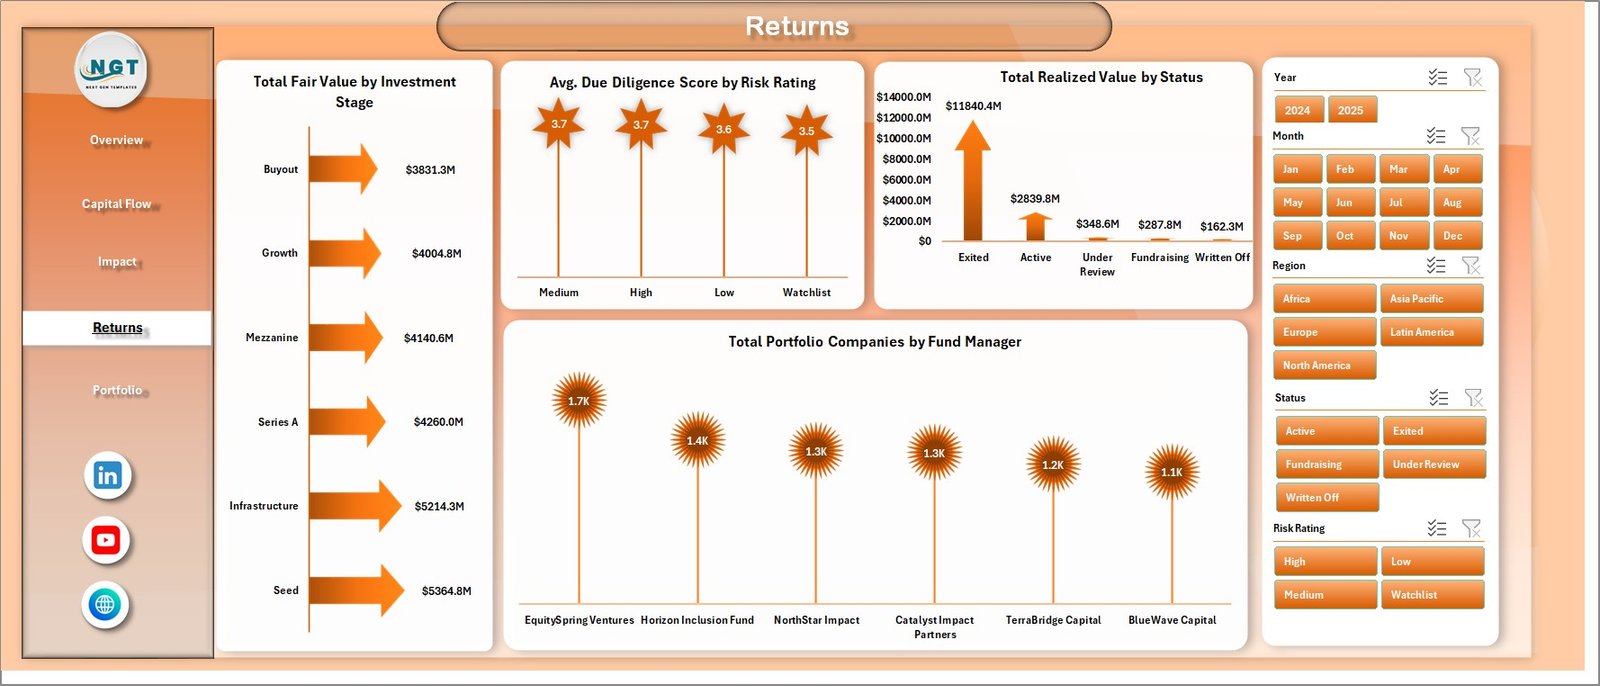
The Returns page combines portfolio value, realized value, due diligence quality, and manager-level portfolio count. It includes Total Fair Value by Investment Stage, Avg. Due Diligence Score by Risk Rating, Total Realized Value by Status, and Total Portfolio Companies by Fund Manager.
This sheet helps investment committees compare risk rating, stage distribution, realized value status, and manager-level portfolio exposure before making follow-up decisions.
Returns
5. Portfolio
The Portfolio page gives a concise allocation and status view. It includes Deployment Rate % by Investment Stage, Total Funds by Investor Type, and Total Committed Capital by Status.
Use this page to review where deployment is strongest, how funds are distributed by investor type, and how committed capital is split across statuses.
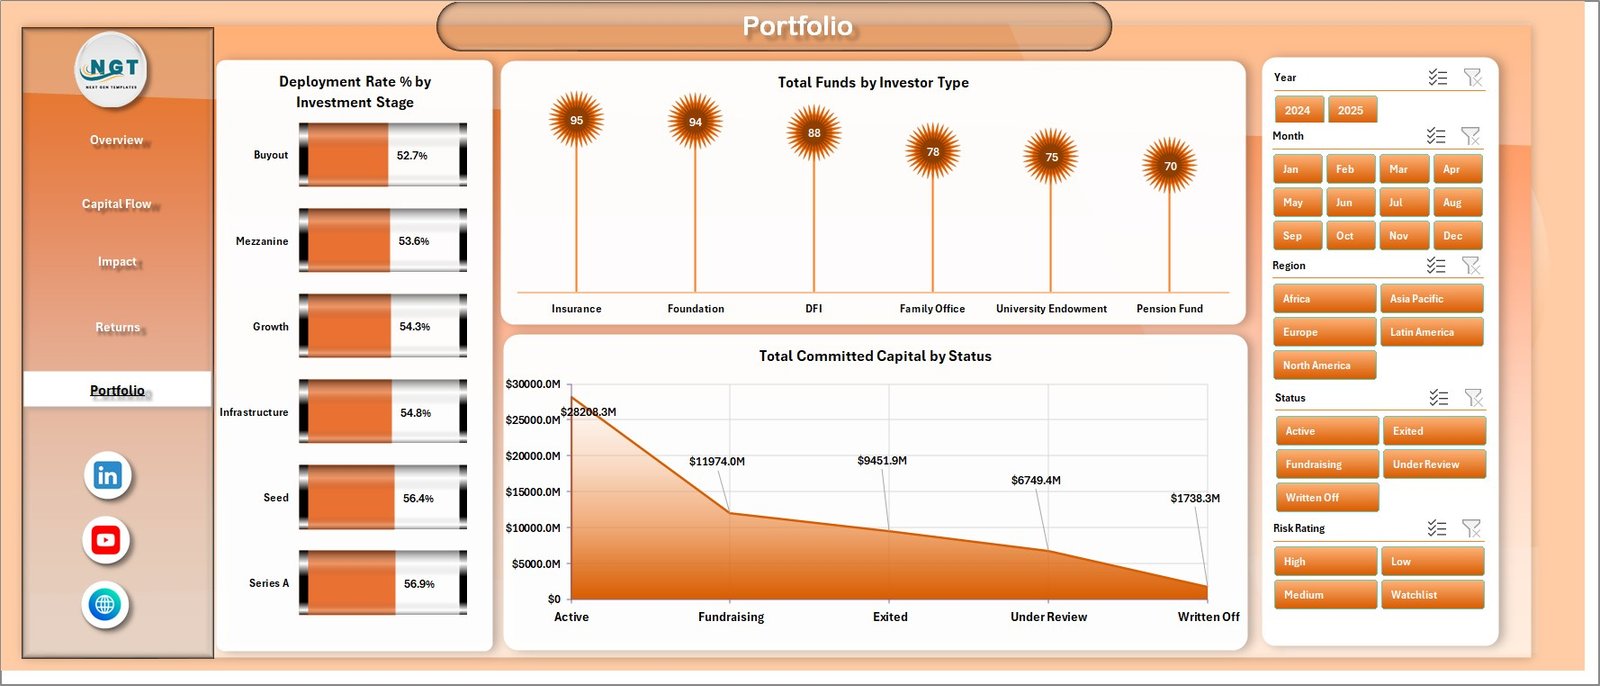
Portfolio
6. Data Sheet Tab
The Data Sheet is the input table. Add your impact investment fund records in the same format as the sample data. Keeping the headers and column order consistent allows all connected pivot tables, slicers, cards, and charts to refresh correctly.

Data Sheet tab
7. Support Sheet Tab
The Support Sheet contains the pivot tables used to create the dashboard dynamically. After updating the Data Sheet, go to the Data tab in the Excel Ribbon and click Refresh All. All pivots and charts refresh together. You can keep this sheet hidden while sharing the workbook with dashboard users.
Support sheet tab
Impact Investment Funds Dashboard in Excel vs. Google Sheets vs. Paid CRM/SaaS – Feature Comparison
| Feature | Impact Investment Funds Dashboard in Excel | Google Sheets Alternative | Paid Fund or Impact SaaS |
|---|---|---|---|
| Cost | $17.99 one-time | Low tool cost but manual setup | Monthly or annual subscription |
| Platform | Microsoft Excel | Google Sheets | Vendor cloud platform |
| Setup time | Replace data and refresh | Build formulas, pivots, and charts manually | Implementation and onboarding |
| Real-time collaboration | Available through OneDrive or SharePoint | Native collaboration | Usually included by plan |
| Mobile access | Excel mobile app | Google Sheets app | Vendor app |
| Customizable fields | Editable workbook, pivots, charts, and slicers | Editable but manual | Depends on vendor permissions |
| Share with link | Available through Microsoft 365 | Native sharing | Usually login controlled |
| Year-1 cost at 5 users | $17.99 plus Microsoft licensing if needed | Low license cost plus analyst time | Often hundreds or thousands |
| Impact fund analytics | Built into 5 pages plus Data and Support tabs | Must be built manually | Depends on module |
Who Should Use This Template
This template is a strong fit for impact investment funds, ESG investment firms, development finance institutions, sustainable finance teams, grant-backed funds, portfolio analysts, fund managers, investor reporting teams, and consultants that need structured Excel reporting for capital, returns, and impact outcomes.
It is not a replacement for fund accounting software, investor portals, impact verification tools, live API data warehouses, or regulatory filing systems. It works best when you already have clean source data and need a fast reporting layer.
Real-World Use Cases
Aisha is an impact fund manager. She uses the Overview and Capital Flow pages before the monthly investment committee meeting to review deployment rate, fair value, investor type, and committed capital trends.
Daniel is an impact measurement analyst. He uses the Impact page to explain carbon avoided by sector, beneficiaries reached by country, jobs supported by region, and return multiple by vintage.
Priya handles portfolio operations. She reviews the Returns and Portfolio pages before investor updates to check due diligence score, risk rating, realized value status, investment stage, and fund manager exposure.
Advantages of Impact Investment Funds Dashboard in Excel
- Faster reporting: Replace sample data and refresh instead of rebuilding charts from scratch.
- Excel-native control: Edit fields, slicers, pivots, pages, colors, and formulas as needed.
- Impact and finance together: Review capital, fair value, carbon, beneficiaries, jobs, and returns in one workbook.
- No recurring template subscription: It is a one-time downloadable product from NextGenTemplates.
- Presentation-ready pages: Use dashboard pages for internal meetings, investor updates, or board review packs.
Opportunities for Improvement
The dashboard depends on clean, consistent source data. If sector names, country names, investor types, impact themes, statuses, or fund manager names are typed inconsistently, pivot tables may split similar records into multiple groups. Standardizing lookup values before refresh will improve reporting quality.
The workbook is also not a live integration system. Teams that need automated feeds from fund accounting, CRM, ESG scoring, carbon verification, or portfolio management platforms may need Power BI, a database connection, or a custom automation layer.
Best Practices
- Keep the Data Sheet headers unchanged when replacing sample records.
- Standardize country, region, sector, status, investor type, impact theme, and fund manager names.
- Refresh all pivots after every data update.
- Save a backup before changing pivot layouts or source fields.
- Hide the Support Sheet before sharing the workbook with non-technical users.
- Use slicers to create focused views for investor, sector, region, country, or theme-level conversations.
Explore Relevant Templates
You can download the Impact Investment Funds Dashboard in Excel from NextGenTemplates. You may also like the ESG Investment Firms Dashboard in Excel, Hedge Fund Administration Dashboard in Excel, Sovereign Wealth Funds KPI Dashboard in Excel, and VC Portfolio Dashboard in Power BI.
Frequently Asked Questions
What is the Impact Investment Funds Dashboard in Excel?
It is a ready-to-use Excel dashboard for tracking impact fund capital, deployment, carbon avoided, beneficiaries reached, jobs supported, fair value, realized value, returns, portfolio companies, and related dimensions.
What pages are included?
The workbook includes Overview, Capital Flow, Impact, Returns, Portfolio, Data Sheet, and Support Sheet tabs.
How do I update the dashboard?
Replace the sample records in the Data Sheet, keep the same format, then click Data > Refresh All in the Excel Ribbon.
Can I hide the Support Sheet?
Yes. The Support Sheet contains pivot tables used by the dashboard and can be hidden after setup.
Can I customize the charts and slicers?
Yes. The workbook is editable, so you can change chart titles, colors, slicers, pivot fields, and page layouts.
Is this a subscription?
No. It is a one-time downloadable Excel template from NextGenTemplates.
About the Author
Built by PK – Microsoft Certified Professional with 15+ years of Excel, Google Sheets, and Power BI experience. Founder of NextGenTemplates, reaching 300K+ subscribers across YouTube channels. Every template is hand-built and tested before release.
Conclusion
The Impact Investment Funds Dashboard in Excel gives fund managers and impact analysts a practical way to review committed capital, deployment rate, carbon avoided, beneficiaries, jobs supported, fair value, realized value, portfolio companies, and returns in one workbook. If your team already manages impact fund records in Excel, this template can turn those records into a cleaner monthly reporting workflow with less manual chart-building.
Visit our YouTube channel for Excel dashboard tutorials: Youtube.com/@PKAnExcelExpert.
Last updated: June 22, 2026