Indoor Farming Systems Dashboard in Excel helps indoor farm owners, vertical farming teams, greenhouse operators, crop managers, quality reviewers, and operations analysts review revenue, labor cost, harvest weight, quality score, Grade A yield, completion percentage, downtime, crop types, growing systems, farm sites, zones, regions, technicians, and statuses in one editable workbook. Indoor farming teams often manage 100+ crop and batch records across multiple sites and zones, but manual reporting can make it difficult to answer basic questions quickly: Which crop type has the best Grade A yield? Which site has the highest labor and energy cost? Which technician has the most downtime? This dashboard turns that raw Excel data into clear pages, KPI cards, slicers, charts, and refreshable pivot-based reporting.
The workbook includes 5 dashboard pages plus a Data Sheet and Support Sheet. Users can replace the sample records, keep the same structure, and refresh the dashboard from the Excel Data ribbon. Microsoft explains this workflow in its guide to refreshing PivotTable data in Excel. You can view the product here: Indoor Farming Systems Dashboard in Excel.
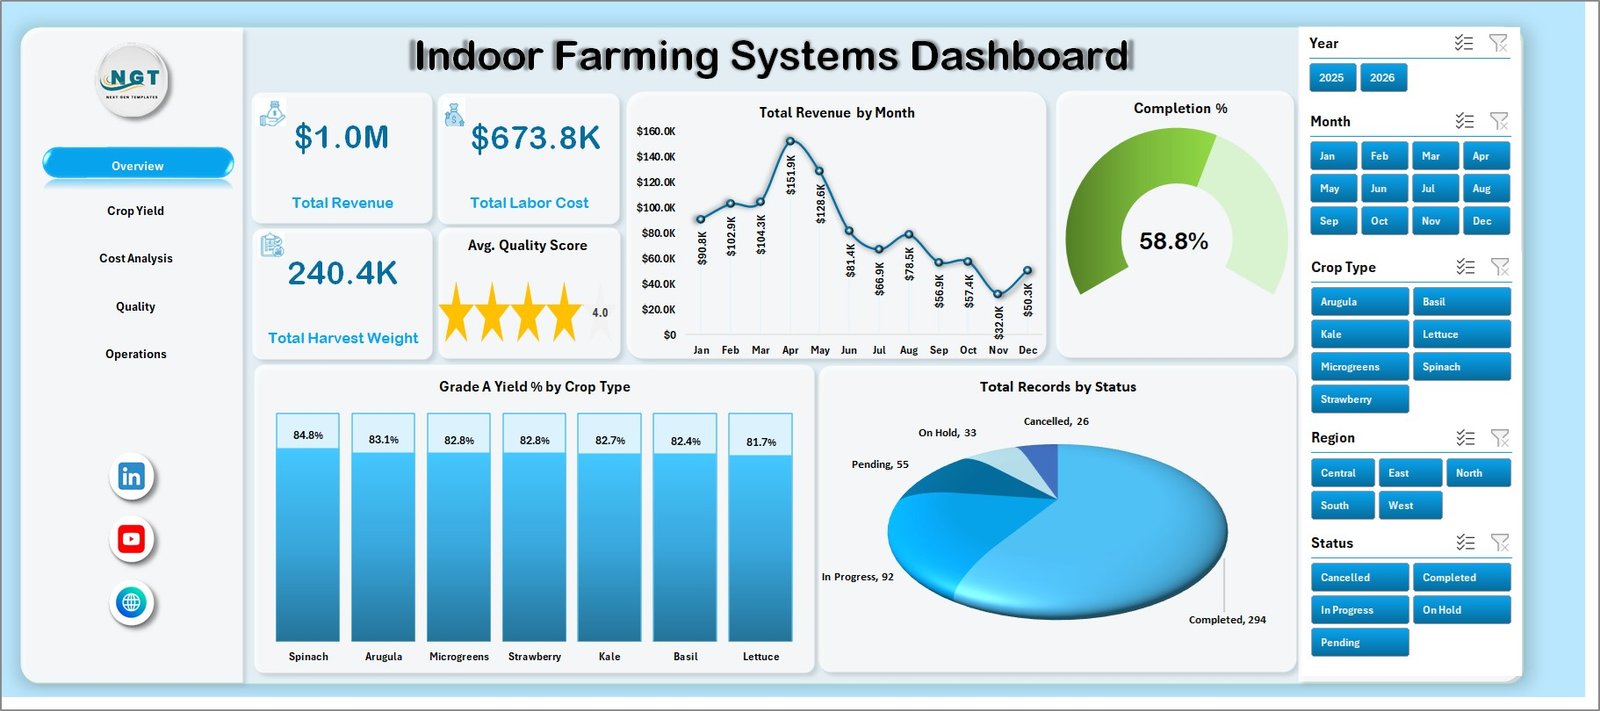
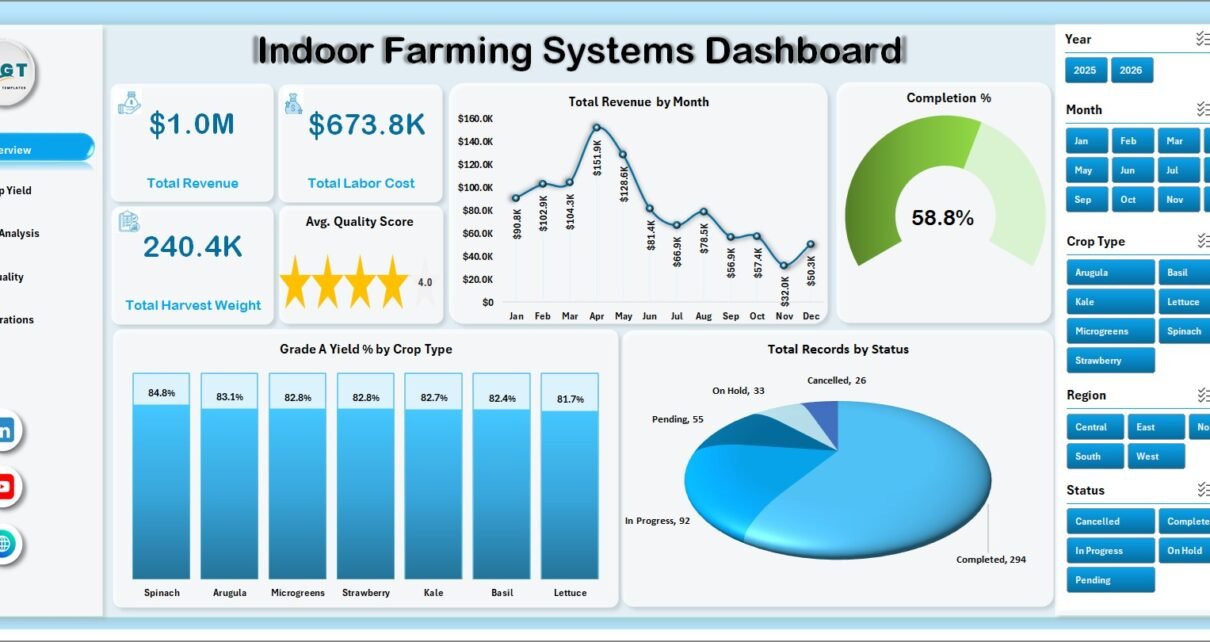
Indoor Farming Systems Dashboard in Excel
Key Features of Indoor Farming Systems Dashboard in Excel
- 5 dashboard pages: Overview, Crop Yield, Cost Analysis, Quality, and Operations.
- 4 KPI cards: Total Revenue, Total Labor Cost, Total Harvest Weight, and Avg. Quality Score.
- Crop yield analytics: Review Grade A yield percentage by growing system and crop type.
- Cost analysis: Compare labor cost, energy cost, revenue, farm site, region, and zone performance.
- Quality review: Analyze average quality score, Grade A yield, records by zone, and technician completion.
- Operations tracking: Study completion percentage, downtime, completed batches, harvest weight, and Grade A weight.
- Interactive slicers: Filter the dashboard quickly without rebuilding charts or formulas.
- Refreshable pivot structure: Update the Data Sheet, click Refresh All, and review refreshed charts.
Dashboard Pages Explanation
1. Overview Page
The Overview page works as the executive summary. The top section displays Total Revenue, Total Labor Cost, Total Harvest Weight, and Avg. Quality Score, giving leadership a quick read on financial, production, and quality performance.
Total Revenue by Month: This chart shows revenue movement across months. It helps managers identify strong production or sales periods and compare month-to-month performance.
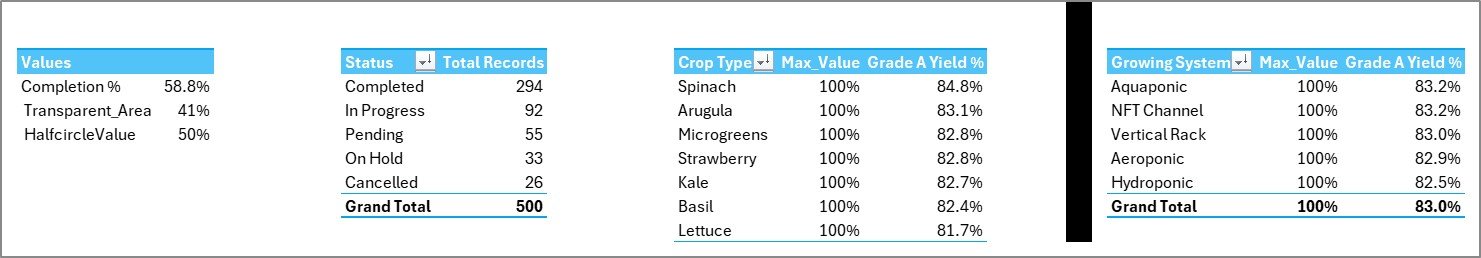
Completion %: This visual summarizes how much work or batch activity is complete. It helps operations teams quickly understand whether the indoor farm is moving on schedule.
Grade A Yield % by Crop Type: This chart compares premium-grade yield across crop types. It helps crop managers identify which crops are delivering the highest quality output.
Total Records by Status: This chart breaks records into operational statuses. It helps users see active, completed, delayed, or pending work without scanning raw rows.
2. Crop Yield
The Crop Yield page focuses on production quality and cost movement. Grade A Yield % by Growing System compares output quality across indoor farming systems. Avg. Quality Score by Farm Site shows which locations maintain stronger quality. Total Energy Cost vs Total Labor Cost by Month helps users understand monthly operating cost pressure. Total Energy Cost by Zone shows where energy usage is concentrated.
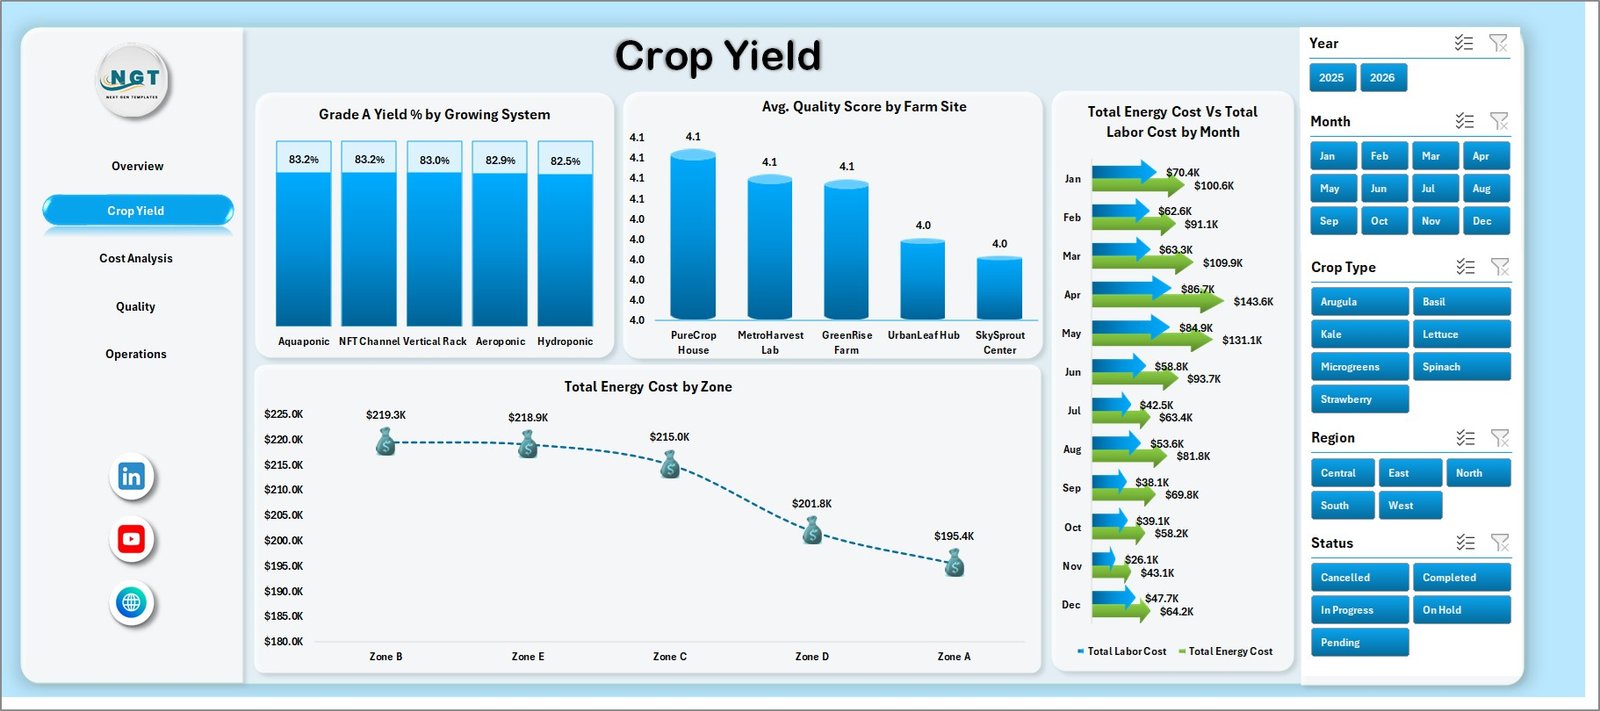
Crop Yield
3. Cost Analysis
The Cost Analysis page gives a financial lens for indoor farming performance. Total Revenue by Region identifies regions that contribute the most revenue. Total Records by Growing System shows where activity is concentrated. Avg. Quality Score by Crop Type connects quality with crop selection. Total Labor Cost vs Total Energy Cost by Farm Site compares the two major controllable cost categories by location.
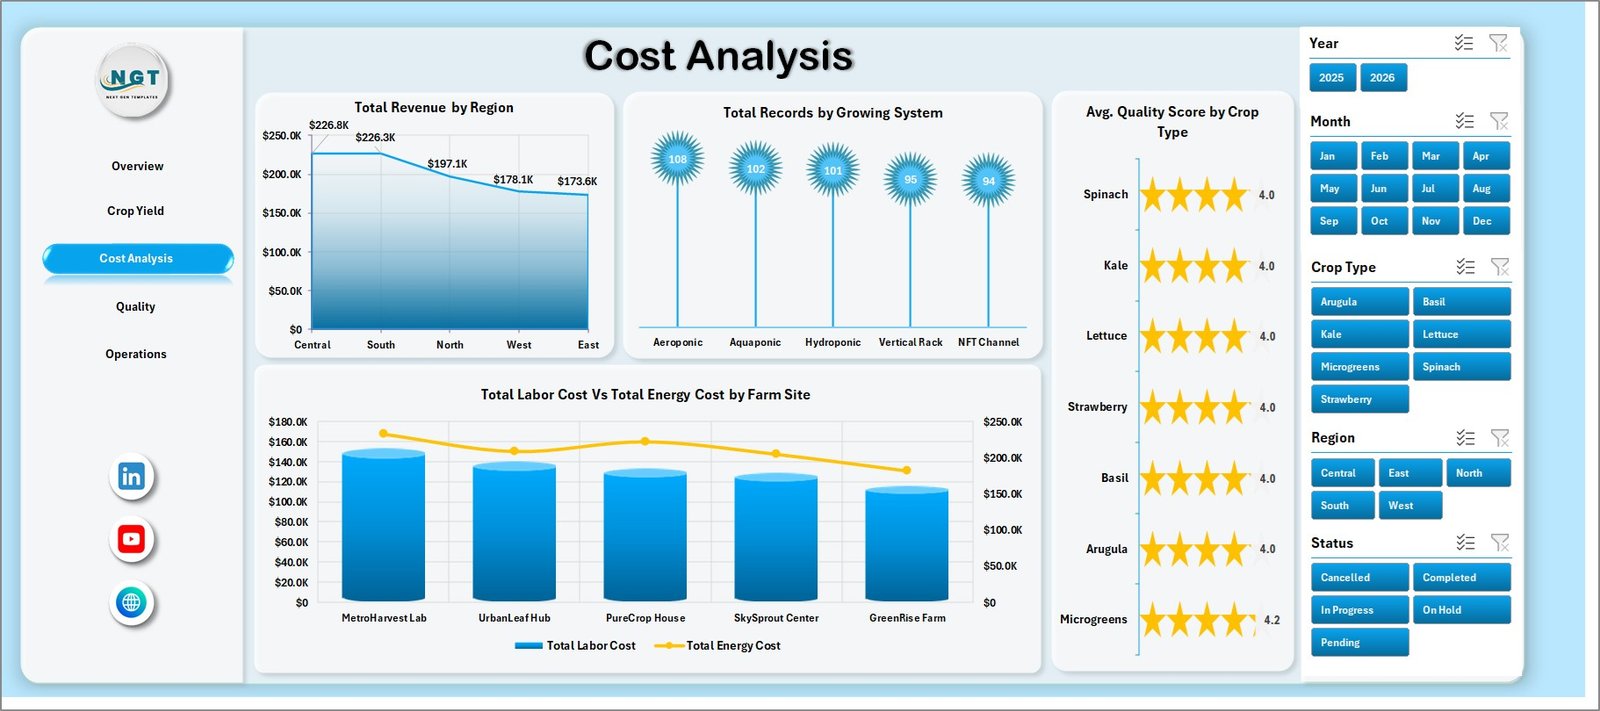
Cost Analysis
4. Quality
The Quality page is built for teams responsible for crop standards and consistent output. Avg. Quality Score by Region compares regional quality. Grade A Yield % by Month shows whether premium output is improving or slipping over time. Total Records by Zone highlights volume by farm zone. Completed Batches vs Total Records by Technician helps review technician-level throughput.
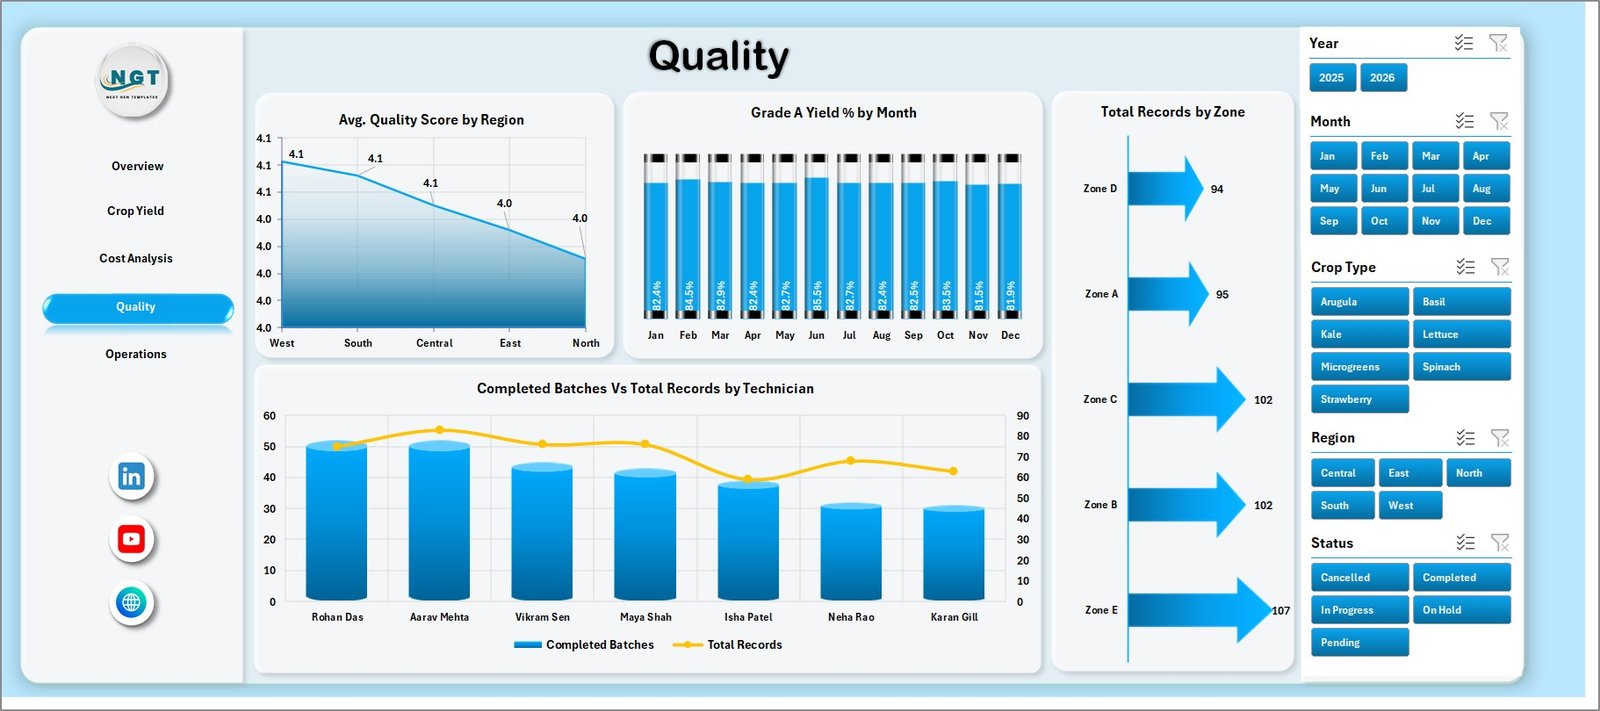
Quality
5. Operations
The Operations page supports weekly execution reviews. Completion % by Quarter tracks progress across quarters. Total Downtime Hours by Technician shows where follow-up or training may be needed. Total Harvest Weight vs Total Grade A Weight by Crop Type compares total output with premium output. Total Records vs Completed Batches by Zone shows zone-level workload and completion.
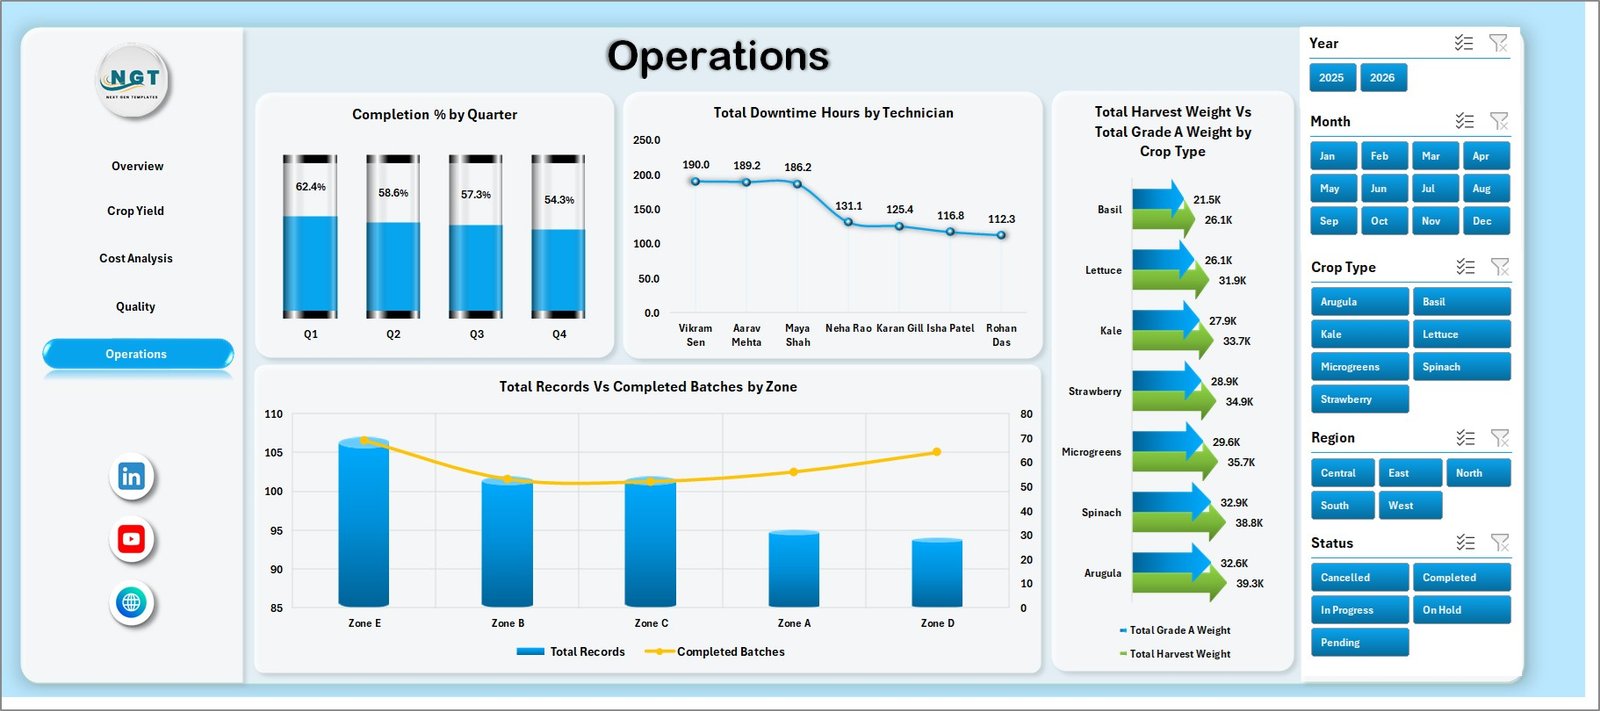
Operations
6. Data Sheet Tab
The Data Sheet is where users add or replace records in the same format as the sample data. Keep crop type, growing system, region, farm site, zone, technician, status, dates, revenue, labor cost, energy cost, harvest weight, Grade A weight, quality score, completion, and downtime fields consistent so the dashboard refreshes correctly.
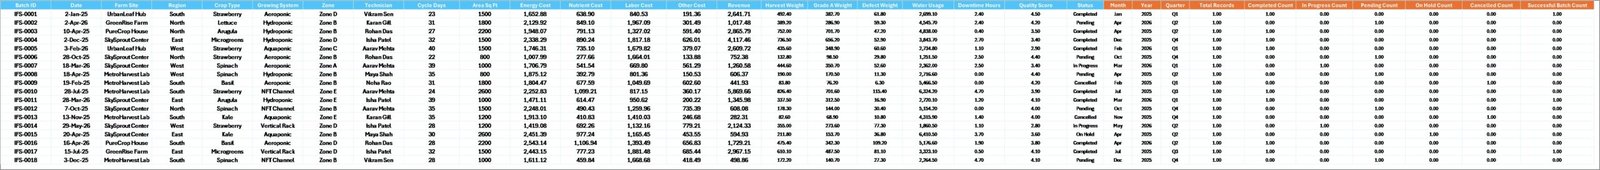
Data Sheet tab
7. Support Sheet Tab
The Support Sheet contains multiple pivot tables used to create the entire dashboard dynamically. After updating the Data Sheet, go to the Excel Data ribbon and click Refresh All. All pivot tables and connected charts will refresh together. You can keep this sheet hidden during normal reporting.
Support sheet tab
Indoor Farming Systems Dashboard in Excel vs. Google Sheets vs. Paid CRM/SaaS – Feature Comparison
| Feature | Indoor Farming Systems Dashboard in Excel | Google Sheets alternative | Paid farm SaaS |
|---|---|---|---|
| Cost | $17.99 one-time template | Low software cost but manual dashboard setup | Monthly or annual subscription |
| Platform | Microsoft Excel | Google Sheets | Vendor cloud platform |
| Setup time | Replace data and refresh | Build formulas, pivots, and charts manually | Implementation and onboarding |
| Real-time team collaboration | Available through OneDrive or SharePoint | Native collaboration | Usually included by plan |
| Mobile access | Excel mobile or web for viewing and light edits | Sheets mobile app | Usually included |
| Customizable fields | Editable workbook, charts, pivots, and sheets | Editable but more manual | Depends on vendor permissions |
| Share with link | Available through Microsoft 365 sharing | Native link sharing | Usually login controlled |
| Year-1 cost at 5 users | $17.99 plus Microsoft licensing if needed | Low license cost plus more setup time | Often hundreds or thousands |
| Indoor farming metrics | Built around yield, quality, revenue, labor, energy, downtime, zones, and technicians | Must be built manually | Depends on module and setup |
Who Should Use This Template
This template is ideal for indoor farming companies, controlled-environment agriculture teams, vertical farm operators, greenhouse businesses, crop production managers, operations teams, quality managers, and consultants who use Excel for regular performance reporting.
It is also useful for small and mid-sized teams that need structured reporting but are not ready to implement a larger farm management system. It is not a live sensor system, climate automation tool, ERP system, inventory purchasing system, payroll system, or regulatory compliance platform.
Real-World Use Cases
Priya, indoor farm owner: Priya reviews Total Revenue, Total Labor Cost, Total Harvest Weight, and Avg. Quality Score before weekly leadership meetings.
Marco, operations manager: Marco checks downtime by technician, completion percentage by quarter, and completed batches by zone to identify execution gaps.
Elena, agribusiness consultant: Elena uses the Crop Yield, Cost Analysis, and Quality pages to prepare client reports on yield grade, quality, cost, and site performance.
Advantages of Indoor Farming Systems Dashboard in Excel
- Faster reporting: Start from a ready workbook instead of designing a dashboard from a blank sheet.
- Excel flexibility: Edit charts, pivots, fields, formulas, colors, and sheets as needed.
- Quality and cost together: Review Grade A yield, quality score, energy cost, labor cost, and revenue in the same reporting file.
- Meeting-ready pages: Use tabs for leadership, crop production, finance, quality, and operations reviews.
- No recurring template subscription: The workbook is a one-time downloadable product from NextGenTemplates.
Opportunities for Improvement
- Automated source connection: Teams with databases can connect Excel to external data sources for a more automated workflow.
- Additional drill-down: Larger farms may add crop-batch detail, sensor readings, or customer/order reporting tabs.
- Custom formulas: Advanced users can add profit margin, waste rate, labor efficiency, energy per kilogram, or other KPIs if those fields exist in the data.
- Cloud sharing: Teams can store the workbook in OneDrive or SharePoint when collaboration and shared access are needed.
Best Practices
- Keep field names consistent: Do not rename Data Sheet columns unless you also update the related pivots and charts.
- Standardize dropdown values: Use consistent names for region, farm site, zone, crop type, growing system, technician, and status.
- Refresh after every data update: Click Refresh All after adding or replacing records.
- Review trends monthly: Compare month, quarter, and crop type trends instead of looking only at totals.
- Hide the Support Sheet: Keep pivot tables protected from accidental edits during everyday dashboard use.
Explore Relevant Templates
You may also like the Greenhouse Farming Dashboard in Excel, Vertical Farming Dashboard in Excel, Agriculture and Farm Dashboard in Excel, and Greenhouse Farming KPI Dashboard in Excel. Browse more Excel dashboard templates.
Frequently Asked Questions
What is the Indoor Farming Systems Dashboard in Excel?
It is a ready-to-use Excel dashboard for tracking indoor farming revenue, labor cost, energy cost, harvest weight, Grade A yield, quality score, downtime, completion, zones, technicians, crop types, and growing systems.
What pages are included?
The workbook includes Overview, Crop Yield, Cost Analysis, Quality, Operations, Data Sheet, and Support Sheet tabs.
Can I replace the sample data?
Yes. Add your records to the Data Sheet in the same format and click Refresh All from the Excel Data ribbon.
Does this dashboard require macros?
No macro workflow is required for normal use. The dashboard is designed around Excel data, pivot tables, charts, slicers, and refresh logic.
Can I customize the dashboard?
Yes. You can edit fields, charts, pivot tables, colors, sheet labels, and formulas if you are comfortable working in Excel.
Is this template a subscription?
No. It is a one-time downloadable Excel template from NextGenTemplates.
About the Author
Built by PK – Microsoft Certified Professional with 15+ years of Excel, Google Sheets, and Power BI experience. Founder of NextGenTemplates, reaching 300K+ subscribers across YouTube channels. Every template is hand-built and tested before release.
Conclusion
The Indoor Farming Systems Dashboard in Excel is a practical reporting workbook for teams that need to monitor revenue, labor cost, energy cost, harvest weight, quality score, Grade A yield, downtime, completion, zones, technicians, and operations from one place. It is especially useful for indoor farming teams that already collect records in Excel and want a cleaner way to present monthly and weekly performance.
Click here to download Indoor Farming Systems Dashboard in Excel.
Visit our YouTube channel for step-by-step Excel and dashboard tutorials: Youtube.com/@PKAnExcelExpert.