Modern HR and Learning & Development teams juggle dozens of training metrics across dozens of programs — completion rates, certification renewals, learning hours per employee, trainer satisfaction scores, training cost per FTE — but most teams still report them in scattered Excel files that take 4–6 hours to assemble each month. The Employee Training KPI Dashboard in Power BI consolidates those metrics into 3 connected pages with Month and KPI Group slicers, MTD/YTD/PY comparisons, automatic ▲▼ red/green icon logic, and a drill-through KPI Definition page — all driven by a 3-sheet Excel data source you maintain yourself.
This dashboard is built for HR managers, L&D specialists, and people analytics teams at 20–500 person companies who need polished training scorecards every month — without paying $70/user/month for a Tableau license or signing a multi-year LMS reporting contract. It works as a reporting layer on top of any LMS export and supports both LTB (Lower the Better) and UTB (Upper the Better) KPI types automatically.
Click here to Purchase the Employee Training KPI Dashboard in Power BI
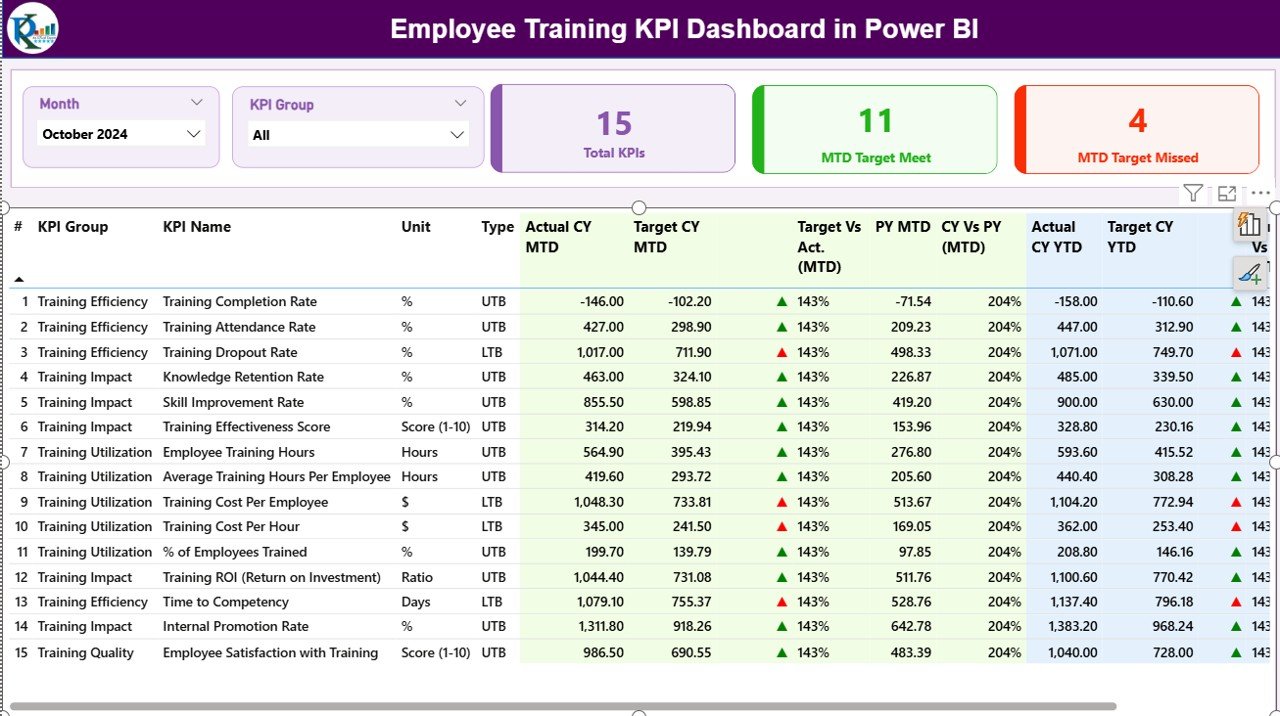
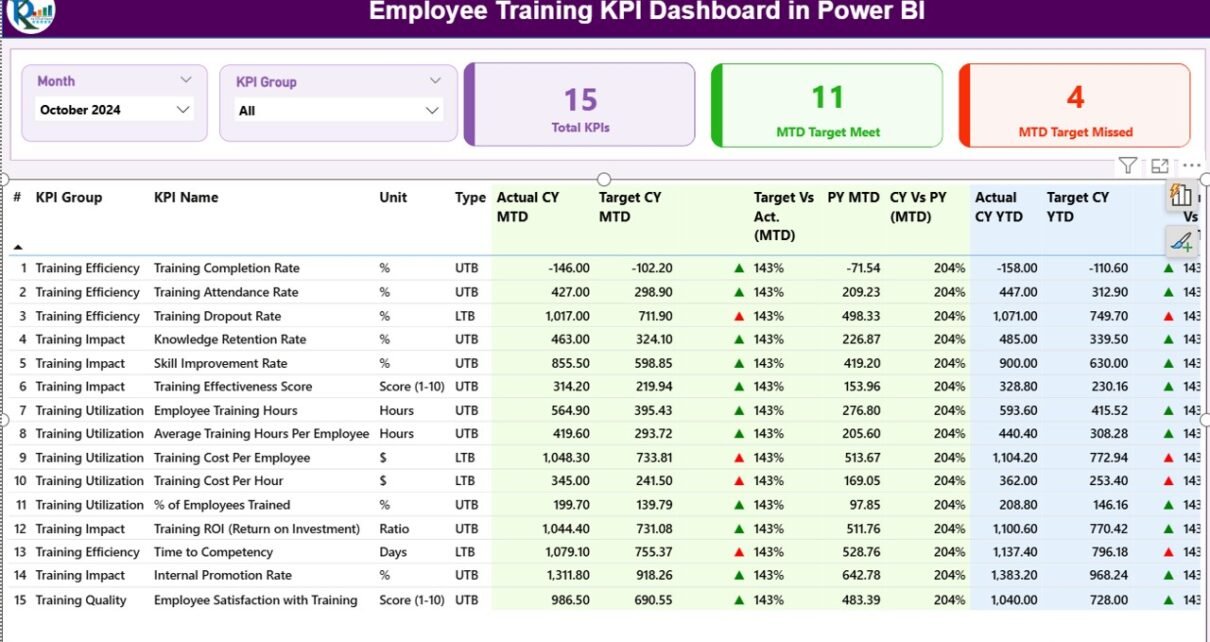
Employee Training KPI Dashboard in Power BI — Summary Page
Why Use a Power BI Dashboard for Employee Training KPIs?
Most HR teams already track training KPIs — but they live in disconnected spreadsheets, LMS exports, and manual reports. According to Microsoft’s Power BI documentation, Power BI Desktop is free and supports interactive slicers, drill-through pages, and Excel-based data refresh out of the box — making it a natural fit for HR teams that already work in Excel but want richer visuals for leadership reports.
Compared to building dashboards in raw Excel, Power BI offers three clear advantages for L&D reporting: (1) interactive slicers replace VBA-driven dropdowns, (2) drill-through pages let leaders click into KPI definitions without leaving the dashboard, and (3) the visual layer scales much better when the KPI list grows past 15–20 metrics.
Key Features of the Employee Training KPI Dashboard in Power BI
The Employee Training KPI Dashboard tracks any training metric you define and presents it across three connected pages with full MTD, YTD, and prior-year comparisons. Setup is under 10 minutes and updates flow automatically from a 3-sheet Excel data source.
📊 3 Connected Power BI Pages — Summary Page, KPI Trend Page, and a hidden KPI Definition drill-through page
🎚️ Month and KPI Group Slicers on the Summary Page for instant filtering
🟢 3 Status Cards — Total KPIs, MTD Target Met, MTD Target Missed
📈 16-column KPI Table with CY MTD/YTD vs Target vs Previous Year
🔺🔻 Auto LTB/UTB Icon Logic — green ▲ and red ▼ markers on both MTD and YTD
📉 2 Combo Charts on the KPI Trend Page comparing CY, PY, and Target
📘 Drill-Through KPI Definition Page with Formula, Definition, and Type
📂 Excel-Driven Data Source — three structured input sheets, fully editable
Dashboard Pages Explanation
1. Summary Page — The Main KPI Performance View
The Summary Page is the home view of the Employee Training KPI Dashboard. The top of the page hosts the Month Slicer (select any reporting month) and the KPI Group Slicer (filter by category like Compliance Training, Skill Development, Onboarding, etc.).
Below the slicers sit three KPI status cards that update instantly:
- Total KPIs Count — how many KPIs you’re currently tracking
- MTD Target Met Count — KPIs that hit or exceeded their Month-to-Date target
- MTD Target Missed Count — KPIs that fell short of their MTD target
The detailed KPI table below the cards shows 16 columns per KPI: KPI Number, KPI Group, KPI Name, Unit, Type (LTB/UTB), Actual CY MTD, Target CY MTD, MTD Icon, Target vs Act. (MTD), PY MTD, CY vs PY (MTD), Actual CY YTD, Target CY YTD, YTD Icon, Target vs Act. (YTD), PY YTD, and CY vs PY (YTD). Every row tells the full performance story for one KPI in a single horizontal scroll.
2. KPI Trend Page — Monthly & YTD Patterns
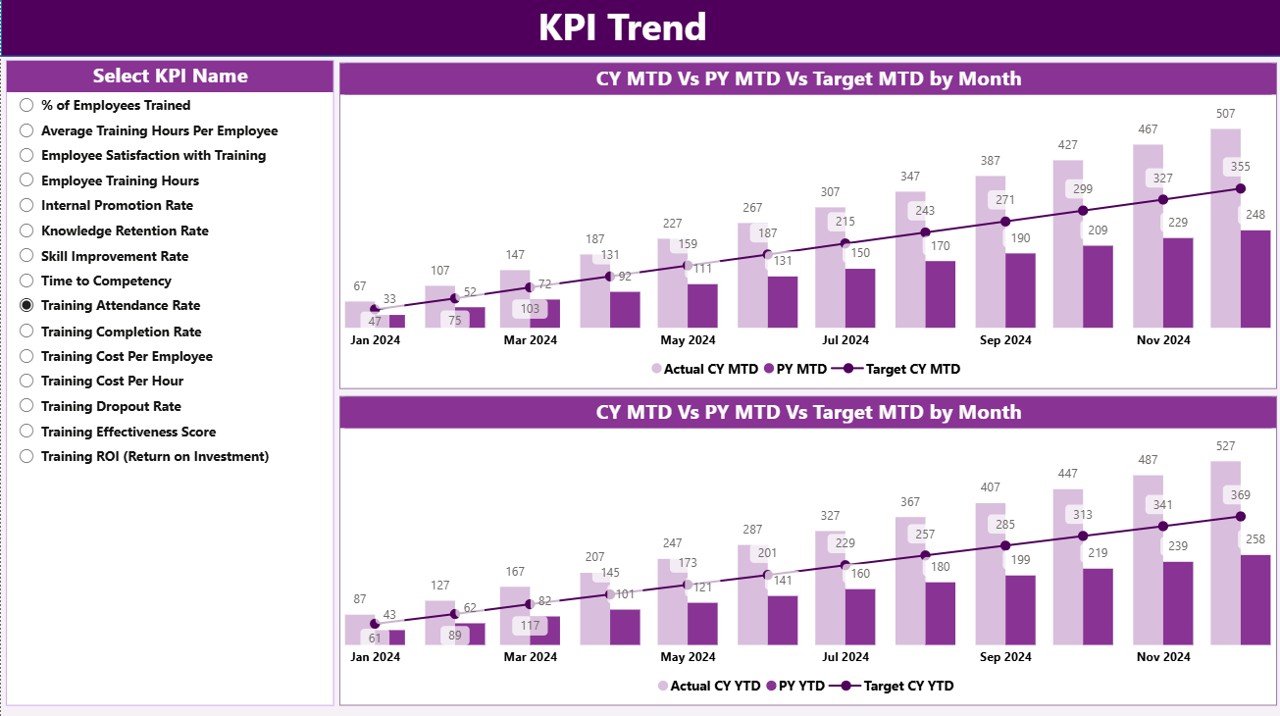
Employee Training KPI Dashboard — KPI Trend Page
The KPI Trend Page focuses on time-series analysis. A KPI Name slicer on the left lets you focus on any single training metric, then two combo charts plot the data:
- MTD Combo Chart — Current Year Actuals, Previous Year Actuals, and Target side by side for each month
- YTD Combo Chart — same three series but cumulative across the year
This is where you spot seasonal patterns (like training compliance dips in Q4 when teams hit year-end deadlines), measure year-over-year improvement, and identify which months consistently miss target.
3. KPI Definition Page — Drill-Through Documentation
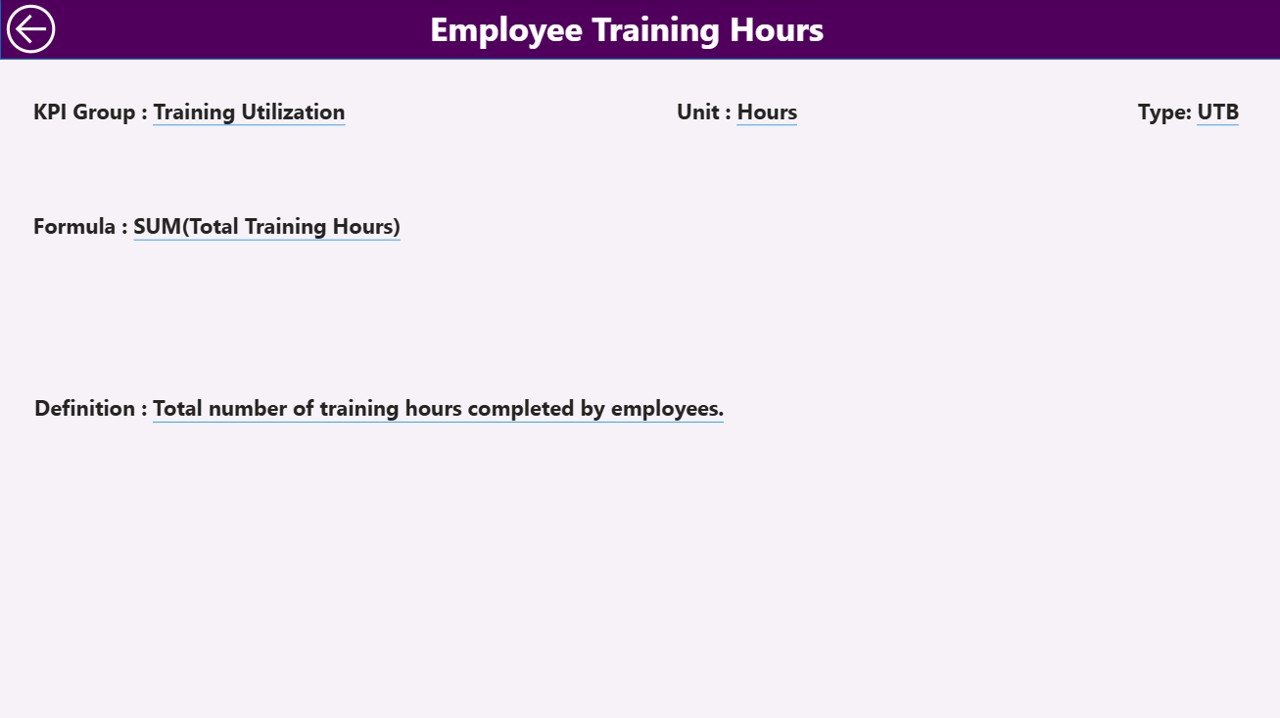
Employee Training KPI Dashboard — KPI Definition Page
This is a hidden drill-through page accessed by right-clicking any KPI row on the Summary Page. It displays KPI Number, KPI Group, KPI Name, Unit, Formula, Definition, and KPI Type (LTB or UTB). A back button in the top-left corner returns you to the Summary in one click.
This page is a quiet hero of the dashboard: it doubles as audit documentation, onboarding material for new HR analysts, and a single source of truth when leadership asks “how exactly is that KPI calculated?”
Excel Data Source Sheets
Three structured Excel sheets drive the dashboard:
- Input_Actual — KPI Name, Month (first day of month), MTD Actual, YTD Actual
- Input_Target — KPI Name, Month, MTD Target, YTD Target
- KPI Definition — KPI Number, Group, Name, Unit, Formula, Definition, Type (LTB/UTB)
Update any of these sheets and click Refresh in Power BI Desktop — every visual updates automatically.
Employee Training KPI Dashboard vs. Tableau Alternative vs. Cornerstone / BambooHR — Feature Comparison
| Feature | Employee Training KPI Dashboard (Power BI) | Tableau / Qlik HR Dashboard | Cornerstone LMS / BambooHR |
|---|---|---|---|
| Cost | $11.99 one-time | $70 / user / month | $6–$15 / user / month |
| Platform | Power BI Desktop (free) | Tableau / Qlik (paid) | Web SaaS |
| Setup time | Under 10 minutes | 1–2 weeks | 4–12 weeks |
| MTD/YTD/PY comparison | Built-in (16 columns) | Custom build | Limited |
| LTB/UTB icon logic | Pre-built ▲▼ | Manual DAX | Not configurable |
| KPI drill-through | Built-in | Custom build | External docs only |
| Year-1 cost (5 users) | $11.99 total | $4,200 | $360–$900 + setup |
| Customizable KPIs | Edit Excel sheet | Edit calc fields | Vendor catalog only |
For HR and L&D teams that want MTD/YTD/PY training analytics with target tracking — without paying $70/user/month for Tableau or committing to a multi-year LMS contract — the Employee Training KPI Dashboard sits in the sweet spot.
Who Should Use This Template
Perfect for:
- HR and L&D managers at 20–500 person companies needing monthly training scorecards for leadership
- Corporate training coordinators tracking course completion, certification rates, and trainer effectiveness
- People analytics analysts who want a tested KPI framework with MTD, YTD, and prior-year comparisons
- L&D consultants delivering portable, white-label-ready Power BI files to multiple clients
- HR business partners reporting to executives who require professional, audit-ready training analytics
Not a fit if:
- You’re a 5,000+ employee enterprise needing SOC 2, SSO, or row-level security with Active Directory
- You need an LMS — this is a reporting layer over LMS data, not a course delivery platform
- You need real-time streaming dashboards — this refreshes when you update the Excel file
Real-World Use Cases
Priya — L&D Lead at a 180-person SaaS company in Bengaluru. Every month Priya pulls completion rates, learning hours per employee, certification renewals, and trainer satisfaction scores from her LMS export. She drops them into the Excel input sheets, refreshes the .pbix file, and presents a polished MTD vs YTD vs Previous Year scorecard to the CHRO in under 30 minutes. Her old workflow took 4 hours in raw Excel.
James — HR Business Partner, manufacturing division. James tracks safety training compliance, induction completion within 30 days, and skill certification renewals across 7 plants. The CY vs PY columns on the Summary Page give him a clear narrative for the quarterly board pack: “Plant 4 fixed its safety training gap; Plant 2 is sliding — here’s why.” The drill-through KPI Definition page settles every “how is that calculated” question on the spot.
Maria — Independent L&D Consultant. Maria delivers customized .pbix files to 6 client companies. Each client gets the same 3-page structure with their own KPIs mapped to the Input sheets. The drill-through KPI Definition page doubles as audit documentation, saving her 8–10 hours per client per quarter on report formatting.
Advantages of the Employee Training KPI Dashboard in Power BI
✅ Replaces $4,200/year Tableau builds with a $11.99 one-time purchase — pure cost arbitrage for small and mid-sized teams
✅ Cuts monthly reporting time from 4–6 hours of Excel wrangling to under 30 minutes of data entry plus a Power BI refresh
✅ Standardizes KPI definitions across the team with a single, editable Excel definition sheet
✅ Handles both LTB and UTB types automatically — no DAX writing required
✅ Audit-ready drill-through page makes governance and compliance reviews simple
✅ Lifetime access with no per-user fees — share the .pbix freely inside the team
✅ Scales easily — add new KPIs to the Excel definition sheet and they appear automatically in slicers and tables
Opportunities for Improvement
This dashboard intentionally trades some features for simplicity and price. A few honest limitations worth knowing before you buy:
- Not a real-time streaming dashboard. It refreshes when you update the Excel data source — not on a sub-minute schedule. If you need live KPI streaming, you’ll need a database connection and DirectQuery, which this template doesn’t include.
- No row-level security or SSO. Anyone with the .pbix file sees all KPIs. Enterprise teams that need RLS by manager or department will need to add it manually in Power BI Desktop.
- 3 pages by design — not 10. The Summary, KPI Trend, and KPI Definition pages cover the 80% reporting use case. If you need a department-level filter page, plant-by-plant breakdown page, or custom executive view, you’ll add them yourself.
Best Practices
📌 Keep KPI names consistent across all three Excel sheets — the dashboard joins on KPI Name, so a typo in one sheet drops the KPI from the visuals.
📌 Always use the first day of the month in the Month column (e.g., 2026-05-01 not 2026-05-15) so the time intelligence works correctly across MTD and YTD calculations.
📌 Set realistic targets in Input_Target. Stretch targets that miss every month make the MTD Target Missed card meaningless. Aim for targets that 70–80% of KPIs hit on a typical month.
📌 Update KPI Definitions yearly as your training strategy evolves. New compliance requirements, new role-specific certifications, new leadership development programs — they all belong in the KPI Definition sheet.
📌 Publish to Power BI Service if your team needs cloud access. Configure scheduled refresh against the Excel file in OneDrive or SharePoint and the dashboard updates automatically.
Explore Relevant Templates
If the Employee Training KPI Dashboard fits part of your workflow, these companions on NextGenTemplates.com extend the coverage:
- Learning and Development (L&D) KPI Dashboard in Power BI — broader L&D KPI coverage with the same 3-page structure
- Learning and Development (L&D) KPI Dashboard in Excel — same KPI framework in pure Excel for teams without Power BI access
- Productivity Tracker KPI Dashboard in Power BI — complement training analytics with downstream productivity metrics
- Detailed walkthrough of the L&D KPI Dashboard in Power BI
- Browse all Power BI KPI Dashboards
Frequently Asked Questions
What KPIs does the Employee Training KPI Dashboard in Power BI track?
It tracks any L&D metric you define in the KPI Definition sheet. Common examples include training completion rate, average learning hours per employee, certification rate, trainer satisfaction score, training cost per employee, and skills gap closure. Both LTB and UTB metric types work out of the box with automatic ▲▼ red/green icons.
How long does setup take for the Employee Training KPI Dashboard in Power BI?
Under 10 minutes. Open the linked Excel file, paste your training KPI values into the Input_Actual, Input_Target, and KPI Definition sheets, then open the .pbix file in Power BI Desktop and click Refresh. The Summary, KPI Trend, and KPI Definition pages auto-build from the Excel data.
How does the Employee Training KPI Dashboard compare to BambooHR or Cornerstone LMS?
BambooHR and Cornerstone are full HRIS platforms costing $6–$15 per user per month with vendor-defined reports. The Employee Training KPI Dashboard in Power BI is $11.99 one-time, fully customizable, and acts as a reporting layer that sits on top of any LMS data export — so you keep your HRIS but get richer, cheaper analytics on top.
Do I need advanced Power BI skills to use the Employee Training KPI Dashboard?
No. Basic Power BI Desktop knowledge is enough. All visuals, slicers, and drill-through interactions are pre-built in the .pbix file. You only edit the linked Excel file to update data — no DAX writing, no data modeling, and no Power Query work is required.
Can I customize the KPIs in the Employee Training KPI Dashboard?
Yes, fully. Add any new KPI Name to the KPI Definition, Input_Actual, and Input_Target sheets, then refresh the .pbix file. The new KPI appears automatically in the Summary table, in the KPI Group slicer, and in the KPI Name slicer on the Trend Page — no Power BI editing required.
Does the Employee Training KPI Dashboard work in Power BI Service (cloud)?
Yes. Although the dashboard is built in Power BI Desktop (free from Microsoft), you can publish the .pbix to Power BI Service for cloud sharing. Configure a scheduled refresh against the Excel file in OneDrive or SharePoint and the dashboard updates automatically.
Is the Employee Training KPI Dashboard a one-time purchase or a subscription?
One-time payment of $11.99 with lifetime access. You receive the Power BI .pbix file and Excel data source via instant download — no per-user fees, no monthly subscription, and no renewal required. This is a key advantage over paid SaaS HR analytics platforms.
About the Author
Built by PK — Microsoft Certified Professional with 15+ years of Excel, Google Sheets, and Power BI experience. Founder of NextGenTemplates, reaching 300K+ subscribers across YouTube channels. Every template is hand-built and tested before release.
Conclusion
The Employee Training KPI Dashboard in Power BI is a complete training analytics solution at a one-time price. Three connected Power BI pages, a 16-column KPI table, automatic LTB/UTB icon logic, drill-through KPI documentation, and a clean 3-sheet Excel data source — built so HR and L&D teams can replace $4,200/year Tableau builds and multi-month LMS reporting projects with a $11.99 download.
👉 Click here to Purchase the Employee Training KPI Dashboard in Power BI
✅ Instant download · One-time payment · No subscription · Lifetime access
Last updated: May 2026
Visit our YouTube channel for step-by-step video tutorials.