Rehabilitation centers handle 2.1 million inpatient stays annually in the United States alone, yet over 60% of small-to-mid-sized facilities still rely on manual spreadsheets and paper-based tracking to monitor treatment outcomes. The Rehabilitation Center KPI Scorecard in Excel addresses this gap by tracking 15+ rehabilitation KPIs across 4 structured worksheets with MTD and YTD comparisons, trend charts, and conditional formatting indicators — all auto-updating from a single input sheet.
In this article, we have created a ready-to-use Rehabilitation Center KPI Scorecard in Excel. This is a ready-to-use scorecard template that helps rehabilitation center managers, quality officers, and therapy clinic administrators track patient recovery rates, treatment adherence, and operational KPIs without expensive SaaS subscriptions.
Key Features of Rehabilitation Center KPI Scorecard in Excel
Click here to Purchase Rehabilitation Center KPI Scorecard in Excel
The Rehabilitation Center KPI Scorecard in Excel includes 4 purpose-built worksheets — Scorecard, KPI Trend, Input Data, and KPI Definition — giving you end-to-end control of rehabilitation performance tracking in a single Excel file. Here are the standout features that make this scorecard effective for daily operations:
- MTD and YTD Scorecard with Visual Indicators — The Scorecard sheet displays MTD Actual, Target, and Previous Year data alongside YTD equivalents. Color-coded conditional formatting lets you identify underperforming KPIs in seconds.
- Interactive KPI Trend Analysis — Select any KPI from the dropdown on the KPI Trend sheet to view its definition, formula, unit type (Lower the Better or Upper the Better), and monthly trend charts comparing Actual vs Target vs Previous Year.
- Structured KPI Definition Sheet — Enter each KPI’s name, group, unit, formula, definition, and type in one centralized location. The KPI Trend sheet pulls this metadata automatically for on-screen reference.
- Simple Monthly Data Entry — The Input Data sheet accepts monthly actual values, targets, and previous year numbers. Update data monthly and every chart refreshes automatically.
- No VBA or Macros Required — The scorecard runs on Excel formulas, dropdown menus, and conditional formatting. It works on both Windows and Mac without compatibility issues.
- Fully Customizable — Add new KPIs, adjust formulas, modify chart styles, or expand to additional years as your facility grows.
Scorecard Sheets Explanation
Click here to Purchase Rehabilitation Center KPI Scorecard in Excel
Below are the key features of this KPI Scorecard. This template includes 4 worksheets designed for rehabilitation center performance monitoring.
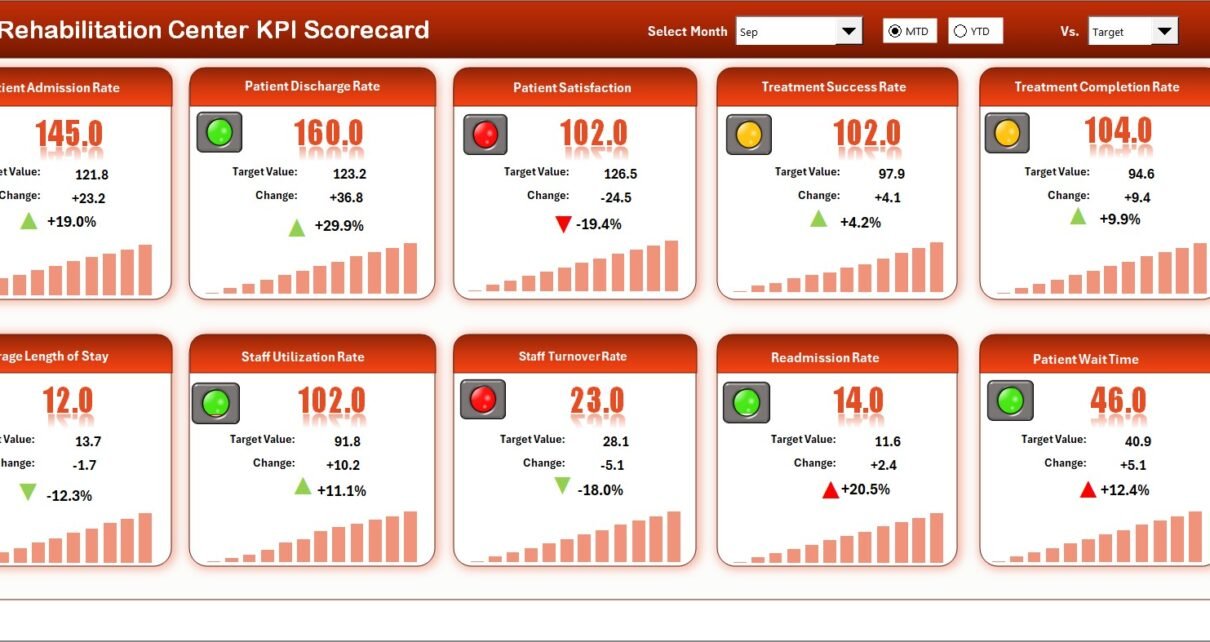
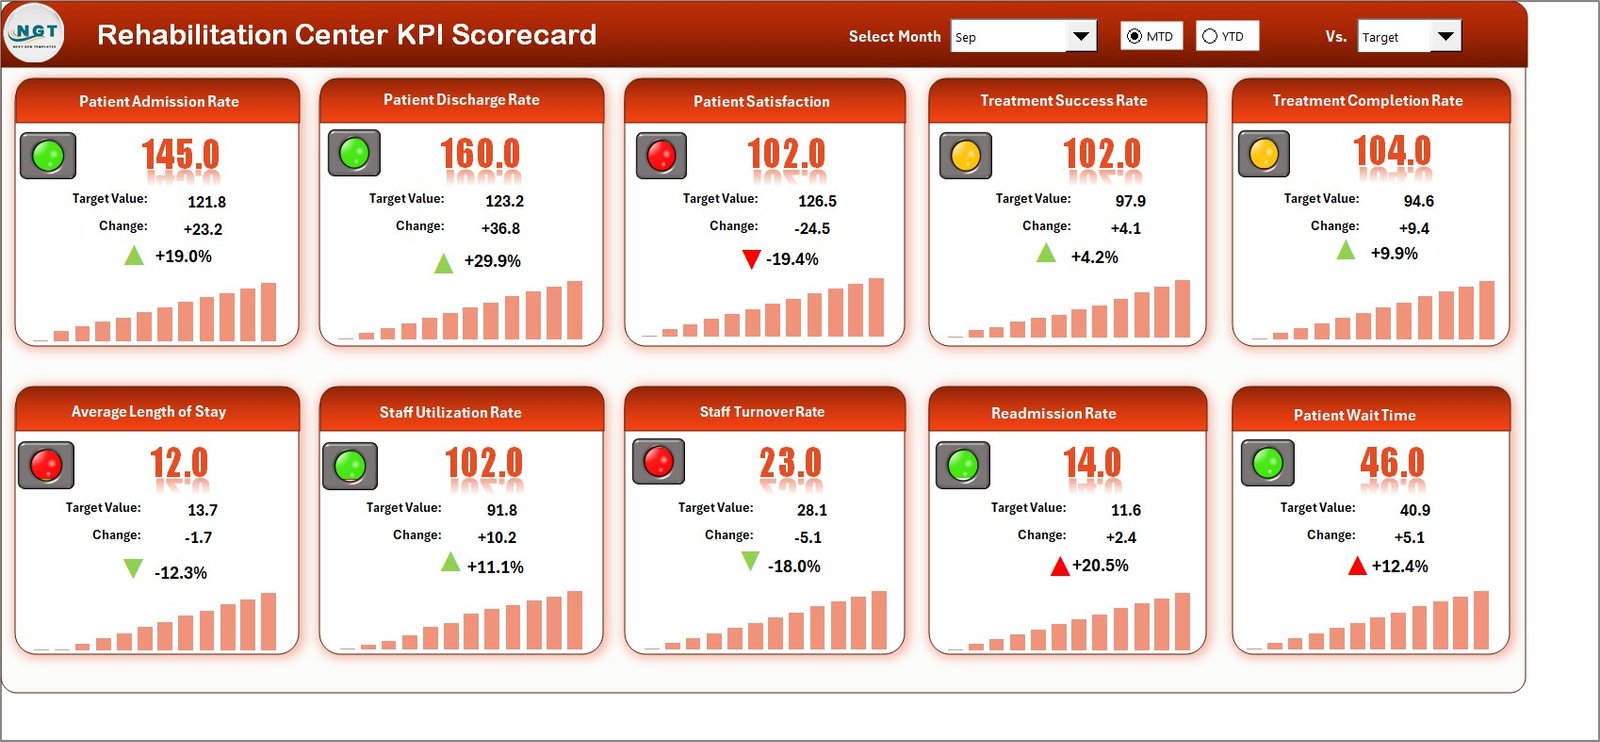
1. Scorecard Sheet
 Rehabilitation Center KPI Scorecard in Excel
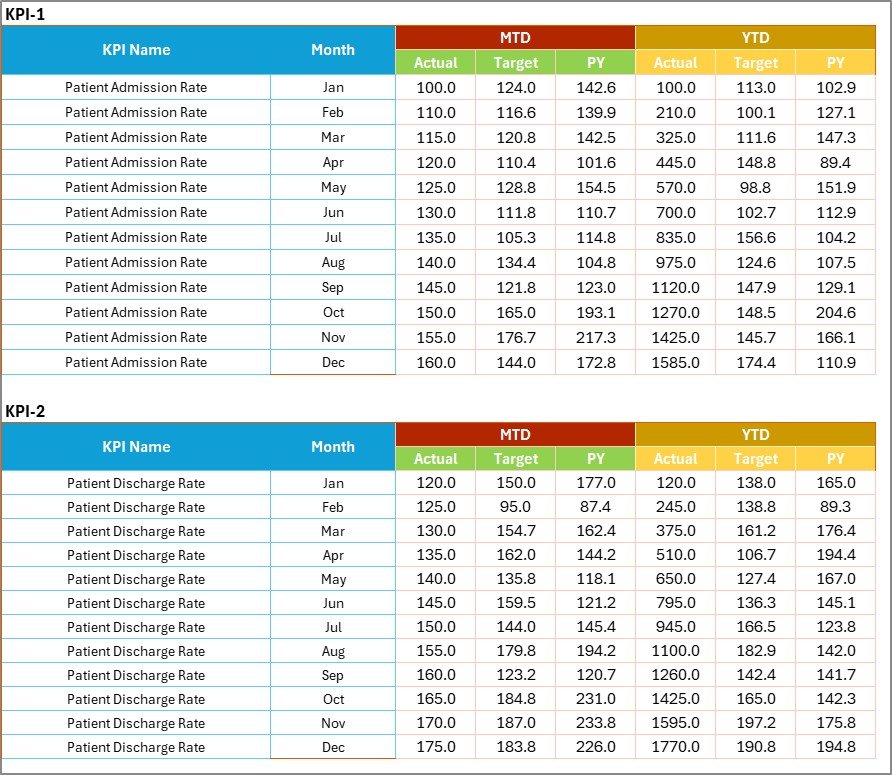
The Scorecard sheet is the main interface where you can view KPI performance. Key features include:
- Dropdown Menus — Select the month, MTD (Month-to-Date), or YTD (Year-to-Date) for performance analysis.
- Actual vs Target Values — Compare actual performance against targets for each KPI side by side.
- Visual Indicators — Quickly see performance status using color-coded visuals and conditional formatting arrows.
- Comprehensive KPI Overview — Display all relevant information about KPIs, including MTD and YTD comparisons against both targets and previous year numbers.
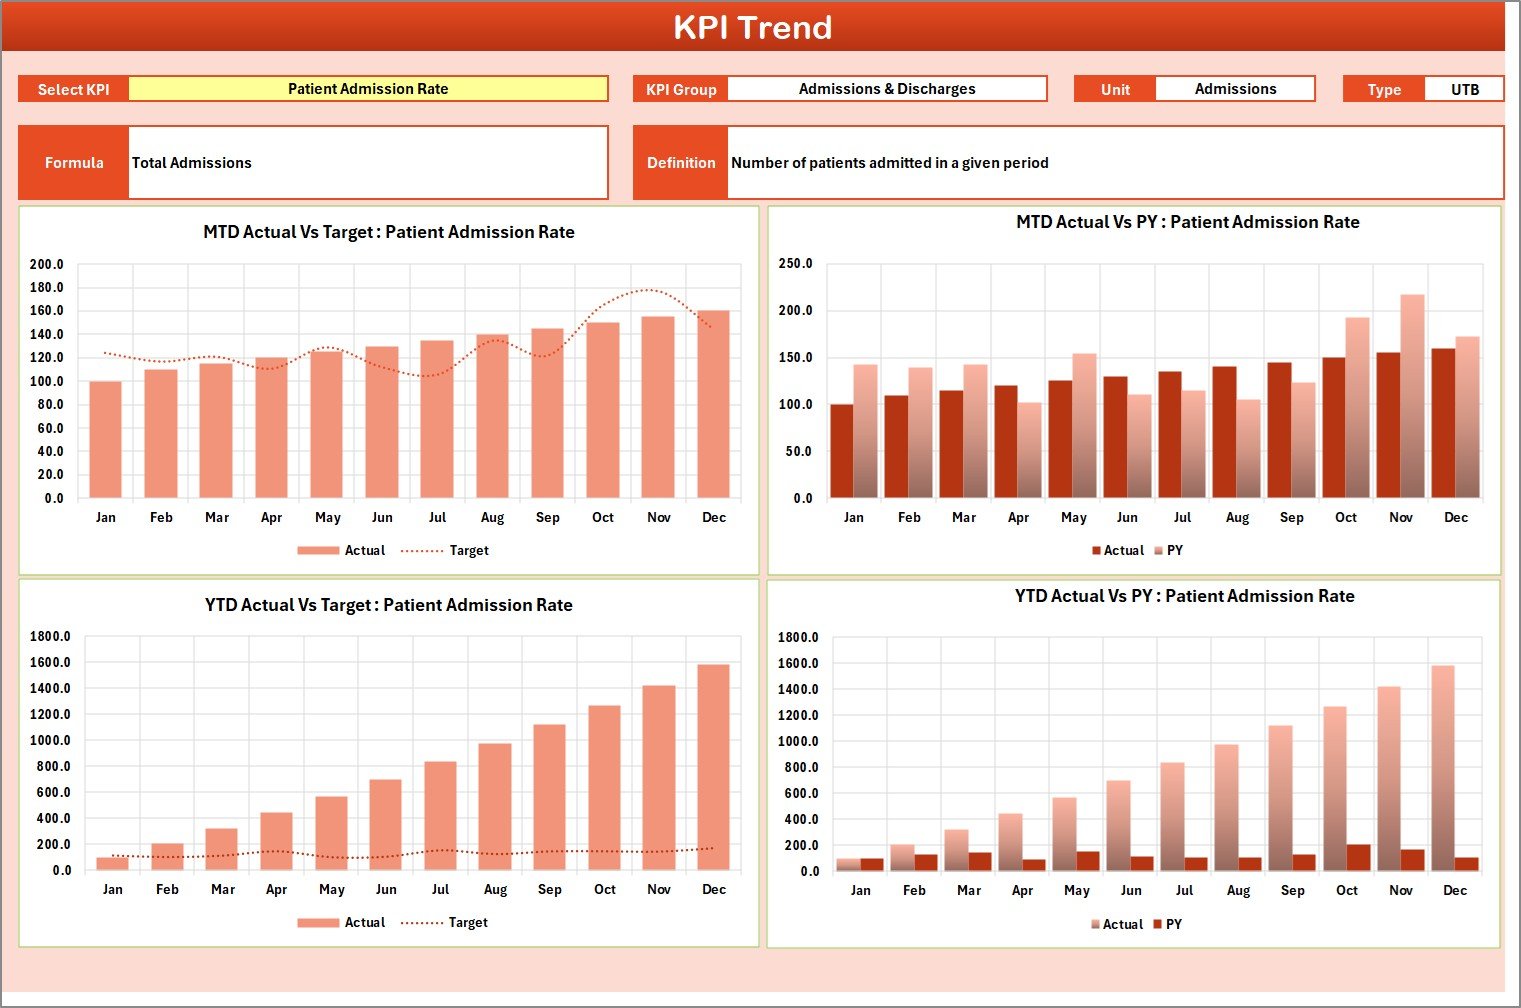
2. KPI Trend Sheet
 KPI Trend Sheet
Here you can select the KPI name from the dropdown available on cell C3. The sheet displays the KPI Group, Unit of KPI, Type of KPI (Lower the Better or Upper the Better), Formula of the KPI, and Definition of the KPI. We are also showing the MTD and YTD trend chart for Actual, Target, and PY numbers — enabling you to identify seasonal patterns and track improvement over time.
3. Input Data Sheet
 Input Data Sheet
The Input Data sheet is where you enter all KPI data. Record actual values, targets, and other metrics for each KPI. You can easily update data as new results become available, ensuring the scorecard remains current throughout the year. The structured table format makes monthly data entry straightforward even for non-technical staff.
4. KPI Definition Sheet
 KPI Definition Sheet
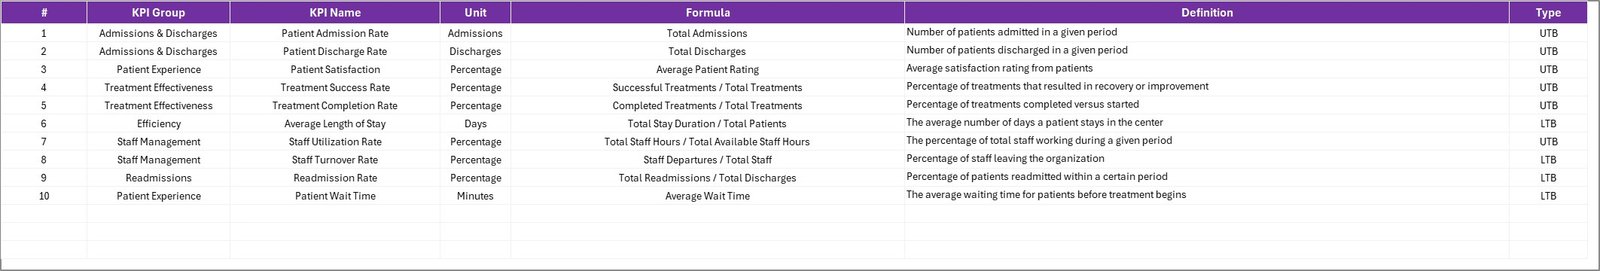
In this sheet, you enter the KPI Name, KPI Group, Unit, Formula, and KPI Definition. This serves as a centralized reference library so every team member — from therapists to administrators — understands exactly what each metric measures and how it is calculated. New staff can onboard faster by reviewing this sheet.
Rehabilitation Center KPI Scorecard in Excel vs. Google Sheets KPI Scorecard vs. Athenahealth — Feature Comparison
| Feature | Rehabilitation Center KPI Scorecard in Excel | Google Sheets KPI Scorecard | Athenahealth / Kareo |
|---|---|---|---|
| Cost | $12.99 one-time | $8.99 one-time (NextGenTemplates) | $140–$350 / provider / month |
| Platform | Microsoft Excel (desktop) | Google Sheets (browser-based) | Cloud-based SaaS |
| Setup Time | Under 10 minutes | Under 10 minutes | 2–4 weeks onboarding |
| Real-Time Collaboration | Via SharePoint / OneDrive | ✅ Native | ✅ Native |
| Mobile Access | Excel Mobile App | ✅ Browser | ✅ Dedicated App |
| Customizable KPIs | ✅ Fully editable | ✅ Fully editable | Limited to built-in metrics |
| MTD/YTD Trend Charts | ✅ Included | ✅ Included | Varies by plan |
| Year-1 Cost at 5 Users | $12.99 total | $8.99 total | $8,400–$21,000 |
| KPI Definition Library | ✅ Built-in sheet | ✅ Built-in sheet | Not included |
For rehabilitation centers that want structured KPI tracking without paying thousands per year, the Rehabilitation Center KPI Scorecard in Excel sits in the sweet spot between free tools and enterprise platforms.
Who Should Use This Template
✅ Perfect for:
- Rehabilitation center managers tracking patient recovery and treatment quality KPIs monthly
- Physical therapy clinics monitoring therapist performance and patient outcomes
- Healthcare administrators at 10–500 bed facilities who need structured Excel-based reporting
- Clinic quality officers preparing MTD and YTD performance reviews for leadership
- Small-to-mid-sized rehabilitation facilities that cannot justify $140+/month SaaS tools
❌ Not a fit if:
- You need EHR-integrated real-time dashboards with SOC 2 compliance and HIPAA audit trails
- You require consolidated multi-location reporting across 10+ facilities simultaneously
- Your organization mandates cloud-native platforms with API integrations to billing systems
Real-World Use Cases
Click here to Purchase Rehabilitation Center KPI Scorecard in Excel
Maria manages a 40-bed inpatient rehabilitation center in Texas. She uses the Rehabilitation Center KPI Scorecard in Excel to track 12 KPIs including patient readmission rate, average length of stay, and therapy session completion rate. Every month she updates the Input Data sheet in 15 minutes, then uses the Scorecard sheet during leadership meetings to present MTD and YTD performance — replacing a $200/month reporting tool she had previously subscribed to.
Dr. Raj runs a 3-therapist outpatient rehab clinic in Mumbai. He tracks patient recovery milestones, no-show rates, and revenue per session using this scorecard. The KPI Trend sheet helps him identify which months see the highest patient dropout, allowing him to adjust scheduling and follow-up protocols proactively. The KPI Definition sheet ensures his entire staff uses consistent terminology during patient reviews.
Susan is a quality assurance officer at a regional rehabilitation network. She downloads this scorecard for each facility, standardizing KPI definitions across locations. The KPI Definition sheet ensures every center measures patient satisfaction, treatment adherence, and discharge outcomes the same way — creating consistency in quarterly board reports across 4 facilities.
Advantages of Rehabilitation Center KPI Scorecard in Excel
- Eliminates Manual Reporting — All charts, scorecards, and trend lines update automatically when you enter monthly data. No copy-pasting between spreadsheets.
- Costs 99% Less Than SaaS Alternatives — At $12.99 one-time vs $140–$350/provider/month for Athenahealth or Kareo, even a 3-provider clinic saves over $5,000 annually.
- Standardizes KPI Definitions — The KPI Definition sheet ensures every department and location uses the same measurement criteria, eliminating inconsistencies in reporting.
- Supports Monthly and Yearly Reviews — MTD, YTD, Target, and Previous Year data all appear on one screen, making performance reviews faster and more data-driven.
- Works Offline — Unlike cloud-based tools, this Excel scorecard works without internet access — useful for facilities in areas with limited connectivity.
Opportunities for Improvement
Click here to Purchase Rehabilitation Center KPI Scorecard in Excel
- No Real-Time Data Sync — Data entry is manual. If your facility generates KPI data from an EHR system, you will need to export and paste it monthly.
- Single-Facility Design — The scorecard is designed for one facility at a time. Multi-location networks would need a separate file per site or a custom consolidation sheet.
- No Built-in Role-Based Access — Unlike SaaS platforms, Excel does not natively restrict who can edit specific sheets. You can use Excel’s sheet protection, but it is not as granular as enterprise tools.
Best Practices
- Update Data by the 5th of Each Month — Set a recurring calendar reminder to enter the previous month’s actual numbers into the Input Data sheet. Timely data ensures accurate MTD and YTD calculations.
- Review KPI Definitions Annually — Rehabilitation best practices evolve. Revisit the KPI Definition sheet at least once a year to add new metrics or retire outdated ones.
- Use the Trend Sheet for Quarterly Reviews — The KPI Trend sheet is especially useful during quarterly board meetings. Select 3–5 key KPIs and present their 12-month trends to show directional performance clearly.
- Back Up Your File — Save the scorecard on OneDrive or SharePoint for automatic backups and version history. This also enables co-authoring if multiple team members need to update data.
- Customize for Your Specialty — Rehabilitation centers vary widely — orthopedic rehab, neurological rehab, cardiac rehab, pediatric rehab. Customize the KPI Definition sheet to match your facility’s specific focus areas.
Explore Relevant Templates
If you found this scorecard useful, check out these related healthcare templates on NextGenTemplates:
- Physiotherapy & Rehabilitation KPI Dashboard in Excel — A 7-worksheet KPI dashboard for therapy clinics with automated trend charts and conditional formatting.
- Home Health Care KPI Scorecard in Excel — Track home healthcare performance with MTD/YTD comparisons and visual indicators.
- Substance Abuse Center KPI Scorecard in Excel — Monitor substance abuse treatment KPIs with the same scorecard structure.
- Telehealth Dashboard in Excel — Analyze telehealth session metrics, patient engagement, and provider performance.
- Hospital Patient Flow Dashboard in Excel — Track patient admissions, discharges, and bed occupancy with interactive charts.
Browse all KPI Dashboard Templates | Excel Dashboard Templates
Frequently Asked Questions
Click here to Purchase Rehabilitation Center KPI Scorecard in Excel
What KPIs does the Rehabilitation Center KPI Scorecard in Excel track?
The Rehabilitation Center KPI Scorecard in Excel tracks 15+ KPIs including patient recovery rate, readmission rate, therapy session adherence, average length of stay, patient satisfaction score, and operational efficiency metrics. All KPIs are fully customizable from the KPI Definition sheet.
How long does it take to set up this scorecard?
Setup takes under 10 minutes. Open the file in Excel, review the pre-loaded KPI definitions, enter your actual and target data in the Input Data sheet, and the Scorecard and Trend sheets update automatically with charts and indicators.
Can I add my own rehabilitation-specific KPIs?
Yes. The KPI Definition sheet lets you add unlimited KPIs with custom names, groups, units, formulas, and definitions. The scorecard and trend sheets automatically incorporate any new entries you add.
How does this compare to Athenahealth or Kareo for KPI tracking?
Athenahealth and Kareo charge $140–$350 per provider per month and require 2–4 weeks of onboarding. The Rehabilitation Center KPI Scorecard in Excel costs $12.99 one-time, sets up in under 10 minutes, and covers all essential KPI tracking needs for small-to-mid-sized facilities.
Do I need advanced Excel skills to use this template?
No. Basic Excel knowledge is sufficient. The scorecard uses dropdown menus for month and KPI selection, pre-built formulas for all calculations, and automated charts that update when you enter new data.
Is this scorecard compatible with Mac and Windows?
Yes. The Rehabilitation Center KPI Scorecard in Excel works on both Windows and Mac versions of Microsoft Excel. No macros or VBA are required, ensuring smooth cross-platform compatibility.
Can I use this for different types of rehabilitation centers?
Absolutely. The scorecard works for orthopedic rehabilitation, neurological rehabilitation, cardiac rehabilitation, pediatric rehabilitation, substance abuse recovery centers, and general inpatient rehabilitation. Customize the KPI Definition sheet to match your specialty.
About the Author
Built by PK — Microsoft Certified Professional with 15+ years of Excel, Google Sheets, and Power BI experience. Founder of NextGenTemplates, reaching 300K+ subscribers across YouTube channels. Every template is hand-built and tested before release.
Conclusion
The Rehabilitation Center KPI Scorecard in Excel gives rehabilitation center managers, therapy clinic administrators, and quality officers a structured, affordable way to track patient recovery KPIs, treatment outcomes, and operational performance. With 4 purpose-built worksheets, MTD/YTD comparisons, trend charts, and a built-in KPI definition library, it replaces expensive SaaS subscriptions at a fraction of the cost.
Click here to Purchase Rehabilitation Center KPI Scorecard in Excel
✅ Instant download · One-time payment · No subscription · Lifetime access
Visit our YouTube channel to learn step-by-step video tutorials.