Customs Clearance Agencies Dashboard in Excel is built for customs brokers, customs clearance agencies, freight forwarders, import-export teams, and trade compliance managers who need a clear view of shipment value, duty amount, service fees, penalties, inspections, documentation risk, broker workload, and clearance time. In customs operations, even small reporting delays can affect client communication, demurrage risk, penalty review, and branch performance tracking.
This Excel dashboard converts daily clearance records into a 5-page analytical workbook with KPI cards, slicers, charts, a structured Data Sheet, and a Support Sheet powered by pivot tables. Instead of building monthly reports from scattered spreadsheets, teams can update the data, click Refresh All, and review every page from the same file.
Download the product here: Customs Clearance Agencies Dashboard in Excel.
Key Features of Customs Clearance Agencies Dashboard in Excel
- 5 dashboard pages: Overview, Clearance Trend, Port Analysis, Risk Compliance, and Client Brokerage.
- Headline KPI cards: Total Shipment Value, Total Duty Amount, Total Service Fee, Total Penalty Amount, and Avg. Clearance Time.
- 18+ Excel visuals: Analyze country lanes, risk levels, statuses, months, ports, agency branches, shipment modes, brokers, entry types, and commodity groups.
- Multiple slicers: Filter the workbook quickly by operational dimensions during branch, broker, port, client, and compliance meetings.
- Data Sheet included: Replace sample customs clearance records using the same format.
- Support Sheet included: Pivot tables power the dashboard dynamically and can be kept hidden after setup.
- No macros required: The workbook uses Excel tables, pivot tables, slicers, and charts.
Dashboard Pages Explanation
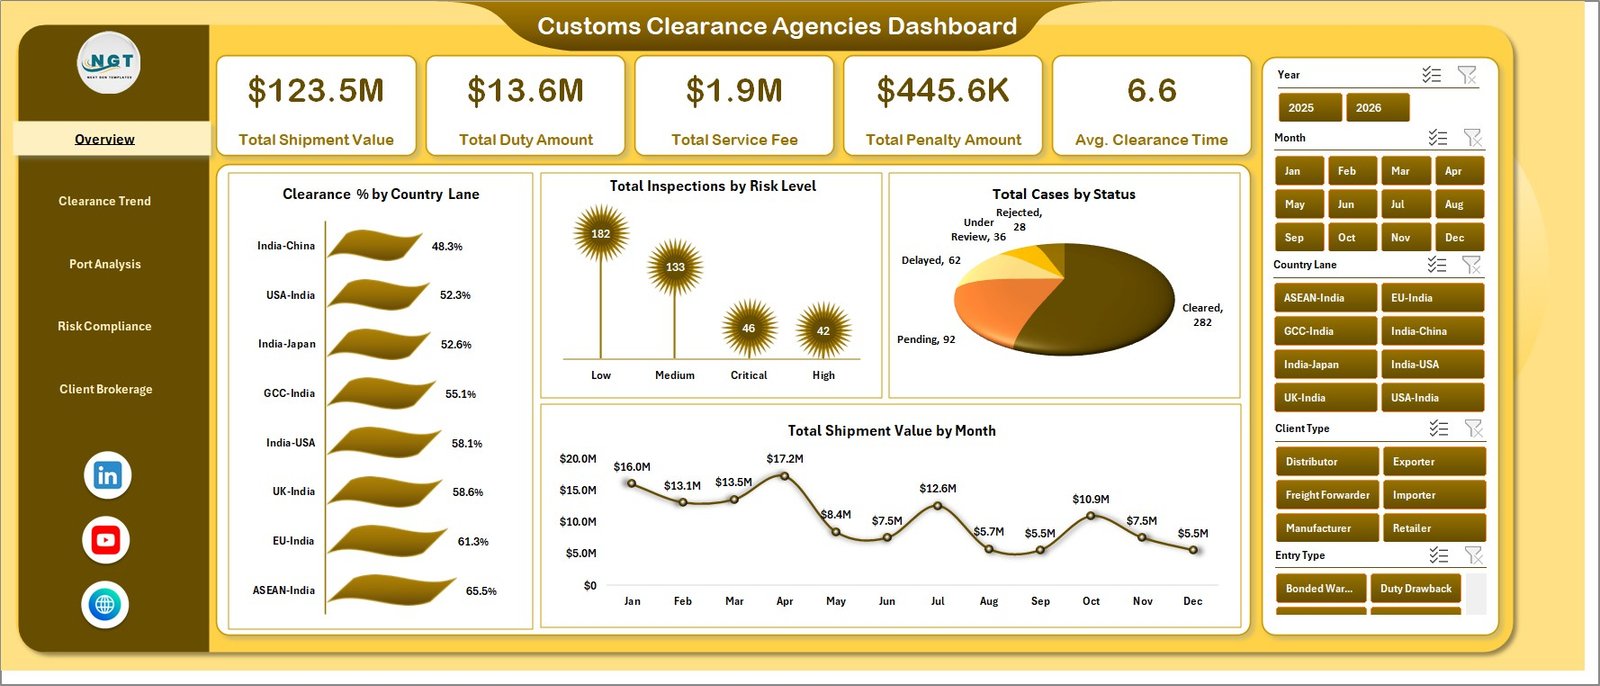
1. Overview Page
The Overview page gives managers the fastest read on customs clearance performance. At the top, KPI cards show Total Shipment Value, Total Duty Amount, Total Service Fee, Total Penalty Amount, and Avg. Clearance Time, so teams can understand financial exposure, charges, penalties, and processing speed before opening detailed pages.
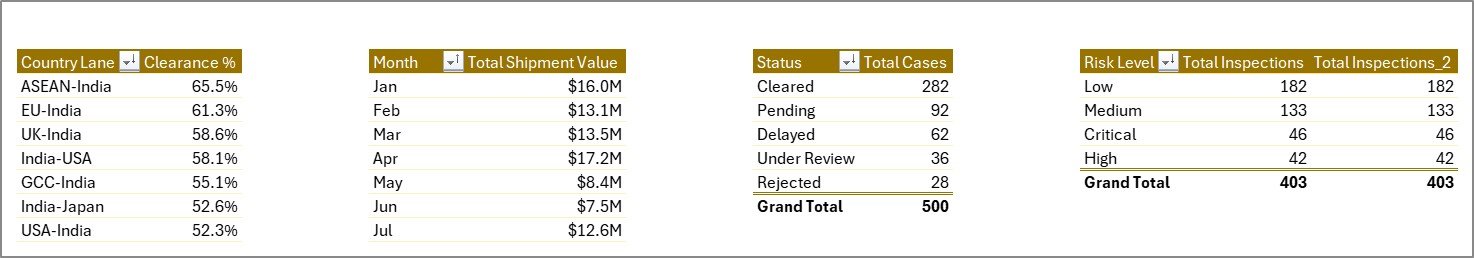
Clearance % by Country Lane compares clearance completion across trade lanes. This helps identify country-pair routes where documentation, inspection, tariff, or regulatory friction may be slowing clearance.
Total Inspections by Risk Level shows how inspection volume is distributed across low, medium, and high-risk cases. Compliance managers can use it to understand where review workload is concentrated.
Total Cases by Status breaks cases into workflow stages such as cleared, pending, rejected, delayed, or under review. It gives teams a fast workload snapshot during daily follow-ups.
Total Shipment Value by Month tracks the value of shipments handled across months. Finance and operations teams can compare shipment value with duty, service fee, and penalty movement.
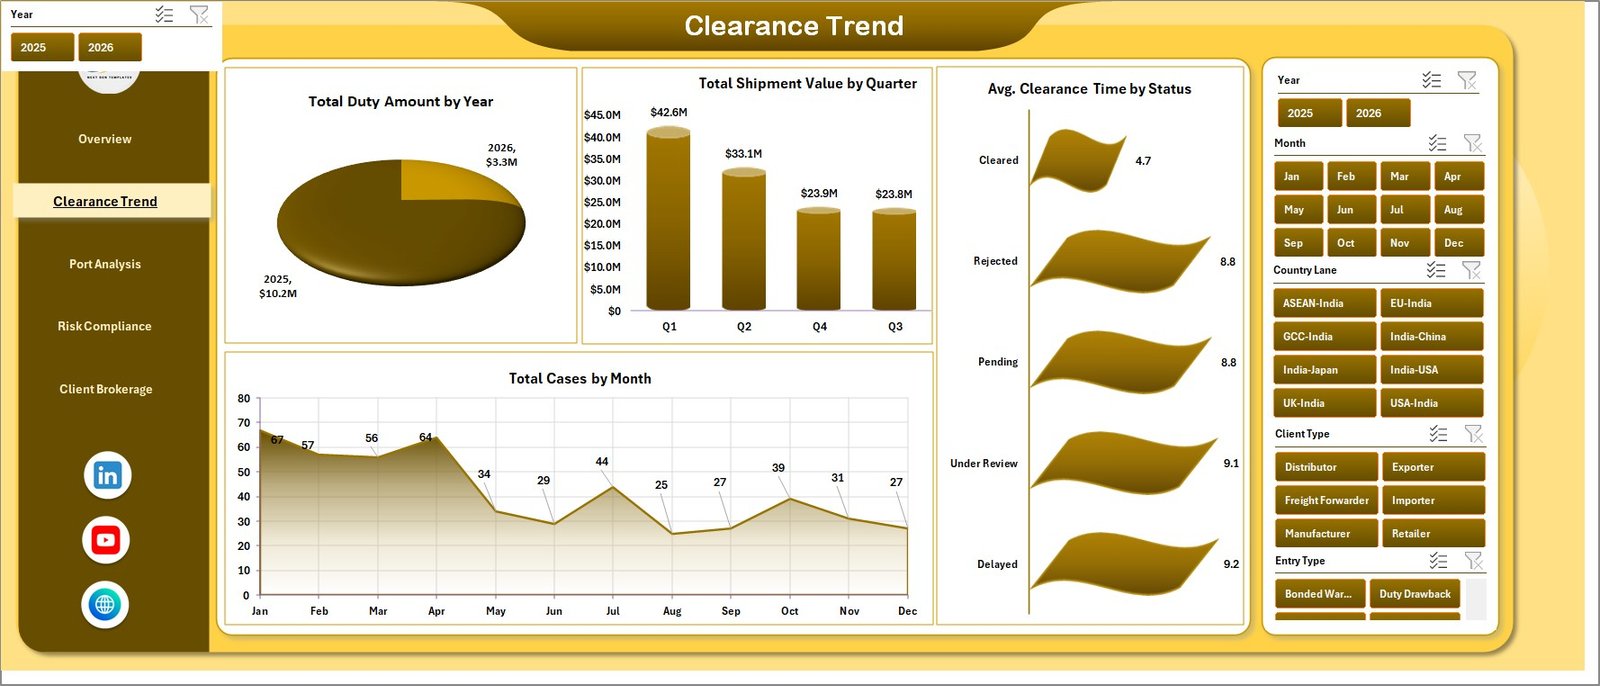
2. Clearance Trend
The Clearance Trend page focuses on time-based performance. It includes Total Duty Amount by Year, Total Shipment Value by Quarter, Avg. Clearance Time by Status, and Total Cases by Month.
Total Duty Amount by Year supports long-term review of customs duty handled by the agency. Total Shipment Value by Quarter helps managers compare seasonal or quarterly workload. Avg. Clearance Time by Status highlights where cases remain slow. Total Cases by Month gives a clean monthly case volume trend.
Customs Clearance Agencies Dashboard in Excel.
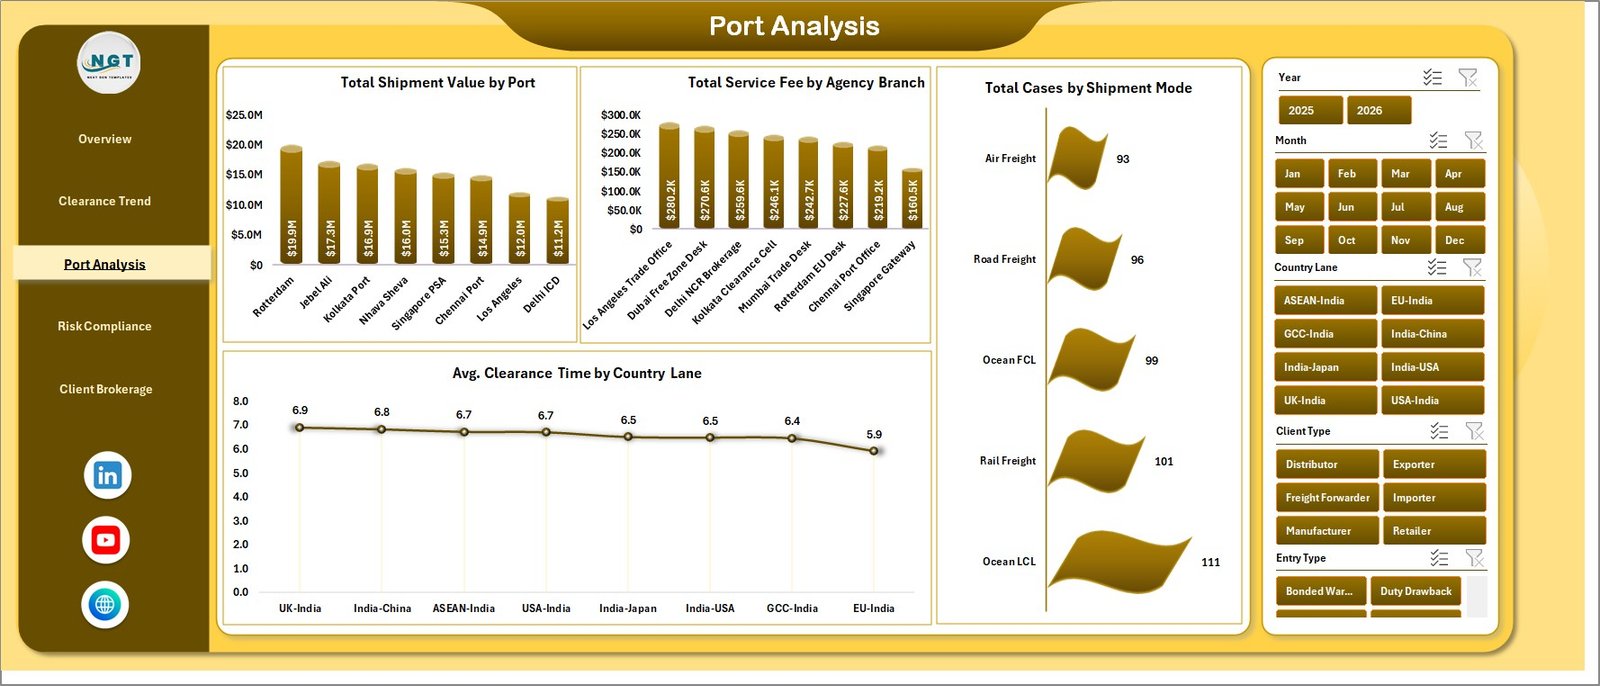
3. Port Analysis
The Port Analysis page explains where customs activity is concentrated by port, agency branch, shipment mode, and country lane. This is useful for operational managers who need to compare location-level and mode-level performance.
Total Shipment Value by Port identifies ports handling the highest-value shipments. Total Service Fee by Agency Branch compares branch-level revenue contribution. Total Cases by Shipment Mode shows whether air, sea, road, or rail shipments dominate case volume. Avg. Clearance Time by Country Lane helps teams review lane-specific delays.
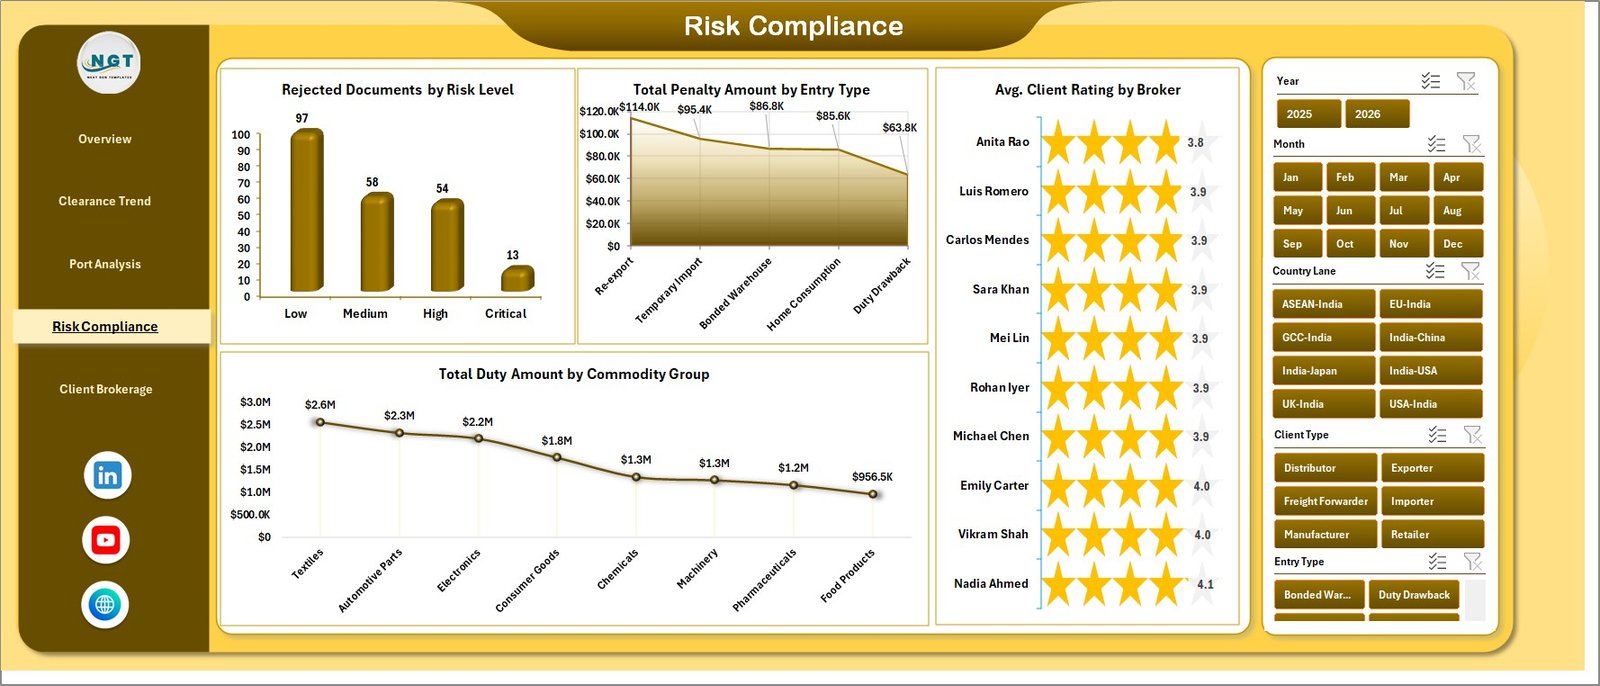
4. Risk Compliance
The Risk Compliance page connects documentation quality, risk level, penalties, brokers, and commodity groups. This page is especially useful for compliance reviews and process improvement meetings.
Rejected Documents by Risk Level helps identify whether document rejection is concentrated in high-risk cases. Total Penalty Amount by Entry Type shows which entry categories create the most penalty exposure. Avg. Client Rating by Broker compares client satisfaction across brokers. Total Duty Amount by Commodity Group supports tariff and commodity-level analysis.
Customs Clearance Agencies Dashboard in Excel.
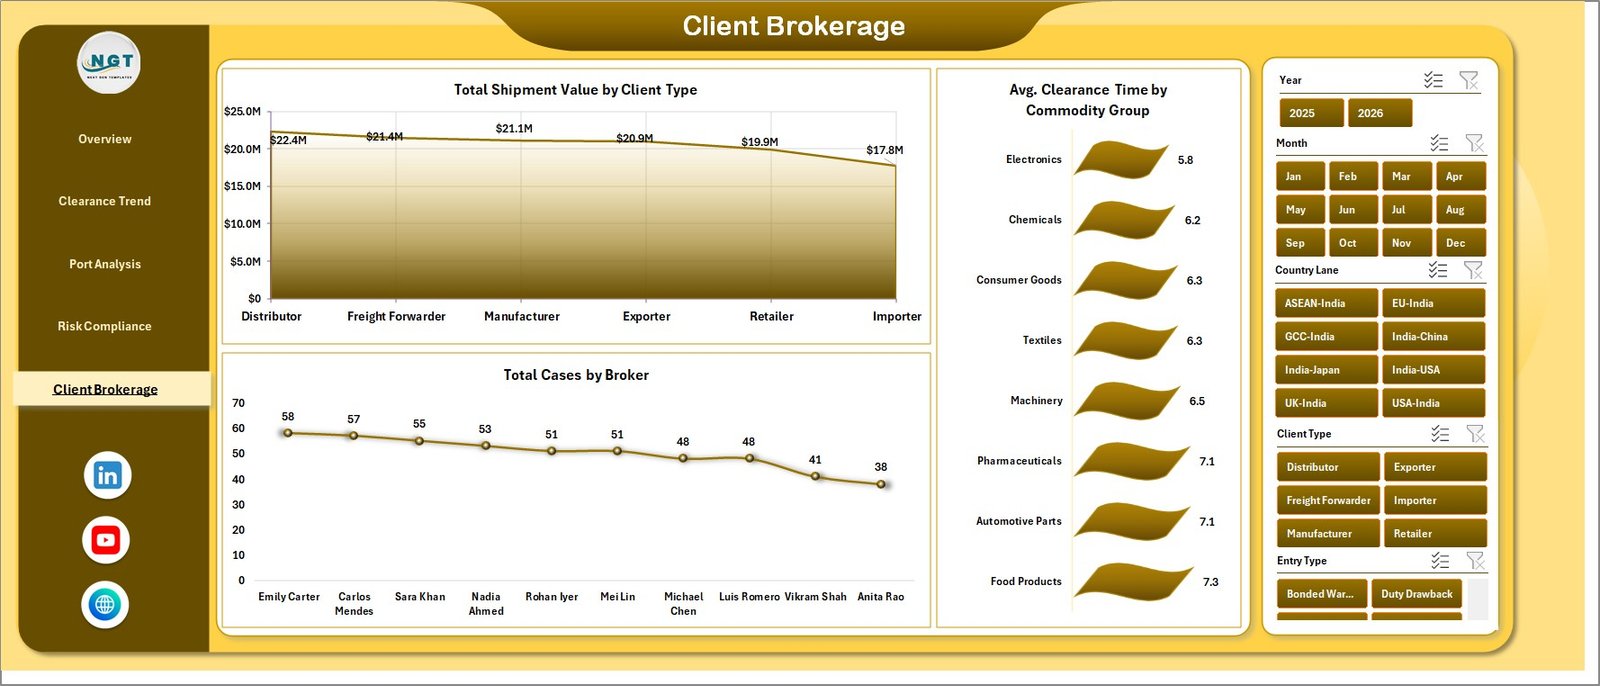
5. Client Brokerage
The Client Brokerage page focuses on client type, broker workload, and commodity processing speed. It helps agency leaders understand where value comes from and how work is distributed across brokers.
Total Shipment Value by Client Type shows which client groups contribute the most shipment value. Total Cases by Broker compares broker workload and can reveal capacity imbalance. Avg. Clearance Time by Commodity Group highlights commodity categories that need closer documentation, valuation, or compliance review.
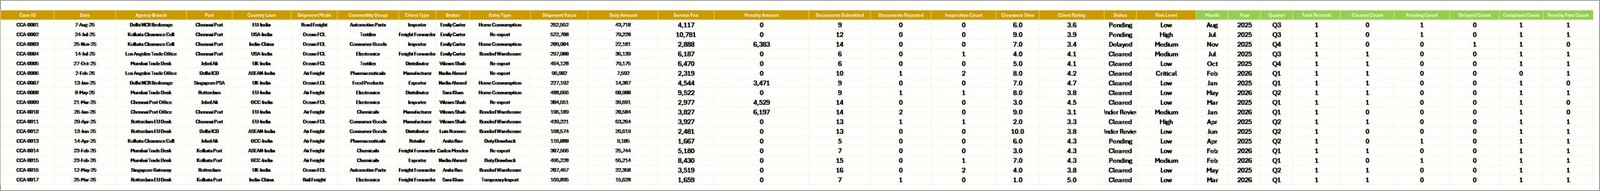
6. Data Sheet Tab
The Data Sheet stores the customs clearance records used by the dashboard. Add your own records in the same format, keep the column structure consistent, and then refresh the workbook.
7. Support Sheet
The Support Sheet contains the pivot tables used to create the dashboard dynamically. After updating the Data Sheet, go to the Data tab in the Excel Ribbon and click Refresh All. All pivot tables and charts refresh together. You can keep this sheet hidden when sharing the workbook with end users.
Customs Clearance Agencies Dashboard in Excel vs. Google Sheets vs. Paid Logistics SaaS – Feature Comparison
| Feature | Customs Clearance Agencies Dashboard in Excel | Google Sheets Alternative | Paid Logistics SaaS |
|---|---|---|---|
| Cost | $17.99 one-time purchase | Low cost, browser based | Monthly or annual subscription |
| Platform | Microsoft Excel | Google Sheets | Vendor cloud platform |
| Setup time | Update data and refresh | Copy sheet and configure sharing | Implementation, onboarding, and user setup |
| Real-time team collaboration | Possible through OneDrive or SharePoint | Built in | Usually included |
| Mobile access | Limited through Excel mobile | Browser and mobile app | Usually included |
| Customizable fields | Fully editable workbook | Editable sheet | Depends on vendor plan |
| Share with link | Possible through OneDrive or SharePoint | Yes | Yes |
| Year-1 cost at 5 users | $17.99 total | Usually low | Often hundreds or thousands of dollars |
| Customs clearance metrics included | Yes, pre-built pages and charts | Manual setup needed | May require configuration |
Who Should Use This Template
This dashboard is ideal for customs clearance agencies, customs brokers, freight forwarders, import-export departments, trade compliance teams, brokerage branch managers, finance analysts, and operations leaders who need repeatable reporting in Excel.
It is not a replacement for customs declaration software, government e-filing portals, live shipment tracking APIs, or automated customs classification tools. It works best as a management reporting layer for exported customs, brokerage, and clearance records.
Real-World Use Cases
Daily operations review: A brokerage manager opens the Overview page every morning to review cases by status, average clearance time, and pending high-risk inspections before assigning follow-ups.
Compliance improvement: A trade compliance lead uses the Risk Compliance page to monitor rejected documents by risk level and penalty amount by entry type, then identifies training topics for documentation teams.
Branch performance meeting: A regional manager compares Total Service Fee by Agency Branch and Total Shipment Value by Port before monthly branch reviews.
Advantages of Customs Clearance Agencies Dashboard in Excel
- It turns customs clearance records into management-ready visuals without starting from a blank workbook.
- The pages separate executive overview, trend review, port analysis, compliance review, and client brokerage analysis.
- Excel slicers make it easy to filter during meetings.
- The workbook can be edited for local customs terminology, branch names, broker names, ports, and commodity groups.
- The pivot-driven structure keeps refresh simple for non-technical users.
Opportunities for Improvement
This dashboard is refresh-based, so it does not replace real-time customs filing systems or live shipment tracking tools. Teams with very large datasets may want to connect Excel to Power Query, SharePoint, SQL, or another governed data source. Microsoft explains workbook refresh behavior here: Refresh an external data connection in Excel.
Best Practices
- Keep one clean row per clearance case in the Data Sheet.
- Standardize broker names, ports, country lanes, status values, and commodity groups before refresh.
- Review high-risk cases and rejected documents weekly.
- Use the same status names every month so trend charts remain clean.
- Hide the Support Sheet before sending the workbook to non-technical reviewers.
- Save a month-end copy before replacing the next month of data.
Explore Relevant Templates
You can download this product here: Customs Clearance Agencies Dashboard in Excel. You may also like Trucking and Logistics Dashboard in Excel, Cryogenics Dashboard in Excel, and Warehouse Efficiency Dashboard in Google Sheets.
Frequently Asked Questions
What does the Customs Clearance Agencies Dashboard in Excel track?
It tracks shipment value, duty amount, service fees, penalties, clearance time, inspections, case status, ports, branches, brokers, country lanes, client types, and commodity groups.
Does this dashboard require macros?
No. The workbook uses Excel tables, pivot tables, slicers, and charts. You only need to update data and refresh the workbook.
Can I replace the sample data with my own records?
Yes. Replace the sample records in the Data Sheet while keeping the same column structure, then click Refresh All.
Can I customize the dashboard?
Yes. You can edit charts, colors, slicers, headings, input fields, and worksheet names to match your customs agency workflow.
Which Excel version is recommended?
Microsoft Excel 2016 or later is recommended, including Microsoft 365, for the best pivot chart and slicer experience.
Is this a live customs filing system?
No. This is an analytics dashboard for reporting and review. It does not submit declarations or connect automatically to government customs systems.
About the Author
Built by PK – Microsoft Certified Professional with 15+ years of Excel, Google Sheets, and Power BI experience. Founder of NextGenTemplates, reaching 300K+ subscribers across YouTube channels. Every template is hand-built and tested before release.
Conclusion
The Customs Clearance Agencies Dashboard in Excel helps customs agencies and brokerage teams turn clearance records into a practical reporting workbook. With 5 dashboard pages, KPI cards, slicers, charts, a Data Sheet, and a Support Sheet, the template gives managers a faster way to review duties, fees, penalties, risk, broker workload, ports, clients, and clearance time.
Click here to purchase the Customs Clearance Agencies Dashboard in Excel
Instant download. One-time payment. No subscription. Lifetime access.
Last updated: May 24, 2026
Visit our YouTube channel for step-by-step video tutorials: YouTube.com/@PK-AnExcelExpert
Customs Clearance Agencies Dashboard in Excel.