The Cannabis Dispensary Dashboard in Power BI is a 5-page .pbix template that tracks 5 headline KPIs (Total Transactions, Total Revenue, Total Cost, Net Profit, Avg Basket Size) and 13 supporting visuals built specifically for cannabis dispensary operators. Replace the sample data with your POS export and every page refreshes in under 10 minutes — no DAX rewriting, no SaaS subscription.
Cannabis retail in the US is a $32B+ industry that runs on transaction-level data — strain, budtender, payment method, and location all matter. Most dispensary operators either pay $300-$1,500 per month per location for vendor analytics like Headset or Flowhub, or they spend weeks asking an analyst to rebuild the same charts in Tableau. This template is the third option: a one-time-purchase Power BI report that any operator can open, refresh, and edit.
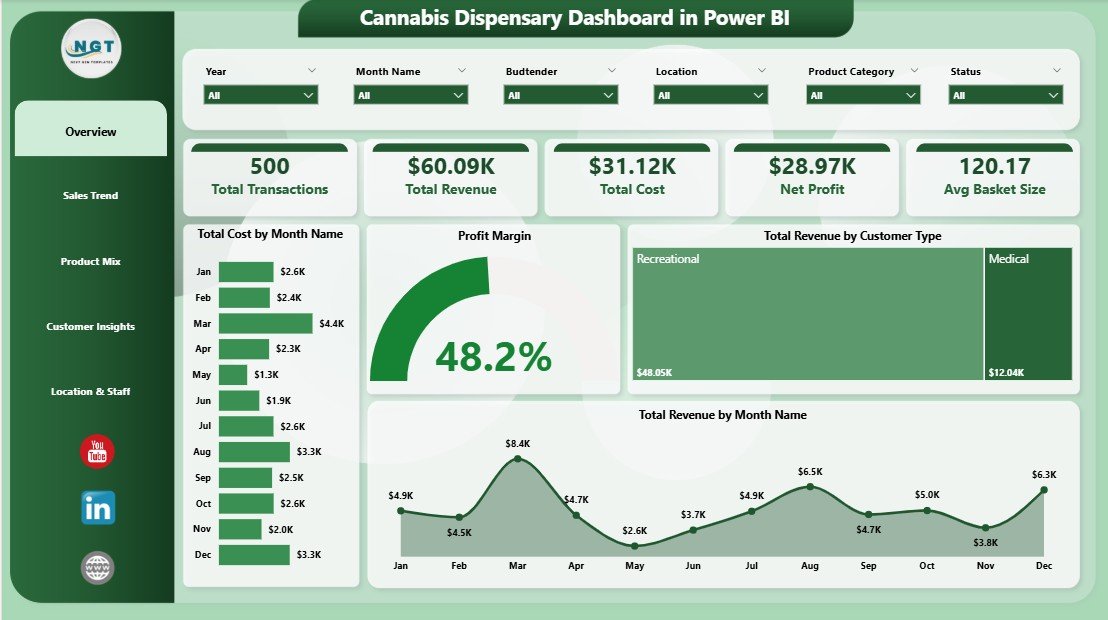
Cannabis Dispensary Dashboard in Power BI — Overview Page
Key Features of the Cannabis Dispensary Dashboard in Power BI
This template was built around the questions dispensary owners actually ask in weekly performance meetings — not the questions enterprise BI consultants assume retailers care about. Here are the core capabilities you get inside the .pbix file.
📊 5 Interactive Report Pages — Overview, Sales Trend, Product Mix, Customer Insights, and Location & Staff. Each page is single-purpose and uses the same underlying data model.
🌿 Strain-Level Profitability — Indica, Sativa, Hybrid, and CBD revenue and margin views answer the question every cannabis buyer asks: which strain category to stock more of next month.
👥 Budtender Performance — Avg Basket Size by Budtender and Total Revenue by Budtender visuals identify your top earners and your training opportunities, with no separate HR reporting needed.
🏪 Multi-Location Comparison — Operators running 2-10 stores see Total Revenue by Location and Profit Margin by Location side-by-side. The slicer-driven design means you do not need to rebuild the report when you open a new store.
💳 Payment Method Analytics — Cash vs. debit vs. ACH vs. third-party processor split, plus margin impact, which is uniquely important in a cash-heavy regulated industry where banking fees compound quickly.
🔄 Slicer-Driven Filtering — Filter every page by date range, customer type (Medical / Recreational / New / Returning), location, payment method, or strain type. Slicers persist across pages.
📥 Plug-and-Play Data Model — The Transform Data step is pre-mapped for a flat transaction-level table. Replace the sample CSV with a Dutchie, Treez, Cova, or Flowhub export and click Refresh.
Dashboard Pages Explanation
Below is a page-by-page walkthrough of every report page and what each visual is built to answer.
1. Overview Page
The Overview page is the executive summary every dispensary GM opens first. Five KPI cards across the top show Total Transactions, Total Revenue, Total Cost, Net Profit, and Avg Basket Size. Underneath, slicers let you filter by date, location, customer type, and strain.
📈 Total Cost by Month Name — Monthly COGS trend, useful for spotting inventory build spikes around 4/20 or holiday promotions.
📊 Profit Margin — The headline margin number every owner watches first.
👥 Total Revenue by Customer Type — Revenue split between New, Returning, Medical, and Recreational customers — the segmentation cut that drives marketing decisions.
📅 Total Revenue by Month Name — Month-over-month revenue line that pairs with the cost chart for an instant margin-direction read.
2. Sales Trend
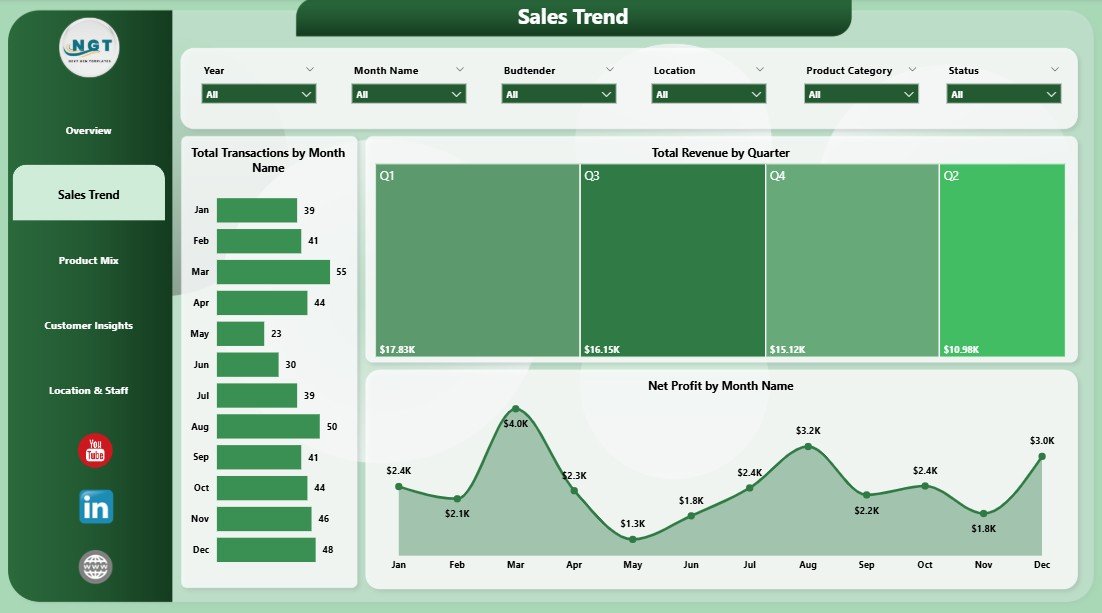
Sales Trend
The Sales Trend page is for finance leads who need to spot momentum and seasonality. Cannabis sales have predictable cycles — 4/20, Green Wednesday, the December holidays — and this page shows whether your store is participating in them.
📊 Total Transactions by Month Name — Volume trend that separates ‘more visits’ growth from ‘bigger basket’ growth.
💵 Total Revenue by Quarter — Quarterly view that lines up with regulatory reporting cycles in most legal states.
📉 Net Profit by Month Name — Bottom-line trend, useful for catching margin compression early before it shows up in the bank account.
3. Product Mix
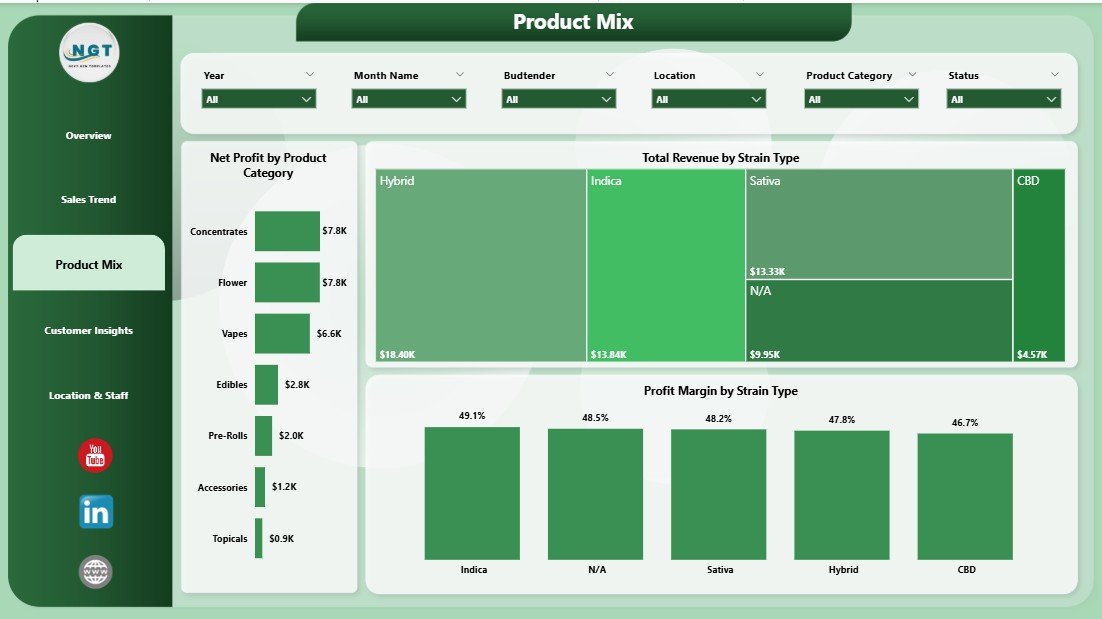
Product Mix
The Product Mix page is built for buyers and category managers deciding what to stock more of next week. Cannabis retail margins shift dramatically across categories, and revenue alone is a misleading guide.
🌿 Net Profit by Product Category — Compares Flower, Edibles, Pre-Rolls, Concentrates, Vapes, and Accessories on bottom-line contribution rather than top-line revenue.
🌱 Total Revenue by Strain Type — Indica vs. Sativa vs. Hybrid vs. CBD revenue split, which tracks consumer mood and seasonality.
📐 Profit Margin by Strain Type — Often surprising: the strain category with the most revenue is rarely the one with the highest margin.
4. Customer Insights
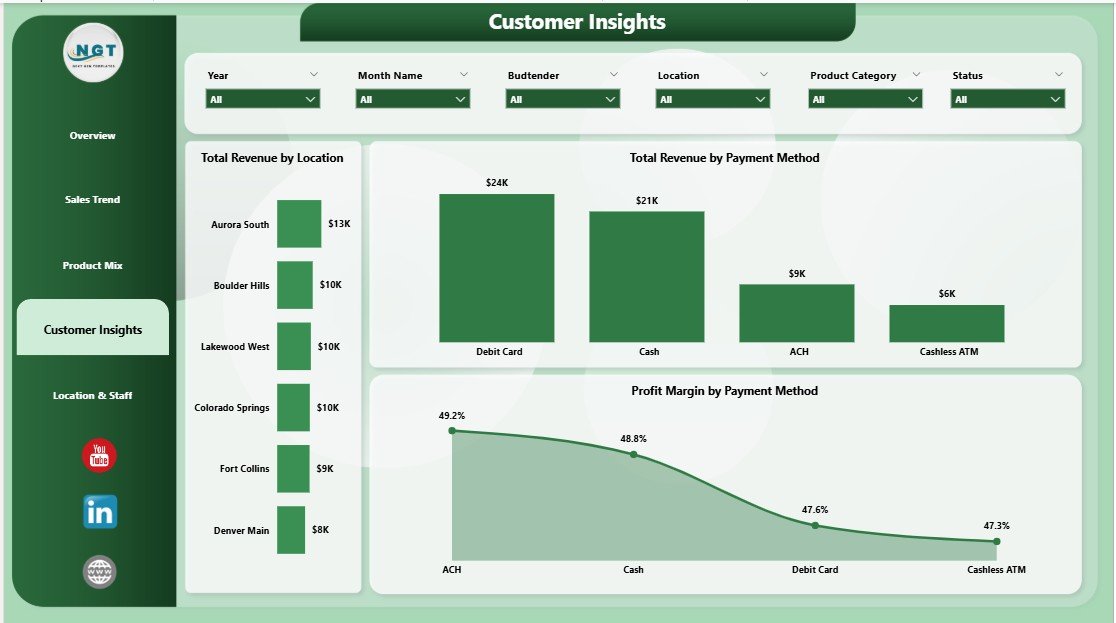
Customer Insights
This page connects geography and payment behavior to the customer base. For multi-store operators, it is the page that gets shared in the weekly GM call.
🗺️ Total Revenue by Location — Store-by-store revenue ranking that surfaces underperforming locations quickly.
💳 Total Revenue by Payment Method — Cash vs. debit vs. ACH vs. cashless ATM split, important in a regulated industry where banking access is uneven.
📊 Profit Margin by Payment Method — Highlights which payment channels eat the most margin once processing fees are included — often a 3-5 point delta between cash and cashless ATM.
5. Location & Staff
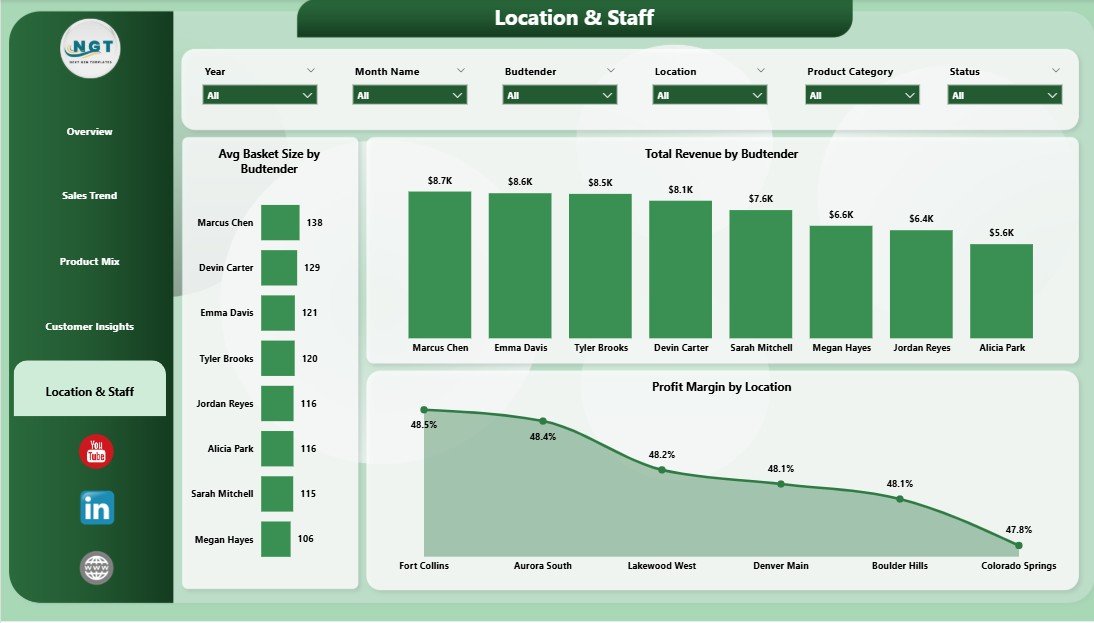
Location & Staff
The final page is built for store managers and HR / training leads. Budtenders are the single biggest variable in dispensary basket size, and this page is built around that fact.
🛒 Avg Basket Size by Budtender — The single best leading indicator of who is upselling effectively. Top performers should train new hires.
💼 Total Revenue by Budtender — Revenue contribution by staff for performance reviews and incentive plans.
🏪 Profit Margin by Location — Margin comparison across stores that often reveals rent, staffing, or local pricing pressure invisible at the revenue level.
Cannabis Dispensary Dashboard in Power BI vs. Tableau / Qlik vs. Paid Cannabis BI Tools — Feature Comparison
| Feature | Cannabis Dispensary Dashboard in Power BI | Tableau / Qlik Custom Build | Headset / Flowhub Analytics |
|---|---|---|---|
| Cost | $17.99 one-time | $70/user/month + build cost | $300-1,500/month per location |
| Platform | Power BI Desktop (free) | Tableau / Qlik Sense | Vendor-locked SaaS |
| Setup time | Under 10 minutes | 2-6 weeks dev | 1-2 weeks onboarding |
| Strain & budtender views | ✅ Pre-built | ❌ Build from scratch | ✅ But locked to vendor data |
| Customizable DAX & visuals | ✅ Full edit | ✅ Full edit | ❌ Vendor templates only |
| Works with any POS export | ✅ CSV/Excel | ✅ But needs ETL | ❌ Pre-integrated POS only |
| Mobile / web sharing | ✅ Power BI Service | ✅ | ✅ |
| Year-1 cost at 5 users | $17.99 total | $4,200+ | $3,600-$18,000 |
For dispensary operators who want strain-level and budtender-level analytics without paying $300+ per month per store, the Cannabis Dispensary Dashboard in Power BI sits in the sweet spot.
Who Should Use This Template
✅ Perfect for:
- Single-store dispensary owners exporting from Dutchie, Treez, Cova, or Flowhub
- Multi-location cannabis chains running 2-10 stores who need side-by-side store comparisons
- Cannabis CFOs and bookkeepers preparing monthly P&L and IRC 280E-aware margin reports
- Cannabis consultants who need a polished, brandable client deliverable
- Dispensary general managers running weekly performance reviews with budtender teams
❌ Not a fit if:
- You need real-time POS-integrated dashboards — this is refresh-based, not live-streaming
- You run cultivation or processing only — the data model is dispensary-side
- You do not have access to Power BI Desktop (free, but Windows-only)
- You need METRC seed-to-sale traceability — that is a separate compliance system
Real-World Use Cases
Marcus owns a single-store dispensary in Denver. Every Monday at 8 AM he opens the Cannabis Dispensary Dashboard in Power BI to review the previous week — Total Revenue by Day, Avg Basket Size by Budtender, and Profit Margin by Strain Type. Before this template, he was paying $349 per month for a third-party analytics SaaS that took 8-10 days to onboard. The .pbix refresh worked the first time.
Lena runs operations for a 4-store cannabis chain in Michigan. She uses the Profit Margin by Location and Total Revenue by Location visuals to run her weekly call with store GMs. The slicer-based design lets her drill into a single store without rebuilding the report — a workflow that used to take her data analyst 90 minutes per week in Tableau.
Devon is an independent cannabis consultant. He delivers this template to retail clients with their data already loaded, charges a setup fee, and uses the time he used to spend rebuilding Tableau dashboards on actual margin work. He has shipped the template to 6 clients in the past quarter.
Advantages of the Cannabis Dispensary Dashboard in Power BI
💰 One-time $17.99 vs. $300+/month subscriptions — Year-one savings exceed $3,500 per location compared to mid-tier vendor analytics like Headset or Flowhub Analytics.
⏱️ Under 10 minutes to first refresh — Most operators can connect their POS export, refresh, and start reading insights in a single coffee break.
🔓 Fully editable .pbix — No locked visuals, no licensed components. You can edit DAX, swap charts, add pages, and rebrand for client work.
🏪 Designed for cannabis specifically — Strain Type, Budtender, and Customer Type (Medical / Recreational) are first-class dimensions, not generic retail fields.
📱 Publish anywhere — Share read-only links via Power BI Service, embed in SharePoint, or email PNG exports to investors.
Opportunities for Improvement
This template is a starting point, not a sealed product. A few honest limitations worth knowing before you buy.
🔌 Not real-time — Data updates only when you click Refresh. If you need live POS streaming, you will need a paid integration like Headset.
🪟 Power BI Desktop is Windows-only — Mac users can publish to and view Power BI Service in a browser, but cannot edit the .pbix file natively.
📋 METRC compliance is separate — This is a management dashboard, not a regulatory traceability system. Pair it with your METRC reporting tool.
📊 Sample data is generic — The shipped sample data is illustrative, not benchmarked against your specific state’s market.
Best Practices
1️⃣ Set up a weekly refresh cadence — Pick a fixed day (Monday morning works well) and refresh against the prior week’s POS export. Consistency makes trends readable.
2️⃣ Compare like-for-like across stores — When using Profit Margin by Location, make sure your COGS allocation method is consistent across stores. Inconsistent allocation makes the visual misleading.
3️⃣ Use the budtender view in 1:1s, not group meetings — Avg Basket Size by Budtender is a coaching tool. Surfacing it in front of the full team can create unnecessary friction.
4️⃣ Publish to Power BI Service for stakeholders — Read-only sharing via the free Power BI sharing options avoids emailing PDFs.
5️⃣ Annotate before sharing externally — Investors and lenders appreciate a sentence explaining what each KPI means, particularly for non-cannabis-savvy readers.
Explore Relevant Templates
🌿 Cross-platform sibling: Cannabis Dispensary Dashboard in Excel — same KPIs and pages in a native pivot-table workflow for teams that prefer Excel.
📊 Browse all Power BI Dashboard Templates on NextGenTemplates.
🎯 Other Power BI dashboards you may like:
- Museum Dashboard in Power BI — visitor and revenue analytics for cultural venues.
- Oil and Gas Analysis Dashboard in Power BI — operational analytics for energy operators.
- Subscription Box Dashboard in Power BI — subscriber retention and MRR analytics.
- Yoga Wellness Studio Dashboard in Power BI — small-format retail wellness analytics.
Frequently Asked Questions
What KPIs does the Cannabis Dispensary Dashboard in Power BI track?
The Cannabis Dispensary Dashboard in Power BI tracks 5 headline KPIs — Total Transactions, Total Revenue, Total Cost, Net Profit, and Avg Basket Size — plus 13 supporting visuals across strain type, customer type, location, payment method, and budtender. All metrics update automatically when you refresh the data source.
How does this compare to Headset or Flowhub Analytics?
Headset and Flowhub Analytics are vendor-locked SaaS subscriptions starting around $300 per month per location. The Cannabis Dispensary Dashboard in Power BI is a one-time $17.99 .pbix file that works with any POS export. You give up real-time streaming; you keep full DAX editability and avoid recurring fees.
How long does setup take?
Setup takes under 10 minutes for most users. You install Power BI Desktop (free), open the .pbix, point Transform Data at your POS export CSV, match the column names, and click Refresh. The Cannabis Dispensary Dashboard in Power BI ships with sample data so you can preview every page before connecting your own.
Will this work with Dutchie, Treez, Cova, or Flowhub data?
Yes — the Cannabis Dispensary Dashboard in Power BI accepts any flat CSV or Excel export with transaction-level data. As long as your POS lets you export sales by transaction with date, location, strain type, payment method, budtender, cost, and revenue columns, the model maps cleanly.
Can I customize the visuals or add new pages?
Yes — the file is a fully open .pbix with no locked elements. You can edit DAX measures, change colors, add new pages, swap visuals, and republish. The Cannabis Dispensary Dashboard in Power BI is a starting point, not a sealed product.
Do I need a Power BI Pro license?
No — Power BI Desktop is free and runs the entire Cannabis Dispensary Dashboard in Power BI locally. A Pro license ($14/user/month) is only required if you want to publish to Power BI Service and share interactive reports inside an organization.
Is this dashboard 280E-aware for cannabis tax reporting?
The Cannabis Dispensary Dashboard in Power BI separates Cost of Goods Sold from operating costs at the transaction level, which is the foundation for IRC 280E reporting. It is a management dashboard, not a tax filing — pair it with your CPA for actual return preparation.
About the Author
Built by PK — Microsoft Certified Professional with 15+ years of Excel, Google Sheets, and Power BI experience. Founder of NextGenTemplates, reaching 300K+ subscribers across YouTube channels (@PK-AnExcelExpert, @NextGenTemplates, @NeoTechNavigators). Every template is hand-built and tested before release.
Conclusion
Cannabis retail is a margin-tight, transaction-rich business that punishes operators who fly blind. The Cannabis Dispensary Dashboard in Power BI gives you the same five KPIs and thirteen visuals that paid SaaS platforms charge $300+ per month per store for, in a one-time-purchase .pbix file you can edit, rebrand, and refresh on your own schedule.
👉 Click here to Purchase the Cannabis Dispensary Dashboard in Power BI
✅ Instant download · One-time payment · No subscription · Lifetime access
🎥 For step-by-step video walkthroughs, visit YouTube.com/@PK-AnExcelExpert.
📅 Last updated: May 2026