Unveiling Excel’s Powerhouses: IF, IFS, SWITCH, VLOOKUP, and XLOOKUP
Excel is an incredibly powerful tool with a variety of functions to facilitate everyday tasks. Among its myriad capabilities, it shines in its capacity to handle complex data analysis and decision-making scenarios. For instance, in the academic realm, Excel can simplify the task of student grading using a range of formulae. Here, we will delve into the mechanisms of five key functions: IF, IFS, SWITCH, VLOOKUP, and XLOOKUP.
Grade Calculation – An Introduction to Our Case
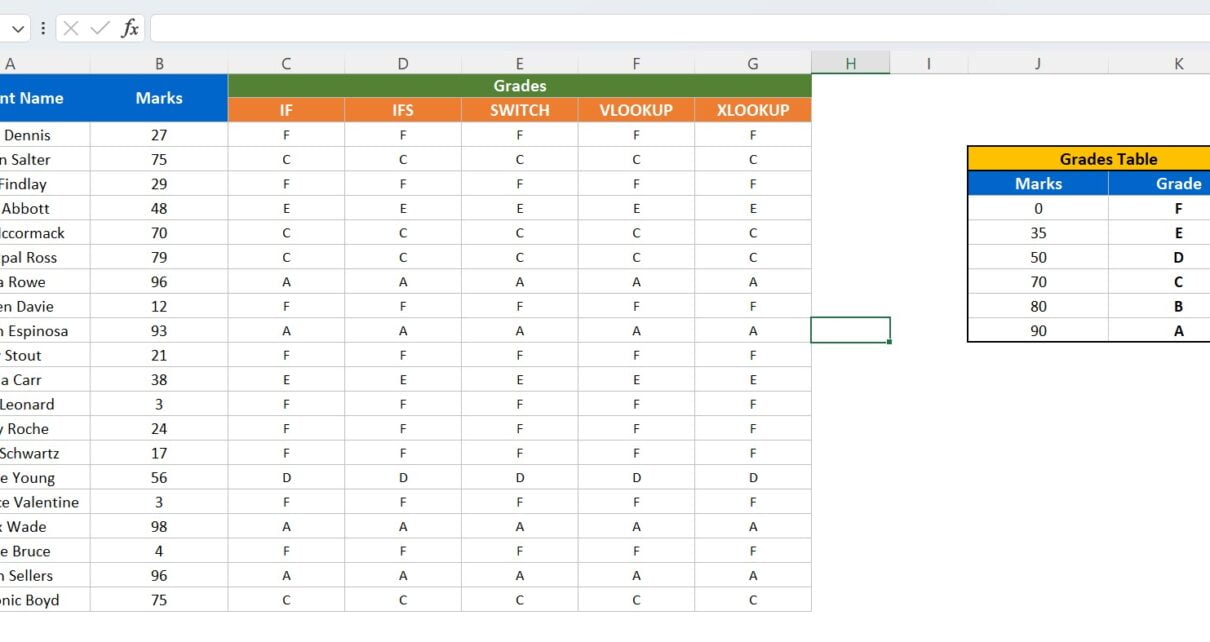
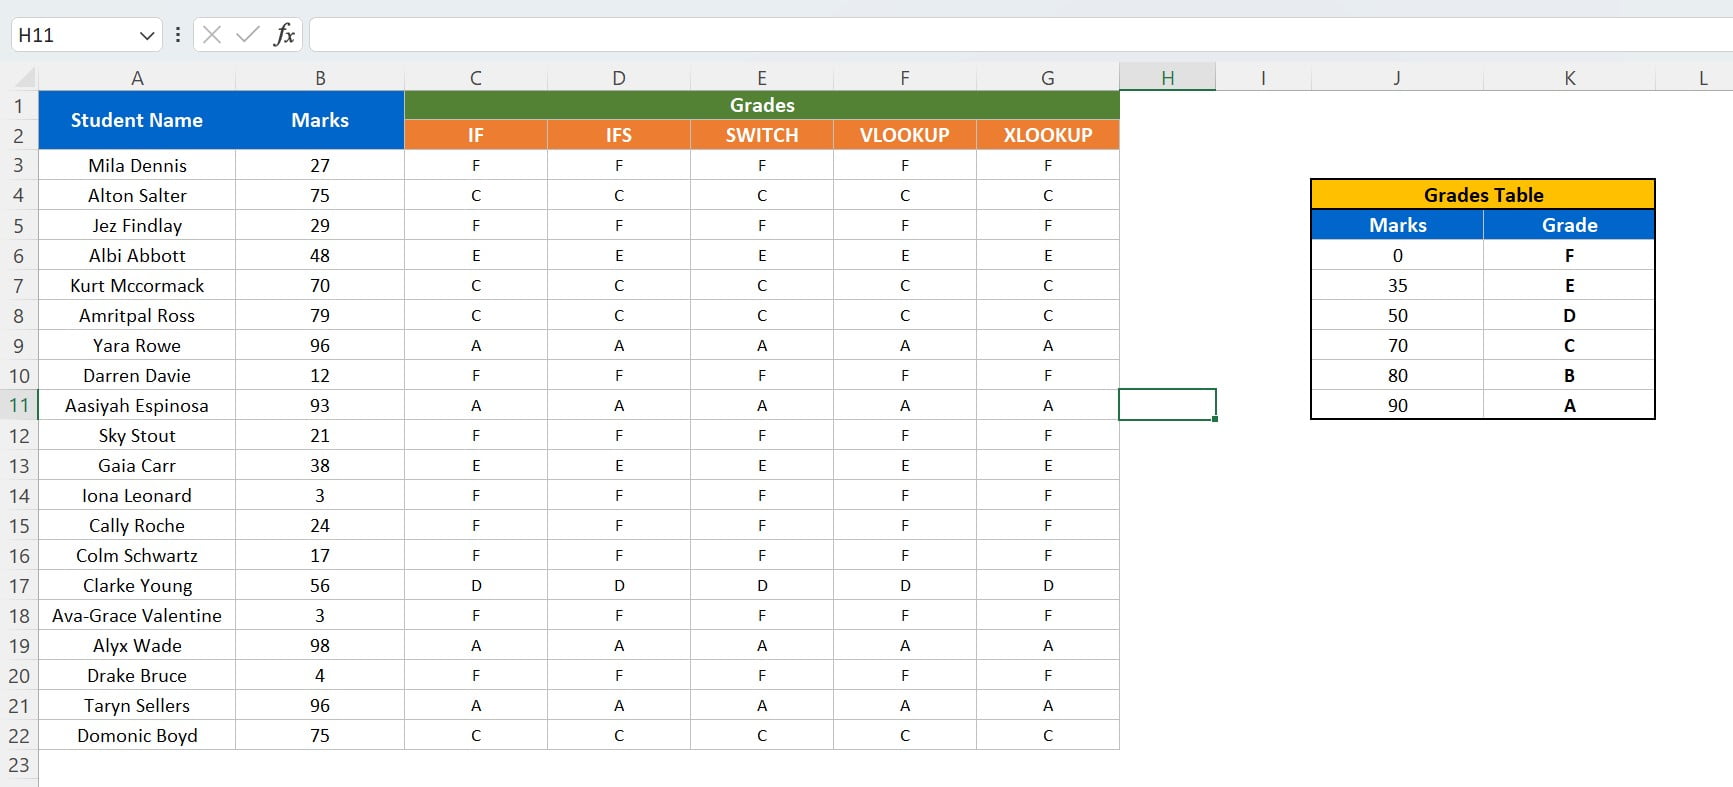
Before we dive into the intricacies of these functions, let’s get familiar with the data we’ll be working with. We’re handling student grades, distributed according to the following grading scheme:
A: 90 or above
B: 80 – 89
C: 70 – 79
D: 50 – 69
E: 35 – 49
F: Below 35
In our dataset, we have a column for student names and another for their corresponding marks. Our goal? Use our chosen functions to assign each student a grade based on this scheme.
Journey into Excel’s IF Function
The IF function is our first contender. Known for its simple yet effective logical tests, the IF function is your go-to when you’re dealing with binary scenarios – yes or no, true or false.
IF Formula in Action
To assign grades using the IF function, we used a nested IF formula:
=IF(B3<35,"F",IF(B3<50,"E",IF(B3<70,"D",IF(B3<80,"C",IF(B3<90,"B","A")))))
This formula is essentially a chain of logical checks. It examines if the student’s marks are less than a certain threshold, starting from 35. Depending on the first condition that proves true, it assigns the corresponding grade. If none of the conditions are met, it defaults to assigning an ‘A’, implying that the student scored 90 or above.
Excel’s IFS Function – Handling Multiple Conditions with Ease
Next, we have the IFS function. An upgrade to the IF function, IFS is designed to handle multiple conditions without requiring nested functions.
Applying the IFS Formula
For our grading scheme, the IFS function simplifies the task considerably:
=IFS(B3<35,"F",B3<50,"E",B3<70,"D",B3<80,"C",B3<90,"B",TRUE,"A")
Like the IF function, IFS checks for conditions starting from a score below 35. The main difference? If a condition is met, the function immediately returns the corresponding grade. The TRUE argument at the end serves as a catch-all, assigning an ‘A’ grade if none of the preceding conditions are met.
Embracing the Excel SWITCH Function
The SWITCH function is a robust alternative for handling multiple criteria. In this context, we can leverage the SWITCH function to streamline the grade assignment process.
SWITCH Function at Work
The SWITCH function we used for our grading scheme is as follows:
=SWITCH(TRUE,B3<35,"F",B3<50,"E",B3<70,"D",B3<80,"C",B3<90,"B","A")
Like IFS, SWITCH evaluates conditions from top to bottom and returns the first matching result. Here, it checks if the marks are less than a certain value. If a condition is true, it assigns the respective grade. If no conditions are met, it defaults to an ‘A’ grade.
Discovering VLOOKUP
VLOOKUP is an indispensable function in Excel, used for searching and retrieving data from a specific column in a table. Let’s see how this applies to our grade assignment scenario.
The Power of VLOOKUP Formula
To utilize VLOOKUP for our grading, we constructed the following formula:
=VLOOKUP(B3,$J$6:$K$11,2,1)
This formula looks for the student’s score in the leftmost column of the defined range, then returns the grade from the second column. The ‘1’ at the end is for approximate matching, ensuring VLOOKUP assigns the correct grade even if the exact score isn’t in our grading table.
Exploring XLOOKUP
Finally, we have XLOOKUP – the newer, more flexible replacement for VLOOKUP. Let’s see how it fares with our grading scheme.
XLOOKUP Formula Unleashed
In our grading scenario, the XLOOKUP formula reads:
=XLOOKUP(B3,$J$6:$J$11,$K$6:$K$11,,-1)
XLOOKUP looks for a student’s score in our defined range and returns the corresponding grade. The ‘-1’ indicates an exact match or the next smaller value, providing a more accurate result than VLOOKUP when the exact score isn’t listed in our grade range.
Advantages of Excel in Grading
Excel, when wielded correctly, can be an exceptional tool for educators in the grading process. It offers a multitude of benefits, such as:
Streamlining Grade Calculations
Harnessing functions like IF, IFS, SWITCH, VLOOKUP, and XLOOKUP in Excel can simplify grade calculations significantly. These formulas automate the process, reducing potential errors and saving valuable time.
Facilitating In-depth Analysis
Excel doesn’t just aid in grade calculations. It also allows educators to perform a deep analysis of student performance. By identifying patterns in student grades, educators can tailor teaching methods to improve outcomes.
Encouraging Data Consistency
By utilizing Excel for grading, you can ensure consistency across assessments. This eliminates discrepancies and promotes fair and balanced grading.
Opportunities for Improvement
As versatile as Excel is, there’s always room for enhancement. Here are some areas that could benefit from improvement:
Making Complex Functions More User-friendly
Excel’s power lies in its complex functions. However, these can be intimidating for beginners. Efforts to make such functions more intuitive would improve user experience significantly.
Enhancing Error and Exception Handling
While Excel handles standard errors well, its response to unanticipated errors or exceptions could use refinement. An intelligent error response system could make troubleshooting easier for users.
Integrating AI-Powered Data Analysis
As the world moves towards AI, integrating AI-powered data analysis could boost Excel’s data handling capabilities. This could take Excel’s functionality in grading to the next level.
Best Practices for Grading with Excel
As with any tool, knowing how to use Excel properly is key. Here are some best practices for grading with Excel:
Ensuring Data Consistency
To get accurate results, it’s essential to maintain data consistency. Ensure your data is formatted consistently throughout your Excel sheet.
Understanding Function Intricacies
Excel’s functions, like IF, IFS, SWITCH, VLOOKUP, and XLOOKUP, have unique strengths. Understanding these can help you choose the most suitable function for your grading needs.
Regular Data Backups
Prevent data loss by regularly updating and backing up your data. This ensures that you have access to your grading data when you need it.
Remember, Excel is a powerful ally in the grading process. When utilized properly, it can make the task of student assessment efficient, accurate, and insightful.
Frequently Asked Questions
Q: Can I use these functions with other grading schemes?
A: Absolutely! IF, IFS, SWITCH, VLOOKUP, and XLOOKUP are versatile functions that can handle different grading systems.
Q: Which function is the best for grade calculations?
A: It depends on your proficiency with Excel and the complexity of your grading scheme. Each function has its strengths and is best suited for certain scenarios.
Q: Can these functions handle grades represented by percentages?
A: Yes, these functions can be adapted to handle any range of numerical data, including percentages.
Conclusion
In drawing our discussion to a close, it is clear to see that Excel indeed presents a diverse arsenal of potent tools specifically tailored for grading, each boasting its own unique capabilities. Armed with a deep understanding of these distinct functions, educators, without a doubt, can significantly streamline the grading process. Consequently, this makes the often tedious task not only more efficient but also strikingly accurate.
Visit our YouTube channel to learn step-by-step video tutorials
Watch the step-by-step video tutorial: