Introduction
In an era where data is king, it’s crucial to have efficient tools that help businesses draw insightful conclusions from their data. One such tool is Power BI, a potent business analytics service provided by Microsoft. It offers interactive visualizations with self-service business intelligence capabilities, making it an ideal tool for creating comprehensive dashboards. In this article, we will dive deep into the potential of Power BI by exploring an Amazon Product Review Dashboard.
What is Power BI?
Power BI is a collection of software services, apps, and connectors that work together to turn unrelated sources of data into coherent, visually immersive, and interactive insights. It is used to create reports and dashboards, providing a 360-degree view of the most critical business data. Power BI dashboards are collections of visuals, reports, and other data that provide a consolidated view of business data.
See the below live dashboard-
Click to buy Product Review Dashboard in Power BI
Why Power BI Dashboards?
Power BI dashboards are not just about delivering information; they’re about delivering the right information to the right people at the right time. Here are some reasons why businesses should consider using Power BI dashboards:
Interactive Data Visualization:
Power BI provides interactive visualizations with self-service business intelligence capabilities, allowing end users to create reports and dashboards by themselves.
Efficient Reporting:
With Power BI, you can create quick insights from Excel, on-premises SQL Server, and cloud-based data sources such as Azure SQL Database, Salesforce, and more.
Real-time Data Analysis:
Power BI provides real-time data analysis so that your reports and dashboards are always up to date.
Easy Integration:
Power BI integrates easily with existing business environments, allowing you to adopt analytics and reporting capabilities.
Creating a Power BI Dashboard for Amazon Product Reviews
To illustrate the power and flexibility of Power BI, we’ve created an Amazon Product Review Dashboard. This dashboard provides an in-depth analysis of product reviews on Amazon, offering insights that could potentially help businesses improve their products, understand customer needs better, and strategize marketing initiatives.
The Structure of Amazon Product Review Dashboard
Our Power BI dashboard consists of four main pages, a hidden drill-through page, and a tooltip page. Each of these components serves a unique purpose and offers different insights into the data.
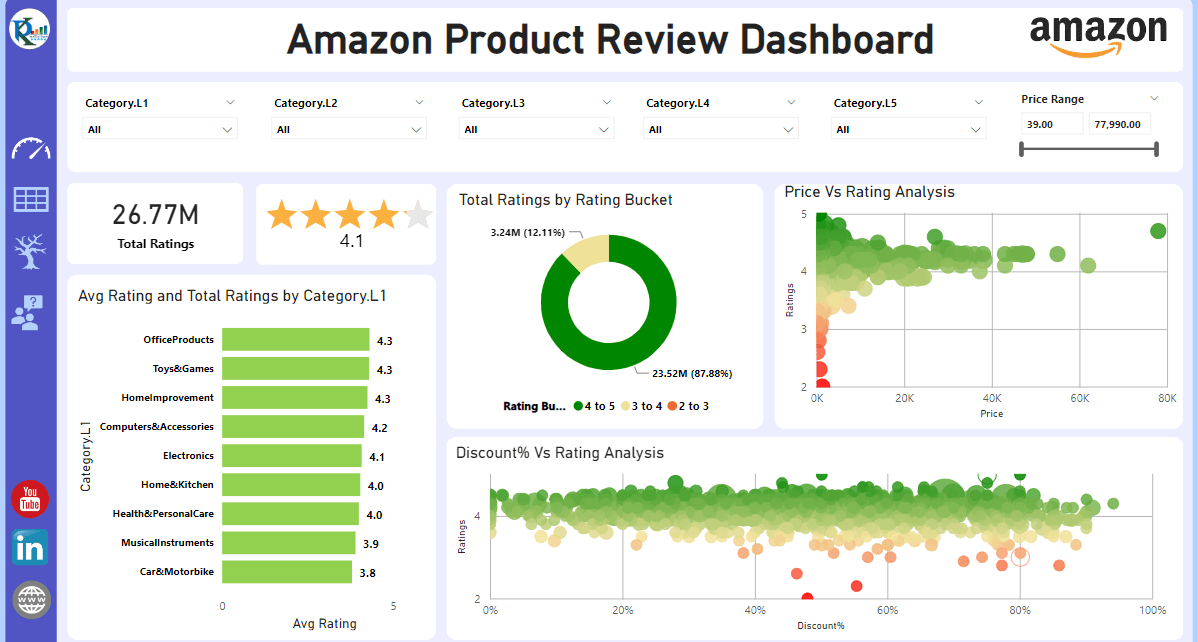
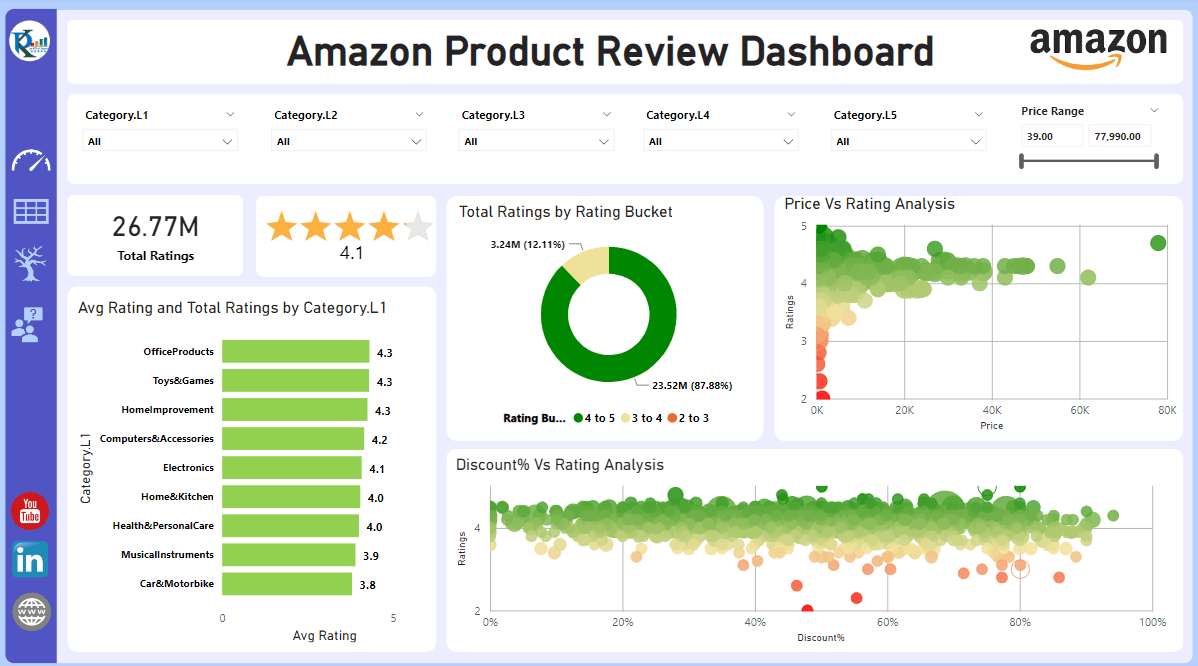
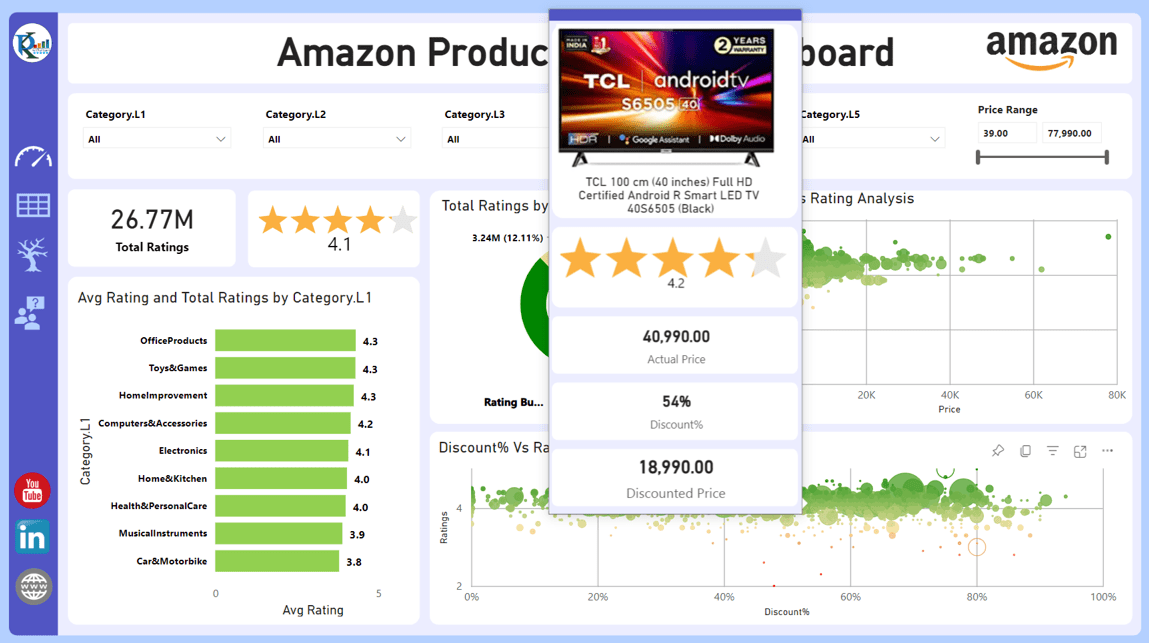
Summary Page:
Click to buy Product Review Dashboard in Power BI
The Summary Page presents an overview of Total Ratings Count and Average Rating. It displays the total rating count by rating bucket (1 to 2, 2 to 3, 3 to 4, and 4 to 5), providing insights into how customers perceive different products. The page also presents a Price Vs. Rating Analysis using a scatter chart and shows Average Ratings across different product categories. There’s also a Discount Vs. Rating Analysis, enabling businesses to understand how discounts affect customer ratings. The page is equipped with slicers on the top, allowing users to filter data based on specific categories or price ranges.
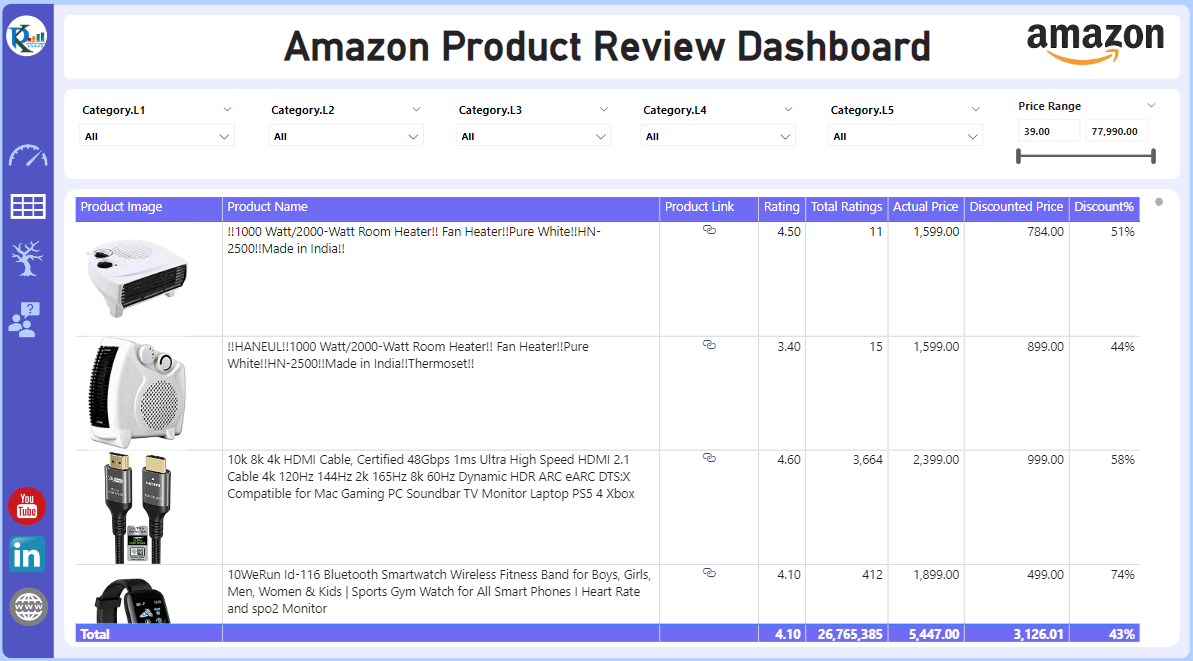
Product Table:
Click to buy Product Review Dashboard in Power BI
This page provides a tabular view of the products. It includes essential product details such as product image, product name, product link (which redirects to the Amazon website), rating, total ratings count, actual price, discount price, and discount percentage. Similar to the Summary Page, this page also has slicers on the top, allowing users to filter data based on specific categories or price ranges.
Decomposition Tree: Digging Deeper into Ratings
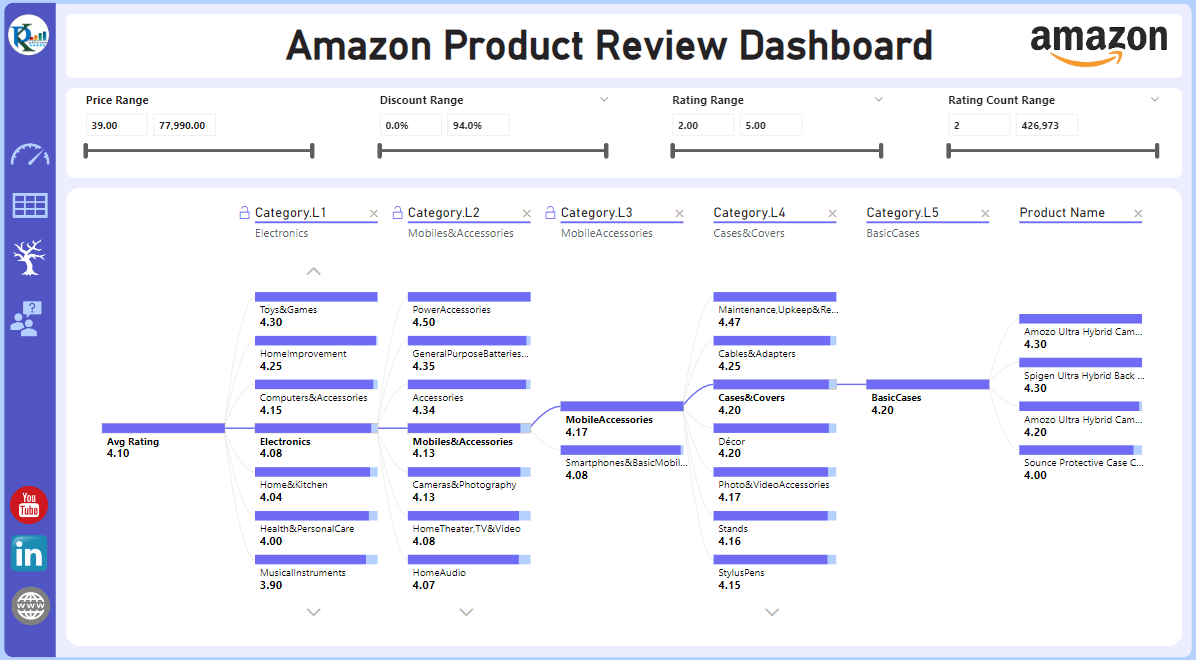
Click to buy Product Review Dashboard in Power BI
The Decomposition Tree page is an innovative tool that allows users to drill down the average rating across different categories. It includes multiple slicers such as price range, discount range, rating range, and rating count range.
Engage with Data via Q&A
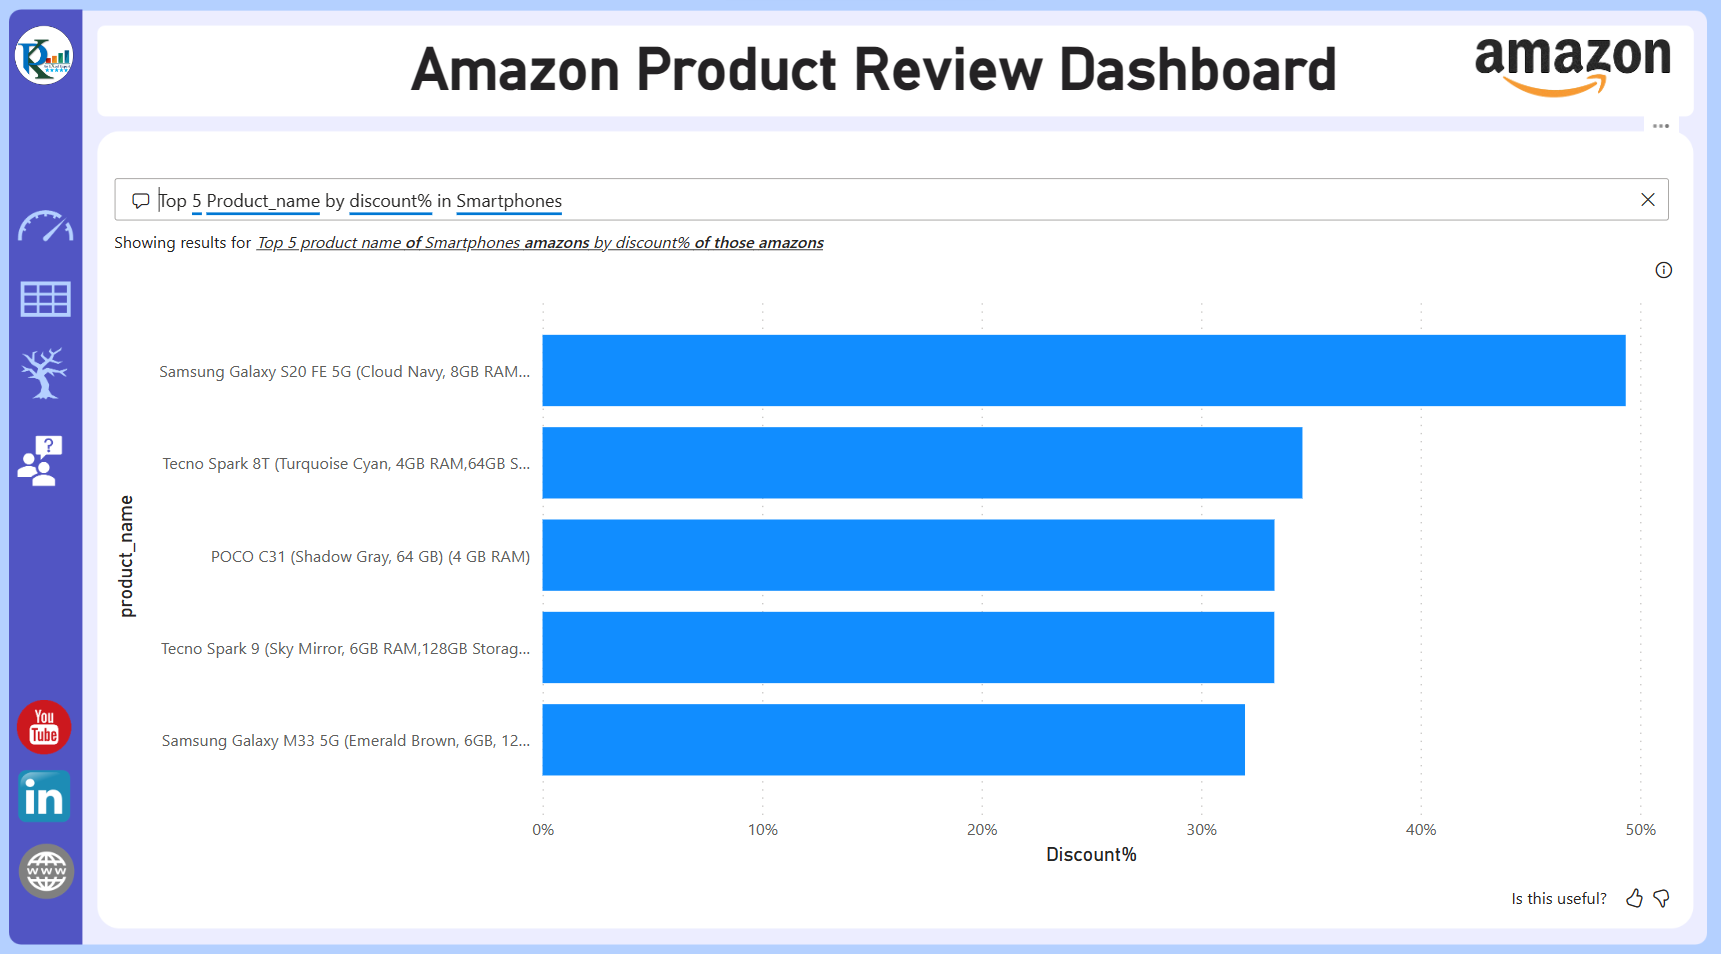
Click to buy Product Review Dashboard in Power BI
Our Power BI dashboard offers a unique Q&A page where you can ask questions in natural language, receiving answers in a visual format.
Hidden Gems: Product Details and Product Tooltip Pages
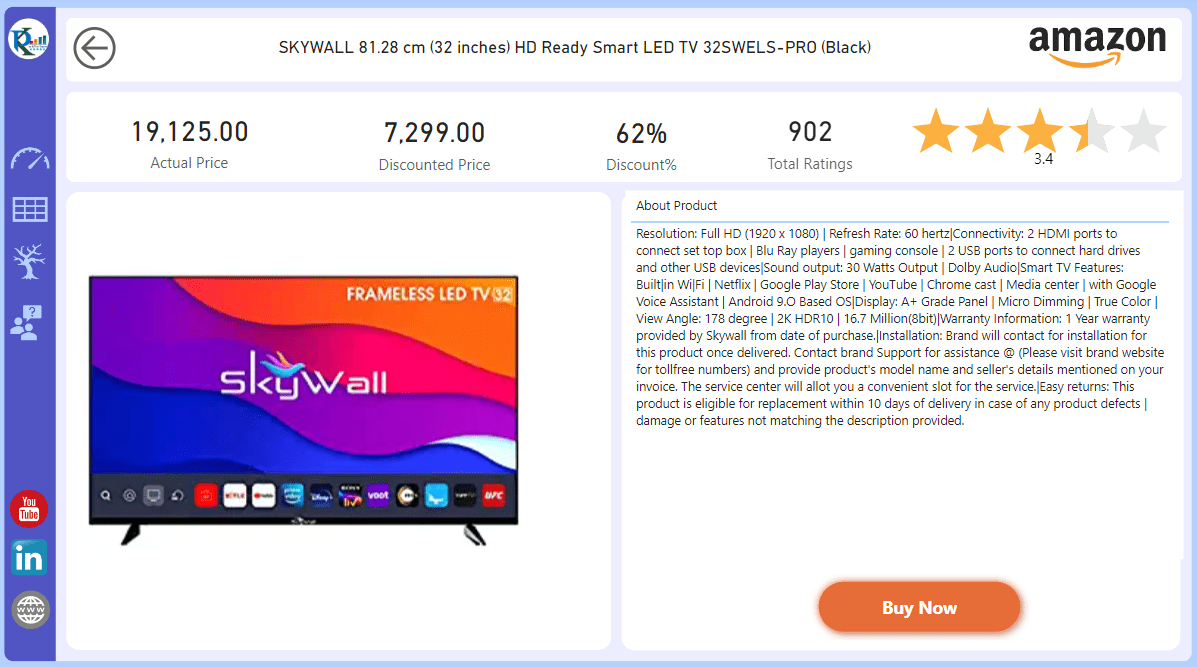
Click to buy Product Review Dashboard in Power BI
Drill deeper into the product data through the hidden Product Details page. You can access this page by clicking on a product name from any page or visual. This page includes detailed insights such as actual price, discounted price, discount percentage, total ratings, average rating displayed in a star rating visual, product image, and description. This page will appear using Drill Through at product level visual from any page.
Click to buy Product Review Dashboard in Power BI
The Product Tooltip page, also hidden, is customized for tooltips. It showcases crucial product details, making data comprehension a breeze.
Advantages of the Amazon Product Review Dashboard in Power BI
- One-Stop-Shop for Product Reviews: The dashboard collates all vital data regarding product reviews in one place.
- Comprehensive and Granular Data Analysis: With different pages dedicated to specific analyses, the dashboard provides both an overview and a detailed breakdown of the data.
- Easy to Use: The dashboard is designed with the user in mind, featuring an intuitive interface, easy-to-use filters, and a simple, interactive Q&A feature.
- Informed Decision Making: The data-driven insights facilitate smarter, faster business decisions.
Opportunities for Improvement
As powerful as the Amazon Product Review Dashboard in Power BI is, there’s always room for enhancement. Future versions might include features like predictive analytics based on historical review data, sentiment analysis from the text of reviews, and integration with other sales and customer data for a 360-degree view of customer behavior.
Best Practices for Utilizing the Amazon Product Review Dashboard
- Regularly Update Your Data: To make the most out of your dashboard, ensure that your data is updated regularly.
- Use Filters: Make full use of the interactive slicers to drill down into specific data points.
- Leverage the Q&A feature: Engage with your data through the Q&A feature. It’s designed to facilitate better understanding and insights.
- Explore the Hidden Pages: Make sure to use the hidden pages for a deeper dive into individual product performances.
Conclusion
Embracing the capabilities of our Amazon Product Review Dashboard in Power BI is truly a step into the power of data when it’s made not just comprehensible, but also accessible. Initially, you may be looking to analyze ratings. In addition, you might want to delve deeper into understanding product performance, or conversely, you could be seeking insights into discounts. Remarkably, this dashboard is a versatile and indispensable tool for any business trading on Amazon. Hence, why not harness the power of data today with our Power BI dashboard? Undeniably, it’s a decision that can propel your business to new heights.
Frequently Asked Questions
Q. How do I navigate to the hidden pages in the Power BI dashboard?
Firstly, let’s discuss the hidden pages in the Power BI dashboard, specifically the “Product Details” and “Product Tooltip” pages. To access them, you simply interact with the dashboard. For instance, by clicking on a product name from any page or visual, you’ll find yourself in the “Product Details” page.
Q. What types of inquiries can I pose on the Q&A page?
Next, moving on to the Q&A page of our Power BI dashboard. This page is designed specifically to handle and respond to queries concerning the data displayed on the dashboard. For example, feel free to ask questions in your natural language about ratings, price ranges, product categories, discount ranges, and so forth. Here’s an illustration: “What is the average rating for Category X?” or “Display the products in the price range of Y to Z dollars.”
Q. What’s the recommended frequency for updating the data in my dashboard?
This brings us to the topic of updating your data in the dashboard. The update frequency greatly depends on how regularly your data source changes or introduces new entries. Should you have daily transactions or reviews, we recommend daily updates. However, if your review accumulation or business operations are more random, consider updating on a weekly or monthly basis. Bear in mind that regular updates ensure your dashboard reflects the most accurate and up-to-date snapshot of your business.
Q. Can I tailor the dashboard to suit my unique business requirements?
Indeed, the Power BI dashboard is renowned for its high degree of customizability. Therefore, based on your business needs, you can modify existing reports or even create new ones. For example, you’re at liberty to alter the visuals, introduce new data sources, create additional slicers or filters, and more. Power BI, known for its user-friendly design interface, allows users to adjust their dashboards to perfectly match their business requirements.
Q. Can I share my Power BI dashboard with others?
Yes, Power BI allows you to share your dashboard with others in your organization. This can help enhance collaboration and ensure everyone is working with the same data.
Q. Is it possible to export data from the Power BI dashboard?
Absolutely. You can export data from the Power BI dashboard into a variety of formats, including Power Point and PDF.
Visit our YouTube channel to learn step-by-step video tutorials
Watch the step-by-step video tutorial:
Click to buy Product Review Dashboard in Power BI